Open-ended survey responses allow you to conduct user research.
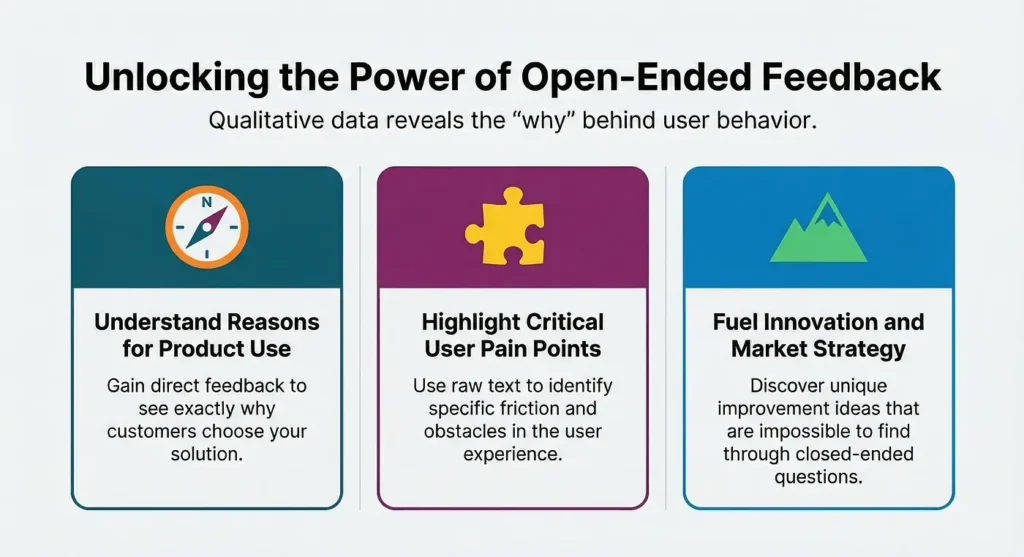
They give you direct feedback, make you understand the reasons for using your product, and highlight your users’ pain points.
They also allow for different possible improvements and ideas for your product development, user experience, and market strategy that would be impossible otherwise.
In this article, we will show you eight such strategies and how you can use them to extract information from raw text.
Why Open-Ended Responses Are Essential
Open questions allow free-response feedback and get into the emotions, specific complaints, and emergent themes that closed questions don’t reveal, providing context for quantitative data and explaining a drop in score or rise in satisfaction: having teams that can do this analysis gives them a really big advantage around things that users care about.
Businesses that integrate structured feedback with survey and feedback management analytics can identify patterns in language that signal shifts like growing demands for personalization before they become widespread issues.
This qualitative layer complements numbers, creating a fuller picture of user sentiment and behavior.
1: Build a Strong Thematic Coding Foundation
Select a representative sample and find out which comments occur most frequently (for example: “slow loading” or “intuitive design”).
Then write the code (for example: “positive usability”, “feature request”) that you would give to these comments, and use this as a flexible template for the entire dataset.
Keep your code concise, but keep an eye out for variations such as “glitchy interface” and “bugs everywhere” that suggest reliability.
Revise your codes, combining them if necessary, based on how distinct they are.
This ensures every response contributes to broader knowledge.
2: Visualize with Word Clouds and Frequency Maps
A word cloud, or frequency counts of phrases like “frustrating” or “seamless”, provides a quick overview of priorities and common criticism.
A frequency count can show that 35% of comments cite “customer support delays” as an issue.
Combine these visualizations with simple graphs showing the frequency of the theme over time, to highlight whether or not a particular change had an impact for better or worse.
Swift visualizations save hours and enable deeper exploration.
3: Layer Sentiment with Topic Breakdowns
User feedback can be classified as positive, negative, or neutral, and can be further categorized by sub-topic, e.g., “fast onboarding” versus “hidden costs”.
Work on each category, for example, 45% of pricing feedback refers to pricing issues.
Use sentiment analysis to map qualitative feedback to prioritized lists of users’ issues and pain points.
Track sentiment over time in surveys (e.g., from negative to neutral after an update related to support).
Layered analysis bridges qualitative depth and quantitative clarity.
4: Harness survey insights tools Early On
Integrate survey insights tools right from the start to automate theme detection and sentiment scoring across large volumes of responses.
Instead, such systems group words and phrases (for instance, “love the speed”, “quick performance”) and flag outliers for a human reviewer.
Our real-time dashboards deliver AI result accuracy and collaboration at the top of your process.
Users have cut their analysis time by more than 60% and can spend more time on strategy rather than text.
5: Design Chained Questions for Deeper Stories
Follow-up open-ended survey questions, such as “What worked well?” and “What could be better and why?” create a conversational feel, encouraging people to describe stories and reveal root causes such as “confusing navigation leading to abandoned carts”.
Chains ease journeys: frustrations, like cascading water, can be explored from one to the next.
When asking questions was conversation-like, it produced a better completion rate.
Chained inquiries can yield more granularity about complex user journeys.
6: Cross-Reference with Quantitative Metrics
Find combinations of helpful open-ended feedback and closed-ended ratings, like low “ease of use” ratings with “overly complex menus”, to identify problems and uncover otherwise hidden opportunities.
Less valued features may still help with retention.
Use this hybrid view to test assumptions.
If people report “mobile issues”, use this view to analyze the issue by device.
In this way, surveys become a hypothesis machine, providing objective data for A/B tests and prioritization.
7: Segment by User Demographics and Behaviors
Responses can be divided based on characteristics such as grouping by age, region, or level of interaction, with advanced features for technical users and simplified versions for novices.
|
Segment |
Top Theme |
Sentiment Score |
|
New Users |
Onboarding Confusion |
-35% |
|
Power Users |
Feature Expansions |
+72% |
|
Mobile-Only |
Performance Lag |
-28% |
|
Desktop Users |
Customization Needs |
+55% |
Tailor actions per segment, like streamlined tutorials for novices. Behavioral segmentation uncovers loyalty drivers, preventing generic solutions that miss key audiences.
Subtle Nuances in Segmentation
Within each segment, look for micro-segments.
If you are targeting mobile users, segments might be iOS lovers or Android malcontents.
Weight the segments with the number of users and revenue opportunity.
8: Prioritize and Close the Feedback Loop
Prioritize the most common, consequential, and high-effort-to-fix themes, especially those that could result in the most harm: ”data privacy fears”.
Develop action plans with owners, timelines, and success measures, and communicate the progress to the respondents.
Key metrics include return visits (net promoter score bumps, theme reductions), and the success of your process should generate a flywheel of continuous improvement as contributors turn into recurring participants and critics.
Pitfalls and Best Practices
Avoid confirmation bias by looking at the sample broadly across all topics and opinions.
Don’t forget low-frequency comments; these often lead to breakout problems and solutions.
Always ground analysis in execution and use sprint planning to create a sense of momentum.
Real-World Impact Examples
Users’ findings caused a software team to fix their “rigid templates”, increasing users by 22%.
Customer service then changed staff due to “inconsistent wait times”, reducing complaints by half.
Surveys in e-commerce sites identified “checkout friction”, and the company fixed this issue, leading to 18% more sales.
These cases present how targeted analysis helps industries witness measurable results.
Scaling for the Future
As response volumes grow, refine your frameworks quarterly, incorporating new themes like rising AI expectations.
Train teams on consistent methods to maintain quality at scale, following best practices for survey design and analysisto ensure reliability as datasets expand.
Over time, this builds institutional knowledge, making surveys a core growth lever.
Over time, this builds institutional knowledge, making surveys a core growth lever.
Mastering open-ended survey responses equips you to act on user voices with precision.
Start with these eight ways on your next project, and transform feedback into your strongest asset.