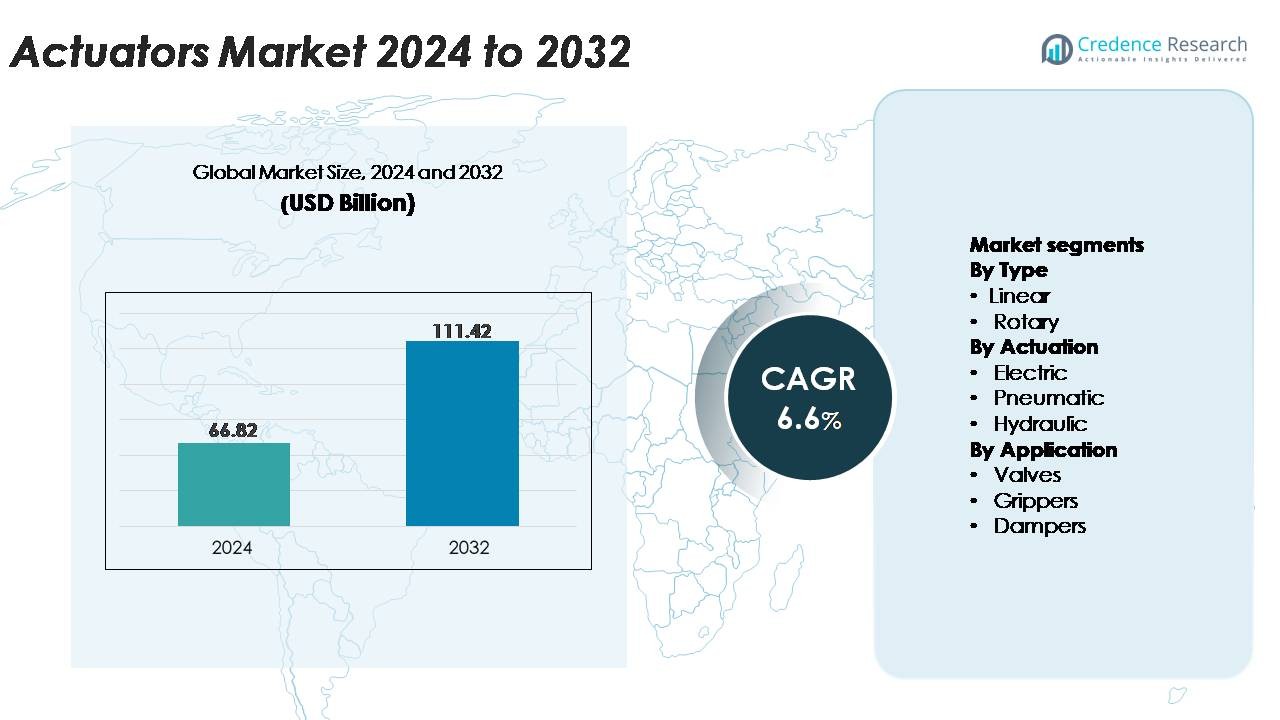
Home » Industrial Goods » Actuators Market

Actuators Market By System (Electric, Pneumatic, Hydraulic, Mechanical, Others) By Type (Rotary, Linear) By Application (Industrial, Commercial) By End-User (Energy and Mining, Construction, Chemical, Automotive, Healthcare, Steel, Military and Defense, Others) – Growth, Future Prospects & Competitive Analysis, 2016 – 2028

Price: $4999

Published: | Report ID: 914 | Report Format : PDF

About this report

The global actuators market report explores the critical analysis of the actuator industry using key parameters. The report consists of investment strategies, the need for investments in the actuators industry, and the multiple benefits for investors. Importantly, this report sets out major changes in the global technical regulations for the actuators industry and how economic and non-economic barriers are helping the market grow. Moreover, the report analyses the global, regional, and country-level historic and forecasted market size. The report also provides a comprehensive analysis of key investment propositions, demand and supply gap, competitors positioning, STAR analysis, SRC analysis, and Tornado analysis. Key technological developments and other analyses include Porter’s five forces analysis, PESTEL analysis, value chain analysis, etc.

REPORT ATTRIBUTE DETAILS
Actuators Market by Volume Yes
Actuators Market by Value Yes
Actuators Market, Tornado Analysis Yes
Actuators Market, STAR Analysis Yes
Actuators Market, SRC Analysis Yes
Actuators Market, Import-Export Data Yes (On Demand)
Actuators Market Pricing Analysis Yes (On Demand)
Actuators Market Segment Analysis ·         By System (Electric, Pneumatic, Hydraulic, Mechanical, and Others)

·         By Type (Rotary and Linear)

·         By Application (Industrial and Commercial)

·         By End-User (Energy and Mining, Construction, Chemical, Automotive, Healthcare, Steel, Military and Defense, and Others)

Actuators Market, Regional Analysis ·         North America (the US and Canada)

·         Europe (Germany, UK, France, Italy, Spain, and the Rest of Europe)

·         Asia Pacific (China, India, Japan, South Korea, South East Asia, and the Rest of Asia Pacific)

·         Latin America (Brazil, Mexico, and the Rest of Latin America)

·         Middle East and Africa (GCC Countries, South Africa, and the Rest of Middle East and Africa)

Actuators Market Key Companies Eaton Corporation plc, Actuonix Motion Devices, Tolomatic Inc, Festo AG & Co. KG, AVK Holdings A/S, Flowserve Corporations, Tyco International Ltd, Schlumberger Limited, KITZ Corporation, Burkert Fluid Control Systems, Emerson Electric Co., Honeywell Corporation, Helix Linear Technologies Inc, Duff-Norton, Parker Hannifin, Tusk Direct Inc, Watts Water Technologies Inc, Rotork Plc, Samson Ag, and Robert Bosch GmbH
Actuators Market Competitive Landscape ·         Market Share Analysis

·         Competitive Benchmarking

·         Key Players Market Positioning

·         Geographical Presence Analysis

·         Major Strategies Adopted

Key Highlights of the report

How are the major segments performing in the Actuators Market?

  • The electric segment led the market in terms of systems in 2021 and is expected to continue throughout the projection period. The rapidly expanding demand for electric actuators market is due to their major benefits, which include increased efficiency, no fluid leaks, low energy consumption, smoother operation, and the ability to be modified for any function.
  • In 2021, the linear type segment accounted for the largest market share, owing to the increased manufacturing automation in the automotive and aerospace industries. The remarkable attributes of linear actuators, such as their reduced space requirements, ease of installation, high reliability, user-friendliness, improved design efficiency, quicker production, and higher-quality manufacturing, have also accelerated their adoption across a variety of industries, such as production machinery, manufacturing, and transportation, fueling the growth of the linear actuators market.
  • The industrial segment led the global market in the application in 2021 and is expected to continue over the forecast period. Robots, Artificial Intelligence, and other automated control systems are used in industrial automation. Rapid digital technological developments are driving the sector’s expansion.
  • The energy and mining end-user segment dominated the market in 2021 due to its rising application in the distillation and refining process, natural oil and gas generation, and crude oil resource extraction. The increasing deployment of energy and mining in the valves and actuators market, as a result of rising demand for liquefied natural gases and gas storage, as well as the growing need for effective management of pressure drilling choke valves, is expected to drive the segment’s growth.
Design Element 2

Access crucial information at unmatched prices!

Request your free sample report today & start making informed decisions powered by Credence Research!

Download Free Sample
CTA Design Element 3

Which region dominated the actuators market?

Asia Pacific region dominated the global actuators market in 2021 and is expected to maintain its dominance throughout the forecast period. The Asia Pacific is the largest market player for manufacturers, as the region’s growing industrial base positively influences the future market growth. The growing demand for automotive vehicles from the upper-middle class propels the Asia Pacific automotive actuators market share. The region’s industries are constantly upgrading their capabilities, necessitating the use of machinery outfitted with new and advanced actuators. China, Japan, and India primarily invest in robotics and automation to gain a tactical advantage in robotics and process automation. Manufacturers of robotics and automation actuators in the Asia Pacific region will benefit greatly from this excellent opportunity for market growth.

actuators-market

How is US Market Performing in the actuators market?

The United States has led the North American automotive actuators market in recent years and is expected to continue to do so throughout the forecast period. The highly advanced industrial automation, offshore, automotive, and transportation sectors are further driving the sales of pneumatic actuators in the United States. According to the International Trade Administration’s 2019 Industrial Automation report, the United States is a major worldwide producer of industrial automation equipment, which is broadly defined as the components and hardware used to automate infrastructures in industrial and manufacturing settings. Besides, the oil and gas sector is undergoing significant change, with the United States on track to lead the global oil and gas trade in the coming years. With increased R&D in the shale gas sector in the United States, the demand for hydraulic actuators is expected to rise significantly over the forecast period.

What is the competitive environment of the actuators market?

Major players in the global actuator market are focusing on increasing their market share through partnerships, collaborations, mergers, and acquisitions. All major manufacturers seek collaborations with Tier 1 and OEM manufacturers to develop next-generation actuators with higher precision. Furthermore, manufacturers focus heavily on emerging markets to strengthen their geographic position. Key players also concentrate on technological developments and new product launches to stay ahead of the competition. For instance, Curtiss-Wright Corporation’s actuation division launched its latest ASSIGN motor program for Exlar FTX and FTP Series actuators in 2021. The FTX and FTP series actuators are well-suited for diverse factory automation production applications. Similarly, ABB introduced its latest i-bus Combi Switch Actuators in 2019 to meet the growing demand for such market solutions in the smart home sector. These actuators allow a device to have switchable and selectable shading features.

Executive Summary

What are all the technical developments being developed in the global actuators market?

Actuators enhance positioning performance, increase control flexibility, stop fluid leaks, boost energy efficiency, and maintain current technologies’ robustness and dependability. The most significant market impact has come from technological advancements in actuators. Actuators that can incorporate smart technologies are becoming more and more in demand as a way to fuel market expansion. The latest market trend is using advanced technologies to develop smart actuators. A smart actuator incorporates all components, including sensors, motors, a communication unit, and a controller. The smart actuator that controls the robots used in various industries can be easily reconfigured, assembled, or disassembled. The expanding use of smart actuators will improve the field’s capabilities for automation and control. Smart actuators offer numerous benefits, including increased productivity and efficiency, improved controllability and diagnostic capabilities, reduced complexity and cabling, lower software and hardware costs, and enhanced machine functionality. For instance, AUMA introduced the high-performance, feature-rich PROFOX actuator series in May 2020. It offers built-in intelligence, high mechanical efficiency, low operating costs, and a small footprint. It is suitable for cogeneration plants, shipbuilding, process industries, and water treatment.

Which are the key investments by the actuator’s market players?

Government investments in ensuring vehicle safety in on-road vehicles, as well as the implementation of stringent vehicle safety regulations, are propelling the automotive actuators market. Market participants in the global actuators market are increasing their efforts and investments to increase production capacity to capitalize on revenue growth opportunities in the global market. Additional factors influencing the growth of the robotics and automation actuators market include increased funding for actuator technology and process automation investments across end-use sectors. The surge in manufacturing investment, with expansion, upgrade, and modification of existing production facilities across the end-user sectors, as well as the adoption of new production lines in emerging nations, is expected to boost the industrial actuators market over the forecast period. Major industry players in the valves and actuators market also focus on increasing their investments through acquisitions, partnerships, collaborations, and mergers to expand their product offerings and develop industrial operational automation processes. For instance, Altra Industrial Motion Corp, a leading manufacturer and supplier of motion control, automation products, and power transmission, announced in January 2022 that it had acquired Nook Industries LLC, Cleveland, an Ohio-based leader in the US linear actuators motion industry. The combination of the Nook business and Altra’s Thomson operating company in its Automation & Specialty segment broadens Altra’s linear product offering. By year four of combined operations, the company anticipates annual cost and sales synergies of approximately USD 6 million. The acquisition of Nook furthers the company’s plan to concentrate Altra’s portfolio on highly engineered products for the power transmission sector.

Some major players in the actuators market are Eaton Corporation plc, Actuonix Motion Devices, Tolomatic Inc, Festo AG & Co. KG, AVK Holdings A/S, Flowserve Corporations, Tyco International Ltd, Schlumberger Limited, KITZ Corporation, Burkert Fluid Control Systems, Emerson Electric Co., Honeywell Corporation, Helix Linear Technologies Inc, Duff-Norton, Parker Hannifin, Tusk Direct Inc, Watts Water Technologies Inc, Rotork Plc, Samson Ag, and Robert Bosch GmbH.

What are the Major Driving Factors for the Actuators Market?

One of the major factors driving the global actuators market growth is the growing application of actuators across various end-use industries such as aerospace and defense, oil and gas, liquid pipelines, and liquefied natural gas (LNG). Rapid industrialization and ongoing technological innovations in the automotive industry, such as the introduction of Advanced Driver Assistance Systems (ADAS), have fueled the growth of the automotive actuators market. Another growth-inducing factor is the emerging trend of automation across multiple industries. The valves and actuators market is primarily driven by accelerating urbanization, rising population, and technological advancements. A significant investment is made in plant and infrastructure renewal, which positively contributes to the growth of the robotics and automation actuators market. The growing need to extract natural resources from difficult locations will further drive hydraulic actuators market growth. The rapidly increasing use of aircraft carriers with actuators on each wing to sustain effective flight at lower airspeeds is expected to boost the actuator’s market share. The introduction of advanced technologies to launch smart electric actuators integrated with all components, such as motors, sensors, communication units, and controllers for easy assembling, reconfiguration, or disassembling, is expected to provide enormous opportunities for the market during the forecast period.

What are the Major Risks for the Actuators Market?

The global actuator market share is restricted by time-consuming leakage repairs, competitive pricing standards, high maintenance costs, and unsatisfactory consumer behavior. Pneumatic actuators convert compressed air energy into mechanical movement. The installation of pneumatic actuators is time-consuming, and the cost of maintaining these actuators is high. Compressors, dryers, lube tubes, air filters, and regulators are part of the pneumatic actuators market. Negligence or a lack of maintenance on these systems can result in issues such as excessive noise and air leaks. Hydraulic actuators use a reservoir to pump hydraulic fluid, which converts energy into mechanical motion. Hydraulic actuators outperform pneumatic actuators in terms of force generation and process control. However, the possibility of fluid leaks, the risk of fire, and the deterioration of actuation systems due to erosion caused by fluid leaks pose a significant threat. As a result, leakage issues and high noise levels caused by operating pneumatic and hydraulic actuators are expected to impede market growth over the forecast period.

Which is the key type in the actuators market?

The linear actuator is expected to dominate the global market during the forecast period due to rising industrial automation in chemical, aerospace, and automotive production plants. In addition, the linear actuators market is expected to grow owing to major players’ increasing focus on technological advancements for linear actuators. For instance, Rotork PLC introduced its most recent AC PAX1 linear actuator in 2020. This new actuator can control pressures ranging from 0-0.5 PSIG to 0-3,000 PSIG. Other factors driving the linear actuators market size include rising demand for fuel-efficient vehicles, stricter environmental regulations, increased automation adoption in developing countries, and the rapidly increasing need to improve combustion control, enhance dependence, and reduce production costs in industrial companies.

How is the actuators market performing in regions?

The Asia Pacific dominated the actuators market in 2021 due to the rising urbanization, industrialization, increasing disposable income, and consistent demand for vehicles in regional developing countries. Rising investments in enabling automation in countries such as Japan and China and introducing technologically advanced actuators in various industries will drive regional robotics and automation actuators market growth. In addition, countries like China, India, and Japan, renowned for their excellence in the production industry, significantly focus on investing in automation to increase their manufacturing and production capacities. For instance, in 2020, over 700 CK modular electrical actuators from Rotork PLC were installed at the Shantou Wastewater Treatment Plant in Guangdong, China, to help enable waste disposal following new environmental regulations.

Furthermore, the North American market is expected to have the highest revenue share in the global actuators market during the forecast period, owing to the presence of well-established and expanding aircraft and automotive manufacturing units in the region. North America led the linear actuators market due to increased demand from aerospace and defense and the emergence of semiconductors and electronic manufacturing industries, and it is expected to grow significantly during the forecast period.

What is the regulatory landscape for the actuators market?

The installation of safety systems in vehicles is being prompted by regulations and standards governing vehicle safety imposed by governmental and regulatory bodies, which propel the global actuators market. For instance, the VISION 2020 TRANSPORT scheme, launched by the Government of India’s Niti Aayog, has been catering to the development of India’s transportation industry in recent years. This opens up new opportunities for pneumatic actuators market manufacturers in India. Besides, market participants frequently employ strategies to aid market growth and product demand. Engaging in multimillion-dollar deals with government agencies and other players to secure profitable revenue for their business is one of the many impressive strategies readily available to protect the environment and business prospects.

What is the Market Size of Actuators regarding value?

The global actuators market is anticipated to grow at a substantial CAGR of 7.7% in the upcoming years. The global actuators industry is estimated to be worth USD 52.6 billion in 2021 and is expected to be worth USD 82.08 billion by 2028.

Shape Your Report to Specific Countries or Regions & Enjoy 30% Off!

What are the major players planning for the future of the actuators market?

The automated valves and actuators market is evolving, with several key market participants transitioning from equipment manufacturers and suppliers to full-service solution providers. Robotics and automation actuators use cloud platforms and analytics engines for data management, processing, and predictive maintenance. End users prefer solution providers over hardware suppliers willing to invest sufficient time and resources in process evaluation, product customization, digitalization service, and support to successfully deploy advanced technology and long-term technological partnerships for streamlining overall plant process efficiency and emissions. For example, in 2020, Rockwell Automation received a contract from Codelco, the world’s largest copper producer. The contract was valued at USD 50 million. This allowed the company to provide various methods for the Chuquicamata underground mine. It involved converting a century-old open-pit mine into a highly developed super cave mine to increase the mine’s lifespan by at least 40 years. The contract also included the supply, configuration, assembly, and engineering of four systems that comprise the mine control system. The top suppliers, manufacturers, and exporters of actuators on the world market include SMC, Rotork, Parker Hannifin, Flowserve, and Emerson Electric. These companies sell actuators under a variety of brand names. They offer various pneumatic and hydraulic actuator variations. Market participants in the actuator market are planning to invest in motion and are embedded with advanced control technologies.

Segmentation of Global Actuators Market –

Global Actuators Market – By System

  • Electric
  • Pneumatic
  • Hydraulic
  • Mechanical
  • Others

Global Actuators Market – By Type

  • Rotary
  • Linear

Global Actuators Market – By Application

  • Industrial
  • Commercial

Global Actuators Market – By End-User

  • Energy and Mining
  • Construction
  • Chemical
  • Automotive
  • Healthcare
  • Steel
  • Military and Defense
  • Others

Global Actuators Market – By Region

  • North America
    • USA
    • Canada
  • Europe
    • Germany
    • France
    • UK
    • Italy
    • Spain
    • Rest of Europe
  • Asia Pacific
    • China
    • Japan
    • India
    • South Korea
    • South-east Asia
    • Rest of Asia Pacific
  • Latin America
    • Brazil
    • Mexico
    • Rest of Latin America
  • Middle East & Africa
    • GCC Countries
    • South Africa
    • Rest of Middle East and Africa

1. Preface
1.1. Report Description
1.1.1. Purpose of the Report
1.1.2. Target Audience
1.1.3. USP and Key Offerings
1.2. Research Scope
1.3. Research Methodology
1.3.1. Phase I – Secondary Research
1.3.2. Phase II – Primary Research
1.3.3. Phase III – Expert Panel Review
1.3.4. Approach Adopted
1.3.4.1. Top-Down Approach
1.3.4.2. Bottom-Up Approach
1.3.5. Assumptions
1.4. Market Segmentation

2. Executive Summary
2.1. Market Snapshot: Global Actuators Market
2.2. Global Actuators Market, By System
2.3. Global Actuators Market, By Type
2.4. Global Actuators Market, By Application
2.5. Global Actuators Market, By End-User
2.6. Global Actuators Market, By Region

3. Market Dynamics & Factors Analysis
3.1. Introduction
3.1.1. Global Actuators Market Value, 2016-2028, (US$ Bn)
3.2. Market Dynamics
3.2.1. Key Growth Trends
3.2.2. Market Drivers
3.2.3. Market Restraints
3.2.4. Market Opportunities
3.2.5. Major Industry Challenges
3.3. Attractive Investment Proposition,2021
3.3.1. System
3.3.2. Type
3.3.3. Application
3.3.4. End-User
3.3.5. Geography

4. Premium Insights
4.1. STAR (Situation, Task, Action, Results) Analysis
4.2. Porter’s Five Forces Analysis
4.2.1. Threat of New Entrants
4.2.2. Bargaining Power of Buyers/Consumers
4.2.3. Bargaining Power of Suppliers
4.2.4. Threat of Substitute Types
4.2.5. Intensity of Competitive Rivalry
4.3. Value Chain Analysis
4.4. Technology Analysis
4.5. Marketing Strategy Analysis
4.5.1. Direct Marketing
4.5.2. Indirect Marketing
4.5.3. Marketing Channel Development Trend

5. Market Positioning of Key Players, 2021
5.1. Company market share of key players, 2021
5.2. Competitive Benchmarking
5.3. Market Positioning of Key Vendors
5.4. Geographical Presence Analysis
5.5. Major Strategies Adopted by Key Players
5.5.1. Key Strategies Analysis
5.5.2. Mergers and Acquisitions
5.5.3. Partnerships
5.5.4. Product Launch
5.5.5. Geographical Expansion
5.5.6. Others

6. COVID-19 Impact Analysis
6.1. Global Actuators Market Pre Vs Post COVID 19, 2019 – 2028
6.2. Impact on Import & Export
6.3. Impact on Demand & Supply

7. Global Actuators Market
7.1. Global Actuators Market, by System, 2016-2028(US$ Bn)
7.1.1. Overview
7.1.2. Global Actuators Market, By System, 2021 vs 2028 (in%)
7.1.3. Global Actuators Market, By Electric, 2016-2028 (US$ Bn)
7.1.4. Global Actuators Market, By Pneumatic, 2016-2028 (US$ Bn)
7.1.5. Global Actuators Market, By Hydraulic, 2016-2028 (US$ Bn)
7.1.6. Global Actuators Market, By Mechanical, 2016-2028 (US$ Bn)
7.1.7. Global Actuators Market, By Others, 2016-2028 (US$ Bn)
7.2. Global Actuators Market, by Type, 2016-2028(US$ Bn)
7.2.1. Overview
7.2.2. Global Actuators Market, By Type, 2021 vs 2028 (in%)
7.2.3. Global Actuators Market, By Rotary, 2016-2028 (US$ Bn)
7.2.4. Global Actuators Market, By Linear, 2016-2028 (US$ Bn)
7.3. Global Actuators Market, by Application, 2016-2028(US$ Bn)
7.3.1. Overview
7.3.2. Global Actuators Market, By Application, 2021 vs 2028 (in%)
7.3.3. Global Actuators Market, By Industrial, 2016-2028 (US$ Bn)
7.3.4. Global Actuators Market, By Commercial, 2016-2028 (US$ Bn)
7.4. Global Actuators Market, by End-User, 2016-2028(US$ Bn)
7.4.1. Overview
7.4.2. Global Actuators Market, By End-User, 2021 vs 2028 (in%)
7.4.3. Global Actuators Market, By Energy and Mining, 2016-2028 (US$ Bn)
7.4.4. Global Actuators Market, By Construction, 2016-2028 (US$ Bn)
7.4.5. Global Actuators Market, By Chemical, 2016-2028 (US$ Bn)
7.4.6. Global Actuators Market, By Automotive, 2016-2028 (US$ Bn)
7.4.7. Global Actuators Market, By Healthcare, 2016-2028 (US$ Bn)
7.4.8. Global Actuators Market, By Steel, 2016-2028 (US$ Bn)
7.4.9. Global Actuators Market, By Military and Defense, 2016-2028 (US$ Bn)
7.4.10. Global Actuators Market, By Others, 2016-2028 (US$ Bn)

8. North America Actuators Market Analysis
8.1. North America Actuators Market, by System, 2016-2028(US$ Bn)
8.1.1. Overview
8.1.2. SRC Analysis
8.2. North America Actuators Market, by Type, 2016-2028(US$ Bn)
8.2.1. Overview
8.2.2. SRC Analysis
8.3. North America Actuators Market, by Application, 2016-2028(US$ Bn)
8.3.1. Overview
8.3.2. SRC Analysis
8.4. North America Actuators Market, by End-User, 2016-2028(US$ Bn)
8.4.1. Overview
8.4.2. SRC Analysis
8.5. North America Actuators Market, by Country, 2016-2028 (US$ Bn)
8.5.1. U.S.
8.5.1.1. U.S. Actuators Market Estimates and Forecast, 2016-2028 (US$ Bn)
8.5.1.2. U.S. Actuators Market, By System, 2016-2028 (US$ Bn)
8.5.1.3. U.S. Actuators Market, By Type, 2016-2028 (US$ Bn)
8.5.1.4. U.S. Actuators Market, By Application, 2016-2028 (US$ Bn)
8.5.1.5. U.S. Actuators Market, By End-User, 2016-2028 (US$ Bn)
8.5.2. Canada
8.5.2.1. Canada Actuators Market Estimates and Forecast, 2016-2028 (US$ Bn)
8.5.2.2. Canada Actuators Markets, By System, 2016-2028 (US$ Bn)
8.5.2.3. Canada Actuators Market, By Type, 2016-2028 (US$ Bn)
8.5.2.4. Canada Actuators Market, By Application, 2016-2028 (US$ Bn)
8.5.2.5. Canada Actuators Market, By End-User, 2016-2028 (US$ Bn)

9. Europe Actuators Market Analysis
9.1. Europe Actuators Market, by System, 2016-2028(US$ Bn)
9.1.1. Overview
9.1.2. SRC Analysis
9.2. Europe Actuators Market, by Type, 2016-2028(US$ Bn)
9.2.1. Overview
9.2.2. SRC Analysis
9.3. Europe Actuators Market, by Application, 2016-2028(US$ Bn)
9.3.1. Overview
9.3.2. SRC Analysis
9.4. Europe Actuators Market, by End-User, 2016-2028(US$ Bn)
9.4.1. Overview
9.4.2. SRC Analysis
9.5. Europe Actuators Market, by Country, 2016-2028 (US$ Bn)
9.5.1. Germany
9.5.1.1. Germany Actuators Market Estimates and Forecast, 2016-2028 (US$ Bn)
9.5.1.2. Germany Actuators Market, By System, 2016-2028 (US$ Bn)
9.5.1.3. Germany Actuators Market, By Type, 2016-2028 (US$ Bn)
9.5.1.4. Germany Actuators Market, By Application, 2016-2028 (US$ Bn)
9.5.1.5. Germany Actuators Market, By End-User, 2016-2028 (US$ Bn)
9.5.2. France
9.5.2.1. France Actuators Market Estimates and Forecast, 2016-2028 (US$ Bn)
9.5.2.2. France Actuators Market, By System, 2016-2028 (US$ Bn)
9.5.2.3. France Actuators Market, By Type, 2016-2028 (US$ Bn)
9.5.2.4. France Actuators Market, By Application, 2016-2028 (US$ Bn)
9.5.2.5. France Actuators Market, By End-User, 2016-2028 (US$ Bn)
9.5.3. UK
9.5.3.1. UK Actuators Market Estimates and Forecast, 2016-2028 (US$ Bn)
9.5.3.2. UK Actuators Market, By System, 2016-2028 (US$ Bn)
9.5.3.3. UK Actuators Market, By Type, 2016-2028 (US$ Bn)
9.5.3.4. UK Actuators Market, By Application, 2016-2028 (US$ Bn)
9.5.3.5. UK Actuators Market, By End-User, 2016-2028 (US$ Bn)
9.5.4. Italy
9.5.4.1. Italy Actuators Market Estimates and Forecast, 2016-2028 (US$ Bn)
9.5.4.2. Italy Actuators Market, By System, 2016-2028 (US$ Bn)
9.5.4.3. Italy Actuators Market, By Type, 2016-2028 (US$ Bn)
9.5.4.4. Italy Actuators Market, By Application, 2016-2028 (US$ Bn)
9.5.4.5. Italy Actuators Market, By End-User, 2016-2028 (US$ Bn)
9.5.5. Spain
9.5.5.1. Spain Actuators Market Estimates and Forecast, 2016-2028 (US$ Bn)
9.5.5.2. Spain Actuators Market, By System, 2016-2028 (US$ Bn)
9.5.5.3. Spain Actuators Market, By Type, 2016-2028 (US$ Bn)
9.5.5.4. Spain Actuators Market, By Application, 2016-2028 (US$ Bn)
9.5.5.5. Spain Actuators Market, By End-User, 2016-2028 (US$ Bn)
9.5.6. Rest of Europe
9.5.6.1. Rest of Europe Actuators Market Estimates and Forecast, 2016-2028 (US$ Bn)
9.5.6.2. Rest of Europe Actuators Market, By System, 2016-2028 (US$ Bn)
9.5.6.3. Rest of Europe Actuators Market, By Type, 2016-2028 (US$ Bn)
9.5.6.4. Rest of Europe Actuators Market, By Application, 2016-2028 (US$ Bn)
9.5.6.5. Rest of Europe Actuators Market, By End-User, 2016-2028 (US$ Bn)

10. Asia Pacific Actuators Market Analysis
10.1. Asia Pacific Actuators Market, by System, 2016-2028(US$ Bn)
10.1.1. Overview
10.1.2. SRC Analysis
10.2. Asia Pacific Actuators Market, by Type, 2016-2028(US$ Bn)
10.2.1. Overview
10.2.2. SRC Analysis
10.3. Asia Pacific Actuators Market, by Application, 2016-2028(US$ Bn)
10.3.1. Overview
10.3.2. SRC Analysis
10.4. Asia Pacific Actuators Market, by End-User, 2016-2028(US$ Bn)
10.4.1. Overview
10.4.2. SRC Analysis
10.5. Asia Pacific Actuators Market, by Country, 2016-2028 (US$ Bn)
10.5.1. China
10.5.1.1. China Actuators Market Estimates and Forecast, 2016-2028 (US$ Bn)
10.5.1.2. China Actuators Market, By System, 2016-2028 (US$ Bn)
10.5.1.3. China Actuators Market, By Type, 2016-2028 (US$ Bn)
10.5.1.4. China Actuators Market, By Application, 2016-2028 (US$ Bn)
10.5.1.5. China Actuators Market, By End-User, 2016-2028 (US$ Bn)
10.5.2. Japan
10.5.2.1. Japan Actuators Market Estimates and Forecast, 2016-2028 (US$ Bn)
10.5.2.2. Japan Actuators Market, By System, 2016-2028 (US$ Bn)
10.5.2.3. Japan Actuators Market, By Type, 2016-2028 (US$ Bn)
10.5.2.4. Japan Actuators Market, By Application, 2016-2028 (US$ Bn)
10.5.2.5. Japan Actuators Market, By End-User, 2016-2028 (US$ Bn)
10.5.3. India
10.5.3.1. India Actuators Market Estimates and Forecast, 2016-2028 (US$ Bn)
10.5.3.2. India Actuators Market, By System, 2016-2028 (US$ Bn)
10.5.3.3. India Actuators Market, By Type, 2016-2028 (US$ Bn)
10.5.3.4. India Actuators Market, By Application, 2016-2028 (US$ Bn)
10.5.3.5. India Actuators Market, By End-User, 2016-2028 (US$ Bn)
10.5.4. South Korea
10.5.4.1. South Korea Actuators Market Estimates and Forecast, 2016-2028 (US$ Bn)
10.5.4.2. South Korea Actuators Market, By System, 2016-2028 (US$ Bn)
10.5.4.3. South Korea Actuators Market, By Type, 2016-2028 (US$ Bn)
10.5.4.4. South Korea Actuators Market, By Application, 2016-2028 (US$ Bn)
10.5.4.5. South Korea Actuators Market, By End-User, 2016-2028 (US$ Bn)
10.5.5. South-East Asia
10.5.5.1. South-East Asia Actuators Market Estimates and Forecast, 2016-2028 (US$ Bn)
10.5.5.2. South-East Asia Actuators Market, By System, 2016-2028 (US$ Bn)
10.5.5.3. South-East Asia Actuators Market, By Type, 2016-2028 (US$ Bn)
10.5.5.4. South-East Asia Actuators Market, By Application, 2016-2028 (US$ Bn)
10.5.5.5. South-East Asia Actuators Market, By End-User, 2016-2028 (US$ Bn)
10.5.6. Rest of Asia Pacific
10.5.6.1. Rest of Asia Pacific Actuators Market Estimates and Forecast, 2016-2028 (US$ Bn)
10.5.6.2. Rest of Asia Pacific Actuators Market, By System, 2016-2028 (US$ Bn)
10.5.6.3. Rest of Asia Pacific Actuators Market, By Type, 2016-2028 (US$ Bn)
10.5.6.4. Rest of Asia Pacific Actuators Market, By Application, 2016-2028 (US$ Bn)
10.5.6.5. Rest of Asia Pacific Actuators Market, By End-User, 2016-2028 (US$ Bn)

11. Latin America Actuators Market Analysis
11.1. Latin America Actuators Market, by System, 2016-2028(US$ Bn)
11.1.1. Overview
11.1.2. SRC Analysis
11.2. Latin America Actuators Market, by Type, 2016-2028(US$ Bn)
11.2.1. Overview
11.2.2. SRC Analysis
11.3. Latin America Actuators Market, by Application, 2016-2028(US$ Bn)
11.3.1. Overview
11.3.2. SRC Analysis
11.4. Latin America Actuators Market, by End-User, 2016-2028(US$ Bn)
11.4.1. Overview
11.4.2. SRC Analysis
11.5. Latin America Actuators Market, by Country, 2016-2028 (US$ Bn)
11.5.1. Brazil
11.5.1.1. Brazil Actuators Market Estimates and Forecast, 2016-2028 (US$ Bn)
11.5.1.2. Brazil Actuators Market, By System, 2016-2028 (US$ Bn)
11.5.1.3. Brazil Actuators Market, By Type, 2016-2028 (US$ Bn)
11.5.1.4. Brazil Actuators Market, By Application, 2016-2028 (US$ Bn)
11.5.1.5. Brazil Actuators Market, By End-User, 2016-2028 (US$ Bn)
11.5.2. Mexico
11.5.2.1. Mexico Actuators Market Estimates and Forecast, 2016-2028 (US$ Bn)
11.5.2.2. Mexico Actuators Market, By System, 2016-2028 (US$ Bn)
11.5.2.3. Mexico Actuators Market, By Type, 2016-2028 (US$ Bn)
11.5.2.4. Mexico Actuators Market, By Application, 2016-2028 (US$ Bn)
11.5.2.5. Mexico Actuators Market, By End-User, 2016-2028 (US$ Bn)
11.5.3. Rest of Latin America
11.5.3.1. Rest of Latin America Actuators Market Estimates and Forecast, 2016-2028 (US$ Bn)
11.5.3.2. Rest of Latin America Actuators Market, By System, 2016-2028 (US$ Bn)
11.5.3.3. Rest of Latin America Actuators Market, By Type, 2016-2028 (US$ Bn)
11.5.3.4. Rest of Latin America Actuators Market, By Application, 2016-2028 (US$ Bn)
11.5.3.5. Rest of Latin America Actuators Market, By End-User, 2016-2028 (US$ Bn)

12. Middle East and Africa Actuators Market Analysis
12.1. Middle East and Africa Actuators Market, by System, 2016-2028(US$ Bn)
12.1.1. Overview
12.1.2. SRC Analysis
12.2. Middle East and Africa Actuators Market, by Type, 2016-2028(US$ Bn)
12.2.1. Overview
12.2.2. SRC Analysis
12.3. Middle East and Africa Actuators Market, by Application, 2016-2028(US$ Bn)
12.3.1. Overview
12.3.2. SRC Analysis
12.4. Middle East and Africa Actuators Market, by End-User, 2016-2028(US$ Bn)
12.4.1. Overview
12.4.2. SRC Analysis
12.5. Middle East and Africa Actuators Market, by Country, 2016-2028 (US$ Bn)
12.5.1. GCC Countries
12.5.1.1. GCC Countries Actuators Market Estimates and Forecast, 2016-2028 (US$ Bn)
12.5.1.2. GCC Countries Actuators Market, By System, 2016-2028 (US$ Bn)
12.5.1.3. GCC Countries Actuators Market, By Type, 2016-2028 (US$ Bn)
12.5.1.4. GCC Countries Actuators Market, By Application, 2016-2028 (US$ Bn)
12.5.1.5. GCC Countries Actuators Market, By End-User, 2016-2028 (US$ Bn)
12.5.2. South Africa
12.5.2.1. South Africa Actuators Market Estimates and Forecast, 2016-2028 (US$ Bn)
12.5.2.2. South Africa Actuators Market, By System, 2016-2028 (US$ Bn)
12.5.2.3. South Africa Actuators Market, By Type, 2016-2028 (US$ Bn)
12.5.2.4. South Africa Actuators Market, By Application, 2016-2028 (US$ Bn)
12.5.2.5. South Africa Actuators Market, By End-User, 2016-2028 (US$ Bn)
12.5.3. Rest of Middle East and Africa
12.5.3.1. Rest of Middle East and Africa Actuators Market Estimates and Forecast, 2016-2028 (US$ Bn)
12.5.3.2. Rest of Middle East and Africa Actuators Market, By System, 2016-2028 (US$ Bn)
12.5.3.3. Rest of Middle East and Africa Actuators Market, By Type, 2016-2028 (US$ Bn)
12.5.3.4. Rest of Middle East and Africa Actuators Market, By Application, 2016-2028 (US$ Bn)
12.5.3.5. Rest of Middle East and Africa Actuators Market, By End-User, 2016-2028 (US$ Bn)

13. Company Profiles
13.1. Eaton Corporation plc
13.1.1. Company Overview
13.1.2. Products/Services Portfolio
13.1.3. Geographical Presence
13.1.4. Financial Summary
13.1.4.1. Market Revenue and Net Profit (2019-2021)
13.1.4.2. Business Segment Revenue Analysis
13.1.4.3. Geographical Revenue Analysis
13.2. Actuonix Motion Devices
13.3. Tolomatic Inc
13.4. Festo AG & Co. KG
13.5. AVK Holdings A/S
13.6. Flowserve Corporations
13.7. Tyco International Ltd
13.8. Schlumberger Limited
13.9. KITZ Corporation
13.10. Burkert Fluid Control Systems
13.11. Emerson Electric Co.
13.12. Honeywell Corporation
13.13. Helix Linear Technologies Inc
13.14. Duff-Norton
13.15. Parker Hannifin
13.16. Tusk Direct Inc
13.17. Watts Water Technologies Inc
13.18. Rotork Plc
13.19. Samson Ag
13.20. Robert Bosch GmbH

List of Figures

FIG. 1 Global Actuators Market: Research Methodology
FIG. 2 Market Size Estimation – Top Down & Bottom up Approach
FIG. 3 Global Actuators Market Segmentation
FIG. 4 Global Actuators Market, by System, 2021 (US$ Bn)
FIG. 5 Global Actuators Market, by Type, 2021 (US$ Bn)
FIG. 6 Global Actuators Market, by Application, 2021 (US$ Bn)
FIG. 7 Global Actuators Market, by End-User, 2021 (US$ Bn)
FIG. 8 Global Actuators Market, by Geography, 2021 (US$ Bn)
FIG. 9 Attractive Investment Proposition, by System, 2021
FIG. 10 Attractive Investment Proposition, by Type, 2021
FIG. 11 Attractive Investment Proposition, by Application, 2021
FIG. 12 Attractive Investment Proposition, by End-User, 2021
FIG. 13 Attractive Investment Proposition, by Geography, 2021
FIG. 14 Global Market Share Analysis of Key Actuators Market Manufacturers, 2021
FIG. 15 Global Market Positioning of Key Actuators Market Manufacturers, 2021
FIG. 16 Global Actuators Market Value Contribution, By System, 2021 & 2028 (Value %)
FIG. 17 Global Actuators Market, by Electric, Value, 2016-2028 (US$ Bn)
FIG. 18 Global Actuators Market, by Pneumatic, Value, 2016-2028 (US$ Bn)
FIG. 19 Global Actuators Market, by Hydraulic, Value, 2016-2028 (US$ Bn)
FIG. 20 Global Actuators Market, by Mechanical, Value, 2016-2028 (US$ Bn)
FIG. 21 Global Actuators Market, by Others, Value, 2016-2028 (US$ Bn)
FIG. 22 Global Actuators Market Value Contribution, By Type, 2021 & 2028 (Value %)
FIG. 23 Global Actuators Market, by Rotary, Value, 2016-2028 (US$ Bn)
FIG. 24 Global Actuators Market, by Linear, Value, 2016-2028 (US$ Bn)
FIG. 25 Global Actuators Market Value Contribution, By Application, 2021 & 2028 (Value %)
FIG. 26 Global Actuators Market, by Industrial, Value, 2016-2028 (US$ Bn)
FIG. 27 Global Actuators Market, by Commercial, Value, 2016-2028 (US$ Bn)
FIG. 28 Global Actuators Market Value Contribution, By End-User, 2021 & 2028 (Value %)
FIG. 29 Global Actuators Market, by Energy and Mining, Value, 2016-2028 (US$ Bn)
FIG. 30 Global Actuators Market, by Construction, Value, 2016-2028 (US$ Bn)
FIG. 31 Global Actuators Market, by Chemical, Value, 2016-2028 (US$ Bn)
FIG. 32 Global Actuators Market, by Automotive, Value, 2016-2028 (US$ Bn)
FIG. 33 Global Actuators Market, by Healthcare, Value, 2016-2028 (US$ Bn)
FIG. 34 Global Actuators Market, by Steel, Value, 2016-2028 (US$ Bn)
FIG. 35 Global Actuators Market, by Military and Defense, Value, 2016-2028 (US$ Bn)
FIG. 36 Global Actuators Market, by Others, Value, 2016-2028 (US$ Bn)
FIG. 37 U.S. Actuators Market, 2016-2028 (US$ Bn)
FIG. 38 Canada Actuators Market, 2016-2028 (US$ Bn)
FIG. 39 Germany Actuators Market, 2016-2028 (US$ Bn)
FIG. 40 France Actuators Market, 2016-2028 (US$ Bn)
FIG. 41 U.K. Actuators Market, 2016-2028 (US$ Bn)
FIG. 42 Italy Actuators Market, 2016-2028 (US$ Bn)
FIG. 43 Spain Actuators Market, 2016-2028 (US$ Bn)
FIG. 44 Rest of Europe Actuators Market, 2016-2028 (US$ Bn)
FIG. 45 China Actuators Market, 2016-2028 (US$ Bn)
FIG. 46 Japan Actuators Market, 2016-2028 (US$ Bn)
FIG. 47 India Actuators Market, 2016-2028 (US$ Bn)
FIG. 48 South Korea Actuators Market, 2016-2028 (US$ Bn)
FIG. 49 Southeast Asia Actuators Market, 2016-2028 (US$ Bn)
FIG. 50 Rest of Asia Pacific Actuators Market, 2016-2028 (US$ Bn)
FIG. 51 Latin America Actuators Market, 2016-2028 (US$ Bn)
FIG. 52 Brazil Actuators Market, 2016-2028 (US$ Bn)
FIG. 53 Mexico Actuators Market, 2016-2028 (US$ Bn)
FIG. 54 Rest of Latin America Actuators Market, 2016-2028 (US$ Bn)
FIG. 55 Middle East & Africa Actuators Market, 2016-2028 (US$ Bn)
FIG. 56 GCC Countries Actuators Market, 2016-2028 (US$ Bn)
FIG. 57 South Africa Actuators Market, 2016-2028 (US$ Bn)
FIG. 58 Rest of Middle East and Africa Actuators Market, 2016-2028 (US$ Bn)

List of Tables

TABLE 1 Market Snapshot: Global Actuators Market
TABLE 2 Global Actuators Market, by Competitive Benchmarking, 2021
TABLE 3 Global Actuators Market, by Geographical Presence Analysis, 2021
TABLE 4 Global Actuators Market, by Key Strategies Analysis, 2021
TABLE 5 Global Actuators Market, by System, 2016-2028 (US$ Bn)
TABLE 6 Global Actuators Market, by Type, 2016-2028 (US$ Bn)
TABLE 7 Global Actuators Market, by Application, 2016-2028 (US$ Bn)
TABLE 8 Global Actuators Market, by End-User, 2016-2028 (US$ Bn)
TABLE 9 Global Actuators Market, by Geography, 2016-2028 (US$ Bn)
TABLE 10 North America Actuators Market, by System, 2016-2028 (US$ Bn)
TABLE 11 North America Actuators Market, by Type, 2016-2028 (US$ Bn)
TABLE 12 North America Actuators Market, by Application, 2016-2028 (US$ Bn)
TABLE 13 North America Actuators Market, by End-User, 2016-2028 (US$ Bn)
TABLE 14 North America Actuators Market, by Country, 2016-2028 (US$ Bn)
TABLE 15 US Actuators Market, by System, 2016-2028 (US$ Bn)
TABLE 16 US Actuators Market, by Type, 2016-2028 (US$ Bn)
TABLE 17 US Actuators Market, by Application, 2016-2028 (US$ Bn)
TABLE 18 US Actuators Market, by End-User, 2016-2028 (US$ Bn)
TABLE 19 Canada Actuators Market, by System, 2016-2028 (US$ Bn)
TABLE 20 Canada Actuators Market, by Type, 2016-2028 (US$ Bn)
TABLE 21 Canada Actuators Market, by Application, 2016-2028 (US$ Bn)
TABLE 22 Canada Actuators Market, by End-User, 2016-2028 (US$ Bn)
TABLE 23 Europe Actuators Market, by System, 2016-2028 (US$ Bn)
TABLE 24 Europe Actuators Market, by Type, 2016-2028 (US$ Bn)
TABLE 25 Europe Actuators Market, by Application, 2016-2028 (US$ Bn)
TABLE 26 Europe Actuators Market, by End-User, 2016-2028 (US$ Bn)
TABLE 27 Europe Actuators Market, by Country, 2016-2028 (US$ Bn)
TABLE 28 Germany Actuators Market, by System, 2016-2028 (US$ Bn)
TABLE 29 Germany Actuators Market, by Type, 2016-2028 (US$ Bn)
TABLE 30 Germany Actuators Market, by Application, 2016-2028 (US$ Bn)
TABLE 31 Germany Actuators Market, by End-User, 2016-2028 (US$ Bn)
TABLE 32 France Actuators Market, by System, 2016-2028 (US$ Bn)
TABLE 33 France Actuators Market, by Type, 2016-2028 (US$ Bn)
TABLE 34 France Actuators Market, by Application, 2016-2028 (US$ Bn)
TABLE 35 France Actuators Market, by End-User, 2016-2028 (US$ Bn)
TABLE 36 UK Actuators Market, by System, 2016-2028 (US$ Bn)
TABLE 37 UK Actuators Market, by Type, 2016-2028 (US$ Bn)
TABLE 38 UK Actuators Market, by Application, 2016-2028 (US$ Bn)
TABLE 39 UK Actuators Market, by End-User, 2016-2028 (US$ Bn)
TABLE 40 Italy Actuators Market, by System, 2016-2028 (US$ Bn)
TABLE 41 Italy Actuators Market, by Type, 2016-2028 (US$ Bn)
TABLE 42 Italy Actuators Market, by Application, 2016-2028 (US$ Bn)
TABLE 43 Italy Actuators Market, by End-User, 2016-2028 (US$ Bn)
TABLE 44 Spain Actuators Market, by System, 2016-2028 (US$ Bn)
TABLE 45 Spain Actuators Market, by Type, 2016-2028 (US$ Bn)
TABLE 46 Spain Actuators Market, by Application, 2016-2028 (US$ Bn)
TABLE 47 Spain Actuators Market, by End-User, 2016-2028 (US$ Bn)
TABLE 48 Rest of Europe Actuators Market, by System, 2016-2028 (US$ Bn)
TABLE 49 Rest of Europe Actuators Market, by Type, 2016-2028 (US$ Bn)
TABLE 50 Rest of Europe Actuators Market, by Application, 2016-2028 (US$ Bn)
TABLE 51 Rest of Europe Actuators Market, by End-User, 2016-2028 (US$ Bn)
TABLE 52 Asia Pacific Actuators Market, by System, 2016-2028 (US$ Bn)
TABLE 53 Asia Pacific Actuators Market, by Type, 2016-2028 (US$ Bn)
TABLE 54 Asia Pacific Actuators Market, by Application, 2016-2028 (US$ Bn)
TABLE 55 Asia Pacific Actuators Market, by End-User, 2016-2028 (US$ Bn)
TABLE 56 Asia Pacific Actuators Market, by Country, 2016-2028 (US$ Bn)
TABLE 57 China Actuators Market, by System, 2016-2028 (US$ Bn)
TABLE 58 China Actuators Market, by Type, 2016-2028 (US$ Bn)
TABLE 59 China Actuators Market, by Application, 2016-2028 (US$ Bn)
TABLE 60 China Actuators Market, by End-User, 2016-2028 (US$ Bn)
TABLE 61 Japan Actuators Market, by System, 2016-2028 (US$ Bn)
TABLE 62 Japan Actuators Market, by Type, 2016-2028 (US$ Bn)
TABLE 63 Japan Actuators Market, by Application, 2016-2028 (US$ Bn)
TABLE 64 Japan Actuators Market, by End-User, 2016-2028 (US$ Bn)
TABLE 65 India Actuators Market, by System, 2016-2028 (US$ Bn)
TABLE 66 India Actuators Market, by Type, 2016-2028 (US$ Bn)
TABLE 67 India Actuators Market, by Application, 2016-2028 (US$ Bn)
TABLE 68 India Actuators Market, by End-User, 2016-2028 (US$ Bn)
TABLE 69 South Korea Actuators Market, by System, 2016-2028 (US$ Bn)
TABLE 70 South Korea Actuators Market, by Type, 2016-2028 (US$ Bn)
TABLE 71 South Korea Actuators Market, by Application, 2016-2028 (US$ Bn)
TABLE 72 South Korea Actuators Market, by End-User, 2016-2028 (US$ Bn)
TABLE 73 South East Asia Actuators Market, by System, 2016-2028 (US$ Bn)
TABLE 74 South East Asia Actuators Market, by Type, 2016-2028 (US$ Bn)
TABLE 75 South East Asia Actuators Market, by Application, 2016-2028 (US$ Bn)
TABLE 76 South East Asia Actuators Market, by End-User, 2016-2028 (US$ Bn)
TABLE 77 Rest of Asia Pacific Actuators Market, by System, 2016-2028 (US$ Bn)
TABLE 78 Rest of Asia Pacific Actuators Market, by Type, 2016-2028 (US$ Bn)
TABLE 79 Rest of Asia Pacific Actuators Market, by Application, 2016-2028 (US$ Bn)
TABLE 80 Rest of Asia Pacific Actuators Market, by End-User, 2016-2028 (US$ Bn)
TABLE 81 Latin America Actuators Market, by System, 2016-2028 (US$ Bn)
TABLE 82 Latin America Actuators Market, by Type, 2016-2028 (US$ Bn)
TABLE 83 Latin America Actuators Market, by Application, 2016-2028 (US$ Bn)
TABLE 84 Latin America Actuators Market, by End-User, 2016-2028 (US$ Bn)
TABLE 85 Latin America Actuators Market, by Country, 2016-2028 (US$ Bn)
TABLE 86 Brazil Actuators Market, by System, 2016-2028 (US$ Bn)
TABLE 87 Brazil Actuators Market, by Type, 2016-2028 (US$ Bn)
TABLE 88 Brazil Actuators Market, by Application, 2016-2028 (US$ Bn)
TABLE 89 Brazil Actuators Market, by End-User, 2016-2028 (US$ Bn)
TABLE 90 Mexico Actuators Market, by System, 2016-2028 (US$ Bn)
TABLE 91 Mexico Actuators Market, by Type, 2016-2028 (US$ Bn)
TABLE 92 Mexico Actuators Market, by Application, 2016-2028 (US$ Bn)
TABLE 93 Mexico Actuators Market, by End-User, 2016-2028 (US$ Bn)
TABLE 94 Rest of Latin America Actuators Market, by System, 2016-2028 (US$ Bn)
TABLE 95 Rest of Latin America Actuators Market, by Type, 2016-2028 (US$ Bn)
TABLE 96 Rest of Latin America Actuators Market, by Application, 2016-2028 (US$ Bn)
TABLE 97 Rest of Latin America Actuators Market, by End-User, 2016-2028 (US$ Bn)
TABLE 98 Middle East and Africa Actuators Market, by System, 2016-2028 (US$ Bn)
TABLE 99 Middle East and Africa Actuators Market, by Type, 2016-2028 (US$ Bn)
TABLE 100 Middle East and Africa Actuators Market, by Application, 2016-2028 (US$ Bn)
TABLE 101 Middle East and Africa Actuators Market, by End-User, 2016-2028 (US$ Bn)
TABLE 102 Middle East and Africa Actuators Market, by Country, 2016-2028 (US$ Bn)
TABLE 103 GCC Countries Actuators Market, by System, 2016-2028 (US$ Bn)
TABLE 104 GCC Countries Actuators Market, by Type, 2016-2028 (US$ Bn)
TABLE 105 GCC Countries Actuators Market, by Application, 2016-2028 (US$ Bn)
TABLE 106 GCC Countries Actuators Market, by End-User, 2016-2028 (US$ Bn)
TABLE 107 South Africa Actuators Market, by System, 2016-2028 (US$ Bn)
TABLE 108 South Africa Actuators Market, by Type, 2016-2028 (US$ Bn)
TABLE 109 South Africa Actuators Market, by Application, 2016-2028 (US$ Bn)
TABLE 110 South Africa Actuators Market, by End-User, 2016-2028 (US$ Bn)
TABLE 111 Rest of Middle East and Africa Actuators Market, by System, 2016-2028 (US$ Bn)
TABLE 112 Rest of Middle East and Africa Actuators Market, by Type, 2016-2028 (US$ Bn)
TABLE 113 Rest of Middle East and Africa Actuators Market, by Application, 2016-2028 (US$ Bn)
TABLE 114 Rest of Middle East and Africa Actuators Market, by End-User, 2016-2028 (US$ Bn)

Frequently Asked Questions

How does COVID-19 impact the global actuators market?

The covid-19 pandemic negatively affected the global actuators market owing to the shutting down of production and manufacturing hubs and the sudden decline in key application sectors such as industrial automation, construction, automotive, offshore, and transportation.

Which is the leading region of the market for actuators?

The Asia Pacific actuators market is expected to grow at a faster rate during the forecast period, owing to rising investments in automation by countries such as China, Japan, and India, as well as the development of technologically advanced actuators, which will lead to an increase in the adoption of robotics and automation actuators devices in a variety of industries.

What are the key drivers for the growth of the actuators market?

Increasing productivity and reducing downtime in industrial facilities and manufacturing activities worldwide are expected to drive the global market for valves and actuators. Developing highly efficient actuators and growing demand for industrial robots and process automation across various industrial verticals are key factors propelling the growth of robotics and automation actuators.

Which is the major segment in the actuators market by the system?

The electric segment had a major share in the global market in 2021.

Which is the major segment in the actuators market by type?

The linear segment had a major share in the global market.

Industrial Process Variable Instruments Market

Published:
Report ID: 33417

Electrical Enclosure Market

Published:
Report ID: 5609

Rice Milling Machinery Market

Published:
Report ID: 31803

Vacuum Coating Equipment Market

Published:
Report ID: 23234

Rotary Dryer Market

Published:
Report ID: 23173

Rolling Bed Dryer Market

Published:
Report ID: 23152

Fluidized Bed Dryer Market

Published:
Report ID: 22956

Hexagon Head Set Screws Market

Published:
Report ID: 19289

Peltier Cooled Incubator Market

Published:
Report ID: 21117

Personal Care Active Ingredients Market

Published:
Report ID: 20851

Fill-Finish Manufacturing Equipment Market

Published:
Report ID: 20349

Flat Washers Market

Published:
Report ID: 20332

Purchase Options

$2999
Delivery Format: Excel.
$4999
Designed for the individual purchaser.
$6999
Users located at a single corporate site or regional office.
$7999
Allowed for unlimited sharing globally within one company.
Smallform of Sample request

Have a question?

User Profile

Don’t settle for less – trust Mitul to help you find the best solution.

Report delivery within 24 to 48 hours

– Other Info –

What people say?-

User Review

I am very impressed with the information in this report. The author clearly did their research when they came up with this product and it has already given me a lot of ideas.

Jana Schmidt
CEDAR CX Technologies

– Connect with us –

Phone

+91 6232 49 3207


support

24/7 Research Support


sales@credenceresearch.com

– Research Methodology –

Going beyond the basics: advanced techniques in research methodology

– Trusted By –

Pepshi, LG, Nestle
Motorola, Honeywell, Johnson and johnson
LG Chem, SIEMENS, Pfizer
Unilever, Samsonite, QIAGEN