
Anti-Venom Market Overview:
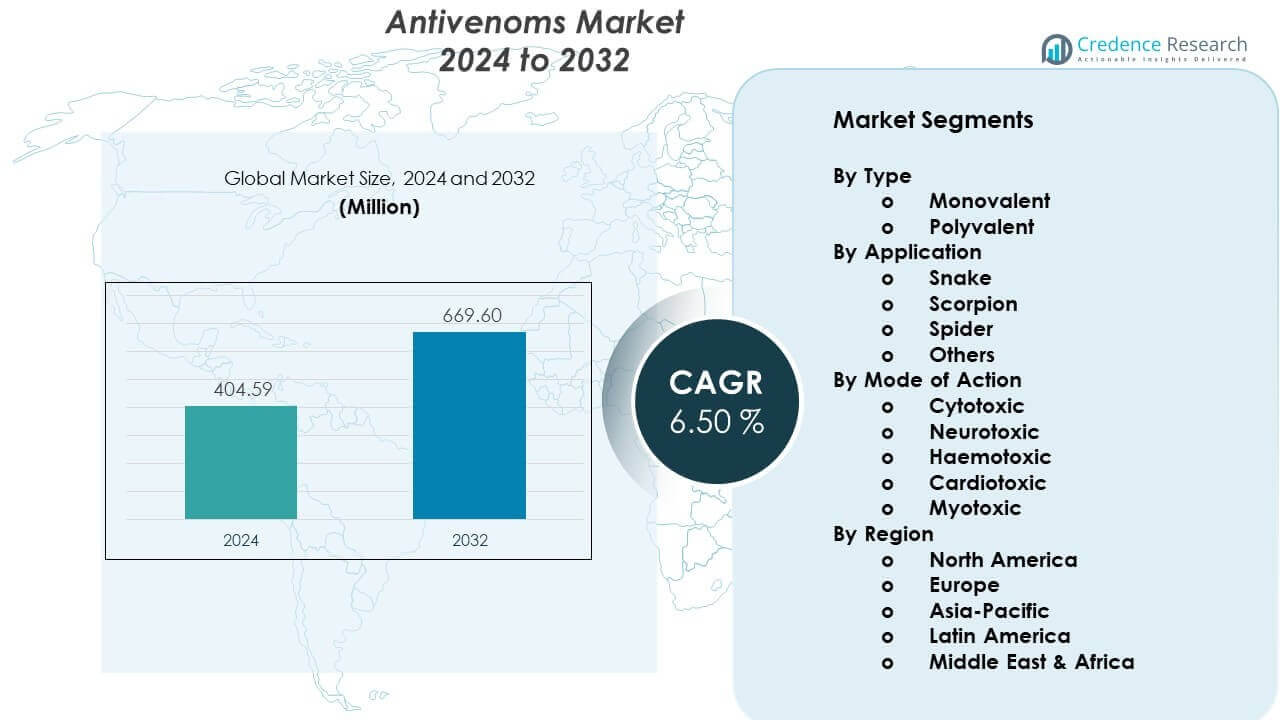
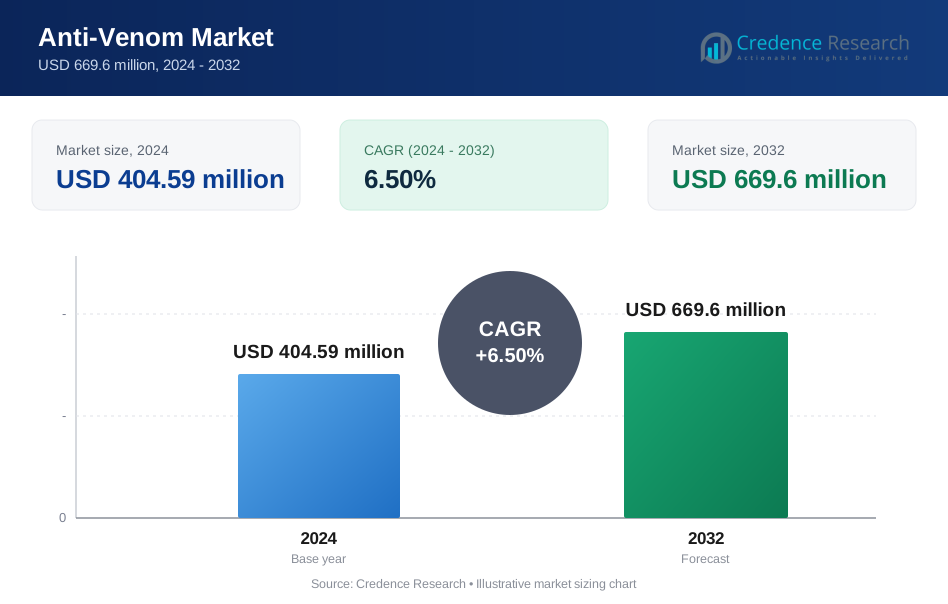
The Antivenoms Market is projected to grow from USD 404.59 million in 2024 to an estimated USD 669.6 million by 2032, with a CAGR of 6.50% from 2024 to 2032.
| REPORT ATTRIBUTE | DETAILS |
|---|---|
| Historical Period | 2020-2023 |
| Base Year | 2024 |
| Forecast Period | 2025-2032 |
| Anti-Venom Market Size 2024 | USD 404.59 million |
| Anti-Venom Market, CAGR | 6.50% |
| Anti-Venom Market Size 2032 | USD 669.6 million |
Strong market drivers center on rising snakebite incidence, especially in Africa, Asia, and Latin America. Healthcare agencies invest in early treatment programs that reduce fatality risks and long-term complications in bite victims. Antivenom producers focus on polyvalent formulations that treat multiple venom types, increasing demand from remote hospitals. Growth strengthens further as clinical teams adopt newer purification processes that cut reaction rates and support safer use in high-risk regions. These innovations raise preference for reliable and faster-acting therapies.
Regional growth is shaped by high exposure levels and expanding healthcare capacity. Africa and South Asia lead due to high snakebite prevalence and stronger public health programs improving treatment access. Latin America shows steady expansion as countries enhance surveillance and clinical infrastructure. North America and Europe maintain demand mainly through travel-related needs and antivenom stockpiling programs. Emerging markets across Southeast Asia expand quickly as governments scale production capabilities and invest in training for emergency response teams.
Anti-Venom Market Insights:
- The Antivenoms Market is projected to grow from USD 404.59 million in 2024 to USD 669.6 million by 2032, reflecting a 6.50% CAGR during the forecast period.
- Asia-Pacific leads with 34%, followed by Europe at 22% and North America at 18%, driven by high exposure levels, stronger preparedness programs, and stable clinical infrastructure.
- Middle East & Africa, holding 12%, is the fastest-growing region due to high snakebite incidence and expanding access programs that improve treatment availability.
- Polyvalent antivenoms dominate with the largest share, supported by broad-spectrum activity and strong preference in regions where species identification is difficult.
- Snakebite applications account for the highest segment share, driven by high incidence across Asia, Africa, and Latin America, and strong demand for reliable emergency treatment.
Anti-Venom Market Drivers:
Rising Clinical Need Due to High Global Incidence of Venomous Bites
Growing exposure to venomous snakes, scorpions, and insects increases the need for rapid antivenom treatment. Healthcare systems in rural and tropical regions report high case volumes that demand consistent supply. Governments push procurement programs to support emergency departments facing rising treatment loads. Non-profit organizations expand funding for underserved zones that lack essential antivenom access. The Antivenoms Market gains strong momentum from rising awareness among frontline healthcare teams. It benefits from national programs that promote earlier case detection and faster patient stabilization. Manufacturers respond by scaling production plants to meet regional needs without major delays. Distribution networks expand toward remote locations to cut time-to-treatment gaps. Clinical training programs improve treatment accuracy and lower mortality rates.
- For instance, the Serum Institute of India produces over 2 million vials of polyvalent antivenom annually to address the estimated 2.7 million envenomings that occur globally each year.
Advances in Purification Technologies That Improve Safety Profiles and Outcomes
New purification methods reduce adverse reactions and support safer patient management. Producers adopt chromatography techniques that yield higher-purity immunoglobulins with stable efficacy. Hospitals prefer these formulations due to lower risks when treating vulnerable patients. The Antivenoms Market receives strong support from innovation that improves functional stability of antivenom products. It benefits from faster reconstitution times that support rapid intervention requirements. Global R&D programs target reduced immunogenicity to help clinicians improve patient outcomes. Enhanced manufacturing techniques shorten production cycles and strengthen supply consistency. Countries with high venom exposure request modern products with low hypersensitivity profiles. Demand rises among health systems that prioritize modern antivenom standards.
Government-Led Public Health Strategies That Strengthen Treatment Accessibility
Public health agencies implement structured supply programs to reduce treatment shortages in high-risk regions. National health ministries support stockpiling and distribution centers for faster response. International partnerships improve supply chain transparency to address regional gaps. The Antivenoms Market grows as public programs increase procurement budgets and clinical readiness. It benefits from outreach campaigns that teach early symptom recognition in communities. Emergency care teams receive upgraded treatment kits to improve first-response outcomes. Policy-driven investments lift local manufacturing capabilities to reduce import dependency. Incentives help suppliers expand production volumes within regulated frameworks. National registries support better surveillance for more targeted response planning.
- For instance, the Australian government partnered with CSL Seqirus to ensure a guaranteed national stockpile, enabling the distribution of antivenom to over 750 hospital locations across the continent to maintain a zero-shortage mandate.
Expansion of Veterinary Use Linked to Rising Incidents in Livestock and Companion Animals
Veterinary hospitals report increased demand due to growing cases in farm and domestic animals. Livestock producers seek reliable antivenom supplies to protect herds in high-risk zones. Veterinary health programs expand awareness of venom exposure in agricultural regions. The Antivenoms Market gains demand from stronger integration of animal care protocols. It benefits from rising adoption of polyvalent formulations that support broad clinical use. Producers invest in species-specific research to support precision therapies in veterinary medicine. Animal welfare laws support structured treatment pathways for venom-related emergencies. Distribution networks expand into rural zones where veterinary care demand remains high. Training programs help veterinary teams improve safety and recovery outcomes.
Anti-Venom Market Trends:
Growing Use of Polyvalent Formulations That Support Broader Clinical Coverage
Healthcare providers favor polyvalent antivenoms that neutralize multiple venom types from diverse species. Treatment protocols shift toward broader-coverage options that improve emergency response. Clinicians prefer these formulations for unpredictable bite scenarios in remote locations. The Antivenoms Market aligns with this shift due to rising adoption across hospitals. It benefits from reduced need for species-specific identification before treatment. Manufacturers expand portfolios to include stable and high-potency polyvalent lines. Regional health agencies support procurement of versatile products to simplify logistics. Research programs focus on enhancing neutralization strength across wider toxin groups. Adoption grows across Asia, Africa, and Latin America.
- For instance, the Serum Institute of India manufactures a polyvalent antivenom that neutralizes the toxins of the "Big Four" venomous snakes, maintaining a potency of 0.45 mg to 0.60 mg of venom neutralized per ml of antivenom across all four species.
Increasing Focus on Heat-Stable and Longer-Shelf-Life Products for Remote Deployment
Demand grows for formulations that withstand difficult storage conditions without quality loss. Remote regions require stable products that handle long transport timelines. Manufacturers innovate stabilizing processes that improve field usability. The Antivenoms Market reflects rising interest in extended-shelf-life solutions. It gains support from emergency teams that require dependable storage without complex cold chains. Countries seeking rural deployment prioritize rugged formulations for consistent performance. Research projects target thermal resilience to support climate-sensitive regions. Procurement agencies request products that reduce wastage and supply breaks. Market momentum builds around innovations that reduce environmental sensitivity.
- For instance, Instituto Clodomiro Picado has developed lyophilized (freeze-dried) polyvalent antivenoms that remain stable at temperatures up to 40°C, extending the product shelf life to 36 months without the requirement for refrigeration.
Integration of Digital Tracking in Supply Chains for Better Accessibility and Planning
Governments adopt digital systems to track inventories and predict stock shortages. Hospitals use these tools to ensure uninterrupted treatment availability. Suppliers gain visibility into regional demand and adjust shipments in real time. The Antivenoms Market benefits from stronger coordination between manufacturers and health ministries. It gains efficiency when digital tools support accurate planning and emergency forecasting. Technology platforms help reduce expired stock through optimized rotation cycles. Remote clinics join digital networks to flag urgent replenishment needs. Data-driven planning strengthens national readiness against venom incidents. Adoption rises across markets with structured public health systems.
Rising Global Collaboration for R&D Standardization and Clinical Improvement
Research centers share knowledge to improve potency, safety, and venom-specific response protocols. Cross-country collaborations support harmonized clinical trials for new antivenom lines. Academic groups map venom composition more precisely to guide product design. The Antivenoms Market benefits from these collective advancements in global research. It gains structured pathways that reduce development barriers and speed innovation cycles. Regulatory agencies align requirements to streamline approvals for essential antivenoms. Shared databases support better understanding of venom variations across geographies. International health bodies promote coordinated practices for treatment refinement. These efforts strengthen confidence in next-generation antivenoms.
Anti-Venom Market Challenges Analysis:
Persistent Supply Shortages and High Production Constraints Across Regions
Many regions face recurring shortages due to complex manufacturing processes and limited supplier capacity. Production cycles require specialized facilities that few countries maintain. High costs create pressure on procurement budgets in low-income regions. The Antivenoms Market faces operational constraints when demand surges exceed supply availability. It must navigate regulatory barriers that slow import approvals during emergency periods. Manufacturers struggle to scale quickly due to long development timelines and strict quality controls. Health systems often depend on outdated procurement strategies that weaken supply efficiency. Remote zones experience transport delays that reduce treatment success rates. These issues limit consistent access for patients in critical need.
Limited Awareness, Training, and Diagnostic Readiness in High-Risk Regions
Frontline clinicians in rural settings may lack training in updated venom treatment protocols. Many patients delay care due to limited awareness of early bite symptoms. Emergency departments may operate without standardized dosing guidelines. The Antivenoms Market faces reduced treatment penetration where diagnostic capacity remains weak. It depends on coordinated training programs to improve accuracy and response timing. Community outreach remains inconsistent in several high-burden countries. Poor diagnostic tools raise the risk of misclassification during emergencies. Public health education efforts remain underfunded in many regions. These constraints slow progress toward better patient outcomes.
Market Opportunities:
Expansion of Local Manufacturing Capacity in Venom-High Regions Through Incentive Programs
Governments explore partnerships that support regional production of antivenoms. Local production shortens supply lines and improves emergency readiness. The Antivenoms Market gains traction where nations pursue self-reliance strategies. It benefits from targeted investment in bioprocessing and fill-finish plants. Incentives encourage suppliers to scale modern purification technologies. Universities join research projects that deepen understanding of venom diversity. Fast-track regulatory routes help innovative manufacturers enter underserved zones. Long-term procurement contracts support production stability. These programs open strong growth prospects for regional producers.
Growth Potential in Next-Generation Synthetic and Recombinant Antivenom Platforms
Research pivots toward recombinant antibodies with stronger precision and reduced reaction risks. These platforms provide scalable production with more predictable output. The Antivenoms Market benefits from rising interest in engineered therapeutic formats. It gains momentum as safety and potency improvements attract global funding. Biotech companies expand innovation pipelines in toxin-neutralizing antibody design. Academic breakthroughs accelerate preclinical testing and candidate refinement. Governments explore emerging technologies that reduce reliance on animal-based production. These advances unlock new commercial pathways and future product lines. Market prospects strengthen with continued scientific progress.
Market Segmentation Analysis:
By Type
The Antivenoms Market divides products into monovalent and polyvalent formulations. Monovalent antivenoms target a single species and support high specificity during treatment. These products serve regions where venom profiles are well-defined and surveillance is strong. Polyvalent antivenoms hold a larger share due to broader protection across multiple venom types. Healthcare providers in remote areas prefer polyvalent options for unpredictable exposure scenarios. It benefits from rising investment in advanced purification that improves safety profiles. Demand for polyvalent formats increases where rapid identification of species remains difficult. Procurement programs support wider adoption across public hospitals and emergency networks.
- For instance, Biological E. Limited manufactures a polyvalent antivenom that achieves a potency of 0.60 mg neutralization for Naja naja venom and 0.45 mg for Vipera russelli venom per ml, providing critical broad-spectrum coverage for the Indian subcontinent.
By Application
Snakebite treatment dominates due to high global incidence across Asia, Africa, and Latin America. Clinical teams rely on broad-spectrum formulations to manage varied snake species. Scorpion antivenoms expand steadily in regions with rising stings linked to climate and habitat shifts. Spider antivenoms serve a smaller but essential niche in countries with severe envenomation patterns. The Antivenoms Market gains additional demand from products categorized under others, which cover insect and marine exposures. It supports emergency departments facing diverse venom events that require immediate response. Growth across this segment aligns with increased training and diagnostics in high-risk areas.
- For instance, Laboratorios Silanes produces Anascorp, a scorpion antivenom that has demonstrated the ability to reduce the time for resolution of clinical symptoms from 4.0 hours to 1.2 hours in pediatric patients following a severe sting.
By Mode of Action
Cytotoxic antivenoms treat bites that cause local tissue destruction and require early dosing. Neurotoxic antivenoms remain vital in regions with elapid species that impair respiratory function. Haemotoxic products address venom that triggers clotting dysfunction and internal bleeding. Cardiotoxic formulations support care where venom impacts cardiac rhythms or muscle strength. Myotoxic antivenoms serve cases linked to severe muscle breakdown. These categories strengthen clinical decision-making and guide emergency protocols across varied geographies.
Segmentation:
By Type
- Monovalent
- Polyvalent
By Application
- Snake
- Scorpion
- Spider
- Others
By Mode of Action
- Cytotoxic
- Neurotoxic
- Haemotoxic
- Cardiotoxic
- Myotoxic
By Region
- North America
- U.S.
- Canada
- Mexico
- Europe
- Germany
- France
- U.K.
- Italy
- Spain
- Rest of Europe
- Asia Pacific
- China
- Japan
- India
- South Korea
- South-east Asia
- Rest of Asia Pacific
- Latin America
- Brazil
- Argentina
- Rest of Latin America
- Middle East & Africa
- GCC Countries
- South Africa
- Rest of the Middle East and Africa
Regional Analysis:
North America and Europe
The Antivenoms Market records steady demand in North America, holding around 18% of global share. Hospitals maintain structured stockpiles to manage rare but critical venom exposures linked to snakes, spiders, and imported species. Strong regulatory oversight supports consistent product quality and reliable emergency response systems. It benefits from advanced manufacturing capabilities and strong clinical training programs. Europe accounts for roughly 22% of global share and focuses on preparedness, especially for southern regions with higher venom incidents. Cross-border research programs strengthen antivenom innovation pipelines. Public health agencies in both regions maintain stable procurement budgets to support treatment readiness.
Asia-Pacific
Asia-Pacific leads the Antivenoms Market with an estimated 34% share due to high exposure across India, Southeast Asia, and Australia. Dense rural populations and agricultural activity increase snakebite risk, creating strong demand for polyvalent formulations. Governments invest in expanded distribution networks to reduce treatment delays in remote zones. It gains momentum from local manufacturing growth and national health programs aimed at lowering mortality. Research centers across India and Australia contribute to improved venom profiling and product development. Regional health systems prioritize clinician training to improve dosing accuracy and patient outcomes. Rising awareness campaigns improve early case referrals to emergency care.
Latin America and Middle East & Africa
Latin America holds about 14% of global share, supported by strong clinical need in countries with diverse venomous species. National institutes produce specialized antivenoms that address region-specific toxin profiles. It grows steadily as governments strengthen surveillance and rural access programs. The Middle East & Africa region represents nearly 12% of global share, driven by very high snakebite incidence in sub-Saharan Africa. Limited access to timely treatment creates ongoing demand for scalable and rugged antivenom products. International aid programs play a key role in bridging supply gaps for underserved zones. Regional investment in better distribution logistics improves treatment availability and supports long-term market development.
Key Player Analysis:
- Bharat Serums and Vaccines Ltd.
- CSL Limited
- Pfizer Inc.
- VINS Bioproducts Ltd.
- Merck KGaA
- Instituto Bioclon
- Rare Disease Therapeutics Inc.
- Incepta Pharmaceuticals Ltd.
- Haffkine Bio-Pharmaceutical Corp.
- MicroPharm Ltd.
Competitive Analysis:
The Antivenoms Market features strong competition among global and regional producers that focus on efficiency, product purity, and reliable distribution. Leading companies expand portfolios to offer monovalent and polyvalent formats that meet varied clinical needs. It gains support from firms investing in high-purity immunoglobulin technologies and safer manufacturing processes. Partnerships with public health agencies strengthen supply chains in high-incidence zones. Market players differentiate through expanded research programs, improved toxin profiling, and wider geographic reach. Companies also compete through long-term procurement contracts that ensure stable demand. Growing focus on quality control and reduced reaction rates shapes competitive positioning.
Recent Developments:
- In December 2025, CSL Seqirus officially opened a state-of-the-art $1 billion manufacturing facility in Melbourne, Australia, which is dedicated to the production of cell-based influenza vaccines and antivenoms. This world-class site enhances Australia's onshore capabilities, making it one of the few countries globally with end-to-end capability for these critical biological products.
- In December 2025, Vins Bioproducts became a lead investor in a ₹150-crore funding round for PlasmaGen Biosciences, a Bengaluru-based biopharmaceutical firm specialising in plasma proteins. Vins invested ₹80 crore to strengthen its portfolio and intends to market PlasmaGen's products in African and European markets. Earlier, in September 2024, the company announced plans to launch region-specific antivenoms to better address local venom variations globally.
Report Coverage:
The research report offers an in-depth analysis based on Type, Application, Mode of Action, and Region. It details leading market players, providing an overview of their business, product offerings, investments, revenue streams, and key applications. Additionally, the report includes insights into the competitive environment, SWOT analysis, current market trends, as well as the primary drivers and constraints. Furthermore, it discusses various factors that have driven market expansion in recent years. The report also explores market dynamics, regulatory scenarios, and technological advancements that are shaping the industry. It assesses the impact of external factors and global economic changes on market growth. Lastly, it provides strategic recommendations for new entrants and established companies to navigate the complexities of the market.
Future Outlook:
- Advancements in high-purity antivenom formulations will improve patient safety and strengthen treatment adoption across hospitals and emergency units worldwide.
- Local production capabilities will expand in regions with high envenomation rates, supporting stable supply chains and reducing dependence on imported antivenoms.
- Broader integration of digital inventory systems will enhance availability tracking and help health systems manage stock levels more efficiently during peak exposure seasons.
- Growth in recombinant and synthetic antivenom technologies will create new innovation paths and support development of next-generation therapeutic platforms.
- Stronger government funding initiatives will improve procurement programs, ensure reliable distribution, and support clinical training in high-risk regions.
- Rising demand for polyvalent antivenoms will shape product portfolios as healthcare providers seek broader coverage for unpredictable venom encounters.
- Improved diagnostic tools will support faster clinical decisions, reduce treatment delays, and improve survival rates during emergency presentations.
- Cross-border research collaborations will refine venom mapping, support drug discovery, and strengthen regional preparedness frameworks.
- Veterinary applications will expand as incidents increase among livestock and companion animals, encouraging targeted formulations for animal healthcare.
- Public health awareness campaigns will guide early patient response, increase treatment-seeking behavior, and support long-term reduction in mortality across underserved regions.
Request a Free Sample
Fill in your details and we'll send you a free sample report.
- Sample data tables & charts
- Research methodology
Need a Custom Version of This Report?
Tailor the scope, geography, or segments to your exact requirements.
- Custom geography or segment scope
- Direct access to our analyst team
Frequently Asked Questions
What is the current market size for the Antivenoms Market, and what is its projected size in 2032?
At what Compound Annual Growth Rate is the Antivenoms Market projected to grow between 2025 and 2032?
Which Antivenoms Market segment held the largest share in 2024?
What are the primary factors fueling the growth of the Antivenoms Market?
Who are the leading companies in the Antivenoms Market?
Which region commanded the largest share of the Antivenoms Market in 2024?
Table of Content
Chapter 1. Report Introduction
- 1.1 Report Description & Purpose
- 1.1.1 Report Title & Market Definition
- 1.1.2 Unique Selling Propositions (USP) & Key Differentiators
- 1.1.3 Value Proposition for Stakeholders
- 1.2 Research Objectives
- 1.2.1 Market Sizing Objectives (Volume & Revenue)
- 1.2.2 Segmentation Objectives
- 1.2.3 Competitive Intelligence Objectives
- 1.2.4 Forecast & Scenario Objectives
- 1.3 Report Scope
- 1.3.1 Anti-Venom Scope – Types & Subtypes Covered
- 1.3.2 Geographic Scope – Regions & Countries Covered
- 1.3.3 Historical Period, Base Year & Forecast Period (2024; forecast to 2032)
- 1.3.4 Inclusions & Exclusions
- 1.4 HS Code & Classification Framework
- 1.5 Currency, Units & Pricing Basis
- 1.6 Target Stakeholders
- 1.7 Limitations & Assumptions
Chapter 2. Executive Summary
- 2.1 Global Anti-Venom Market Snapshot
- 2.1.1 Market Size – Historical (2024) & Forecast (2024-2032) (2024: USD 404.59 million → 2032: USD 669.6 million)
- 2.1.2 Volume & Revenue – Global Totals
- 2.1.3 Key Market Highlights – Top Five Facts
- 2.2 Anti-Venom Market Segmentation Snapshot
- 2.2.1 Market Split by Region – 2024 vs. 2032
- 2.3 Competitive Snapshot
- 2.3.1 Top 10 Players by Revenue Share – 2024
- 2.3.2 Top 10 Players by Volume Share – 2024
- 2.3.3 Recent Strategic Developments (18-Month Summary)
- 2.4 Key Investment Highlights & Strategic Conclusions
Chapter 3. Anti-Venom Market Dynamics & Industry Analysis
- 3.1 Market Overview & Context
- 3.1.1 Anti-Venom Market Position in the Broader Automotive Value Chain
- 3.1.2 OEM vs. Replacement Market Dynamics
- 3.1.3 Market Maturity & Development Stage by Region
- 3.2 Anti-Venom Market Drivers
- 3.3 Anti-Venom Market Restraints & Challenges
- 3.4 Anti-Venom Market Opportunities
- 3.5 Porter's Five Forces Analysis
- 3.5.1 Threat of New Entrants
- 3.5.2 Bargaining Power of Suppliers
- 3.5.3 Bargaining Power of Buyers
- 3.5.4 Threat of Substitutes
- 3.5.5 Competitive Rivalry – Intensity Assessment
- 3.6 Anti-Venom Value Chain Analysis
- 3.6.1 Upstream – Raw Material/Input Suppliers
- 3.6.1.1 Raw Material/Input 1
- 3.6.1.2 Raw Material/Input 2
- 3.6.1.3 Raw Material/Input 3
- 3.6.2 Midstream – Production/Manufacturing/Service Delivery
- 3.6.2.1 Production/Process Overview
- 3.6.2.2 Key Facility Locations & Capacity by Manufacturer
- 3.6.3 Downstream – Distribution & End Consumer
- 3.6.3.1 Primary Channel – B2B/OEM
- 3.6.3.2 Secondary Channels – Dealer, Retail, Online, Direct
- 3.6.4 Value Chain Profitability Analysis
- 3.6.1 Upstream – Raw Material/Input Suppliers
- 3.7 PESTEL Analysis
- 3.7.1 Political Factors
- 3.7.2 Economic Factors
- 3.7.3 Social Factors
- 3.7.4 Technological Factors
- 3.7.5 Environmental Factors
- 3.7.6 Legal Factors
- 3.8 Anti-Venom Supply Chain Analysis
- 3.8.1 Raw Material/Input Supply Risk Assessment
- 3.8.2 Manufacturing Concentration Risk (Geographic Exposure)
- 3.8.3 Trade Disruption Impact Analysis
- 3.9 Regulatory & Policy Landscape
Note: The regulatory and policy landscape section covers regulations based on their applicability to the market, Anti-Venom category, geography, and scope of the study. Only regulatory frameworks with a material impact on operations, compliance, trade, sustainability, or market access are analyzed in detail.
Chapter 4. Key Investment Pockets & Opportunity Analysis
- 4.1 Anti-Venom Market Attractiveness Analysis
- 4.1.1 By Region – Investment Attractiveness Matrix (Volume × CAGR)
- 4.2 Absolute Revenue Growth Opportunity
- 4.2.1 By Region – Absolute USD Growth Through 2032
- 4.3 Incremental Volume Opportunity
- 4.3.1 By Region – Incremental Volume Through 2032
- 4.3.2 Segment – Incremental Volume
- 4.4 Emerging Submarket Opportunity Deep Dive (Subject to Applicability)
- 4.5 Emerging Market Opportunity Scorecards
- 4.5.1 United States
- 4.5.2 Europe
- 4.5.3 Asia
- 4.5.4 Middle East & Africa
Note: Emerging Market Opportunity Scorecards will be included based on relevance and strategic importance. Regions listed are indicative and may vary depending on data availability and market dynamics.
Chapter 5. Anti-Venom Import-Export Analysis & Trade Flows
- 5.1 Global Trade Overview
- 5.1.1 Global Export Value by Country (2024)
- 5.1.2 Global Export Volume by Country (2024)
- 5.1.3 Global Import Value by Country (2024)
- 5.1.4 Global Import Volume by Country (2024)
- 5.1.5 Net Trade Balance by Country (2024)
- 5.2 Export Analysis – Segment
- 5.2.1 Type 1 (HS Code)
- 5.2.2 Type 2 (HS Code)
- 5.2.3 Type 3 (HS Code)
- 5.2.4 Type 4 (HS Code)
- 5.2.5 Type 5 (HS Code)
- 5.3 Import Analysis – Segment
- 5.3.1 Type 1 (HS Code)
- 5.3.2 Type 2 (HS Code)
- 5.3.3 Type 3 (HS Code)
- 5.3.4 Type 4 (HS Code)
- 5.3.5 Type 5 (HS Code)
- 5.4 Average Unit Trade Prices
- 5.4.1 Average Export Price – Segment & Country
- 5.4.2 Average Import Price – Segment & Source Country
- 5.4.3 Price Trends (2024)
- 5.5 Key Trade Route Analysis
- 5.5.1 Trade Route 1
- 5.5.2 Trade Route 2
- 5.5.3 Trade Route 3
- 5.5.4 Trade Route 4
- 5.5.5 Trade Route 5
- 5.6 Trade Policy Impact Assessment
- 5.6.1 US Anti-Dumping & Section 301 Tariffs
- 5.6.2 EU Customs Union Impact
- 5.6.3 Major Free Trade Agreements
- 5.6.4 USMCA Rules of Origin
Note: Trade policy analysis will be included only where relevant to the Anti-Venom market.
Chapter 6. Competitive Landscape & Company Benchmarking
- 6.1 Anti-Venom Market Concentration & Structure
- 6.1.1 Herfindahl-Hirschman Index (HHI) – vs. 2024
- 6.1.2 Tier 1, Tier 2 & Tier 3 Market Structure
- 6.1.3 Global, Regional & Local Player Dynamics
- 6.2 Anti-Venom Market Share Analysis – 2024
- 6.2.1 Global Revenue Share by Company
- 6.2.2 Global Volume Share by Company
- 6.2.3 Regional Revenue Share
- 6.2.4 Market Share Evolution ( vs. 2024)
- 6.2.5 OEM Segment Share by Company
- 6.2.6 Replacement Segment Share by Company
- 6.3 Production/Delivery Capacity & Facility Analysis
- 6.3.1 Global Installed Capacity
- 6.3.2 Capacity Utilization Rates
- 6.3.3 Production/Output Volume
- 6.3.4 Facility Locations & Capacity Map
- 6.3.5 Planned Capacity Additions
- 6.4 Anti-Venom Competitive Benchmarking Matrix
- 6.4.1 Revenue, Volume, CAGR & Profitability Comparison
- 6.4.2 Channel Revenue Mix
- 6.4.3 Geographic Revenue Exposure
- 6.4.4 R&D Intensity
- 6.4.5 Sustainability Maturity
- 6.5 Strategic Developments in Anti-Venom (Last 24 Months)
- 6.5.1 Mergers, Acquisitions & Divestments
- 6.5.2 New Anti-Venom Launches
- 6.5.3 Facility Expansions
- 6.5.4 Strategic Alliances, Joint Ventures & Partnerships
- 6.5.5 Distribution Expansion & Market Entry
- 6.5.6 Sustainability & ESG Initiatives
- 6.6 Competitive Strategy Mapping
- 6.6.1 Leader, Challenger, Follower & Niche Classification
- 6.6.2 Pricing Strategy Comparison
- 6.6.3 Channel Strategy Matrix
Note: Strategic developments are included based on their materiality and the availability of reliable information.
Chapter 7. Global Anti-Venom Market – By Distribution Channel
- 7.1 Segment Overview
- 7.1.1 Volume & Revenue Split by Channel (2024 & 2032)
- 7.1.2 Channel Mix Evolution (2024-2032)
Chapter 8. Regional Market Analysis – Global Overview
- 8.1 Global Regional Overview
- 8.1.1 Regional Volume Share
- 8.1.2 Regional Revenue Share
- 8.1.3 Regional Volume by Region
- 8.1.4 Regional Revenue by Region
- 8.1.5 Regional Forecast Through 2032
- 8.2 Cross-Regional Segment Analysis
- 8.2.1 By Distribution Channel
- 8.2.2 By Brand/Price Tier
Chapter 9. North America Anti-Venom Market
- 9.1 United States
- 9.2 Canada
- 9.3 Mexico
Chapter 10. Europe Anti-Venom Market
- 10.1 Germany
- 10.2 France
- 10.3 Italy
- 10.4 United Kingdom
- 10.5 Spain
- 10.6 Poland
- 10.7 Russia
- 10.8 Netherlands
- 10.9 Belgium
- 10.10 Sweden
- 10.11 Denmark
- 10.12 Norway
- 10.13 Rest of Europe
Chapter 11. Asia Pacific Anti-Venom Market
- 11.1 China
- 11.2 India
- 11.3 Japan
- 11.4 South Korea
- 11.5 Thailand
- 11.6 Indonesia
- 11.7 Vietnam
- 11.8 Malaysia
- 11.9 Australia
- 11.10 Rest of Asia Pacific
Chapter 12. Latin America Anti-Venom Market
- 12.1 Brazil
- 12.2 Argentina
- 12.3 Colombia
- 12.4 Chile
- 12.5 Rest of Latin America
Chapter 13. Middle East Anti-Venom Market
- 13.1 Saudi Arabia
- 13.2 United Arab Emirates
- 13.3 Turkey
- 13.4 Israel
- 13.5 Iran
- 13.6 Rest of the Middle East
Chapter 14. Africa Anti-Venom Market
- 14.1 South Africa
- 14.2 Egypt
- 14.3 Nigeria
- 14.4 Morocco
- 14.5 Rest of Africa
Chapter 15. Anti-Venom Company Profiles
- 15.1 [Company 01]
- 15.1.1 Company Overview
- 15.1.2 Key Management Personnel
- 15.1.3 Products & Services Portfolio
- 15.1.4 Financial Performance
- 15.1.5 Key Market Focus & Geographic Presence
- 15.1.6 Recent Developments & Strategic Initiatives
Note: The company profile list is preliminary and may change based on research findings, market developments, data availability, and client requirements.
Chapter 16. Appendices
- Appendix A – List of Abbreviations & Acronyms
- Appendix B – Industry Classification Code Reference – Full Series
- Appendix C – Production & Capacity Data Tables
- Appendix D – End-Use & Demand Base Tables
- Appendix E – Consumption & Replacement Rate Assumptions
- Appendix F – ASP Reference Tables
- Appendix G – Manufacturing & Facility Database
- Appendix H – Import-Export Data Tables
- Appendix I – Regulatory Summary Tables
- Appendix J – Primary Research Participant List (Anonymized)
- Appendix K – Primary Research Questionnaire Framework
- Appendix L – Data Sources & Bibliography
- Appendix M – Market Size Divergence & Source Comparison
Chapter 17. Research Methodology
- 17.1 Research Framework & Philosophy
- 17.2 Secondary Research – Sources, Hierarchy & Data Extraction
- 17.3 Data Modeling – Bottom-Up & Top-Down Market Sizing
- 17.4 Primary Research – Stakeholder Framework, LOI & Sample Sizes
- 17.5 Forecast Methodology – Regression, Scenario & Sensitivity Analysis
- 17.6 Quality Control – Four-Layer Validation Framework
- 17.7 Limitations & Standard Assumptions
- 17.8 Disclaimer
