
Market Overview
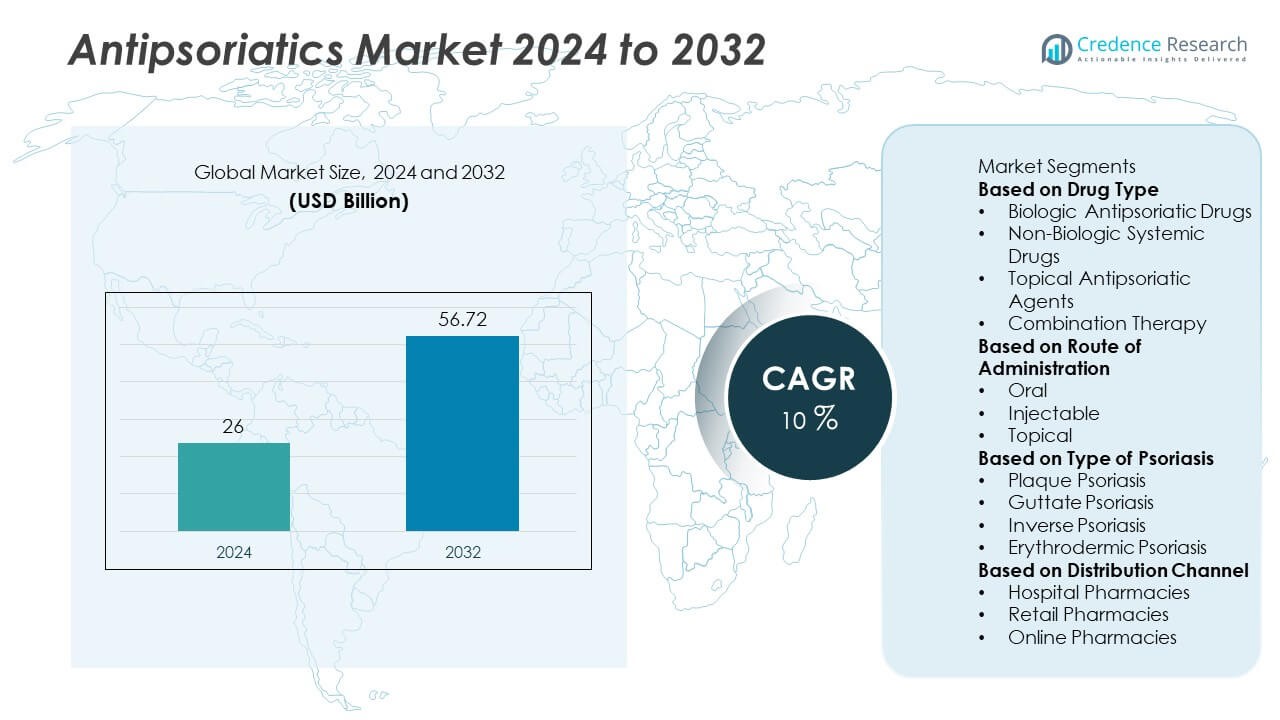
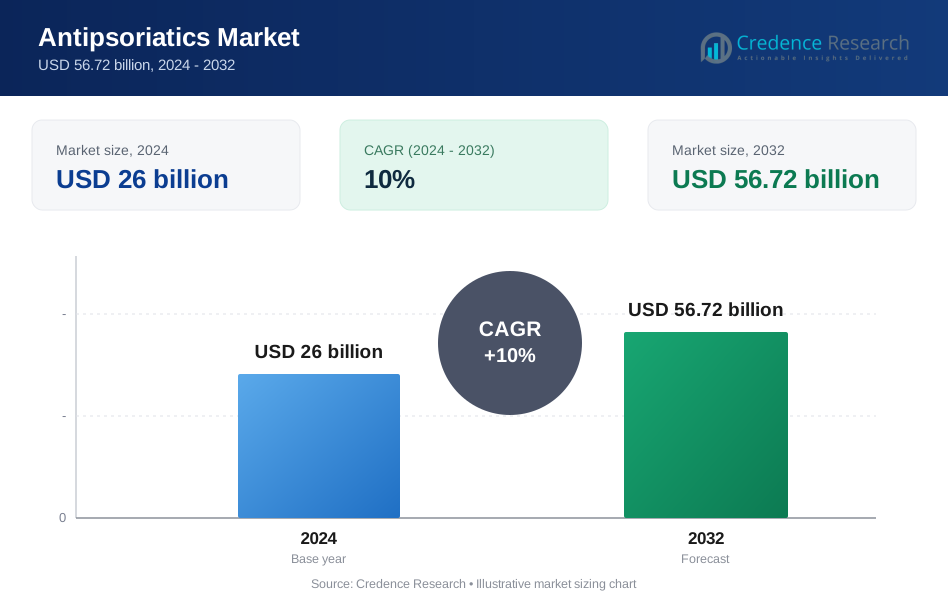
The Antipsoriatics Market was valued at USD 26 billion in 2024 and is projected to reach USD 56.72 billion by 2032, growing at a CAGR of 10% during the forecast period.
| REPORT ATTRIBUTE | DETAILS |
|---|---|
| Historical Period | 2020-2023 |
| Base Year | 2024 |
| Forecast Period | 2025-2032 |
| Antipsoriatics Market Size 2024 | USD 26 Billion |
| Antipsoriatics Market, CAGR | 10% |
| Antipsoriatics Market Size 2032 | USD 56.72 Billion |
The antipsoriatics market is dominated by major players including Novartis AG, AbbVie Inc., Amgen Inc., Johnson & Johnson Services, Inc., Pfizer Inc., Eli Lilly and Company, Bristol-Myers Squibb Company, UCB S.A., Sun Pharmaceutical Industries Ltd., and Leo Pharma A/S. These companies lead through extensive product portfolios in biologics, topical agents, and systemic therapies targeting psoriasis. North America holds the largest share at 38.5% in 2024, supported by advanced healthcare systems and high adoption of biologic drugs. Europe follows with a 31.2% share, driven by strong R&D investments, while Asia-Pacific accounts for 22.7%, emerging rapidly due to expanding healthcare access and growing awareness of chronic skin diseases.
Market Insights
- The antipsoriatics market was valued at USD 26 billion in 2024 and is projected to reach USD 56.72 billion by 2032, growing at a CAGR of 10% during the forecast period.
- Rising psoriasis prevalence and increasing adoption of biologic and biosimilar therapies are driving market growth, with biologic drugs leading the market at a 56.8% share due to their superior efficacy.
- Key trends include the growing shift toward personalized medicine, expansion of biosimilar portfolios, and increased R&D investments in immunomodulators and targeted small-molecule drugs.
- Major players such as Novartis, AbbVie, Johnson & Johnson, and Amgen dominate through strong biologic pipelines, strategic partnerships, and global distribution networks.
- North America leads with a 38.5% share, followed by Europe at 31.2%, while Asia-Pacific holds 22.7% and is expected to grow fastest, driven by rising awareness, healthcare investment, and improved access to dermatological care.
Market Segmentation Analysis:
By Drug Type
The biologic antipsoriatic drugs segment dominates the market, holding a 56.8% share in 2024, driven by their high efficacy and targeted action in moderate to severe psoriasis. Biologics such as TNF inhibitors, IL-17 inhibitors, and IL-23 inhibitors are transforming treatment outcomes by offering long-term disease control with fewer side effects. Growing physician preference for biologics and increasing availability of biosimilars are further boosting adoption. Non-biologic systemic drugs and topical agents continue to serve as effective first-line options for mild cases, while combination therapies gain traction for enhanced clinical effectiveness and patient adherence.
- For instance, AbbVie’s Humira (adalimumab) generated over $21 billion in annual sales globally before extensive US biosimilar entry, while Novartis’ Cosentyx (secukinumab) treated more than 1 million patients worldwide across multiple indications (including psoriasis) through 2023, supported by continuous data on sustained PASI 90 response rates.
By Route of Administration
The injectable segment leads the antipsoriatics market with a 49.2% share in 2024, owing to the dominance of biologic drugs administered via subcutaneous or intravenous routes. This segment benefits from improved patient outcomes and sustained remission rates associated with targeted injectable treatments. Pharmaceutical innovation has led to extended dosing intervals, improving patient compliance. The oral route remains significant due to the availability of small-molecule inhibitors, while topical administration retains importance in mild psoriasis cases where localized therapy is sufficient, supported by widespread over-the-counter and prescription-based usage.
- For instance, Johnson & Johnson’s Stelara (ustekinumab) achieved dosing intervals of every 12 weeks and recorded over 1.9 million patient-years of use globally, while Amgen’s Enbrel (etanercept) surpassed 20 million patient-years of global exposure, demonstrating long-term safety and efficacy in plaque psoriasis management.
By Type of Psoriasis
The plaque psoriasis segment dominates the market, accounting for a 61.3% share in 2024, as it represents the most prevalent form of the disease globally. Its chronic and recurring nature drives strong demand for long-term treatment solutions, particularly biologics and topical corticosteroids. Increased awareness of disease severity and expanding diagnostic capabilities contribute to higher treatment rates. Guttate and inverse psoriasis segments are witnessing rising therapeutic attention, while erythrodermic psoriasis remains a smaller segment due to lower prevalence but requires intensive management using systemic and biologic therapies for effective disease control.
Key Growth Drivers
Rising Prevalence of Psoriasis and Related Comorbidities
The growing global prevalence of psoriasis, affecting millions of adults and children, is a major market driver. Increasing cases of moderate to severe psoriasis linked with lifestyle changes, stress, and autoimmune disorders continue to expand treatment demand. Psoriasis is also associated with comorbidities such as arthritis, cardiovascular diseases, and diabetes, which intensify the need for comprehensive treatment approaches. As awareness of disease management and diagnosis improves, healthcare systems are prioritizing early and effective intervention, fueling consistent growth in antipsoriatic drug adoption worldwide.
- For instance, the World Health Organization reports that more than 125 million people globally are affected by psoriasis, while studies indicate that approximately 30% of psoriasis patients develop psoriatic arthritis.
Increasing Adoption of Biologic Therapies
The rapid shift from conventional therapies to biologics is transforming psoriasis treatment. Biologics, including TNF-alpha, IL-17, and IL-23 inhibitors, provide superior efficacy and longer remission periods compared to traditional drugs. The rising number of clinical approvals and improved accessibility to biosimilars enhance market penetration. Patients and healthcare professionals increasingly favor biologics for their targeted mechanisms and safety profiles. Expanding reimbursement coverage and continuous pharmaceutical investment in advanced biologic formulations further accelerate market growth in developed and emerging economies.
- For instance, Eli Lilly’s Taltz (ixekizumab) demonstrated PASI 90 skin clearance in over 70% of trial participants, while Amgen’s Otezla (apremilast) has been prescribed to more than 1 million patients worldwide, underscoring the large-scale shift toward biologic and targeted therapies in clinical practice.
Technological and Research Advancements in Drug Development
Pharmaceutical innovation plays a key role in advancing the antipsoriatics market. The development of novel small-molecule inhibitors, next-generation biologics, and personalized therapies has enhanced treatment precision and safety. Advancements in immunopathology research are enabling better understanding of psoriasis at the molecular level, driving innovation in targeted drug design. Additionally, improvements in formulation technology—such as extended-release and combination therapies—are optimizing dosing convenience and efficacy. Growing investments in R&D and clinical trials continue to introduce new therapeutic options, expanding patient accessibility to modern psoriasis treatments.
Key Trends & Opportunities
Growing Demand for Biosimilars and Cost-Effective Therapies
The expiration of patents for major biologics has opened new opportunities for biosimilar development, offering comparable efficacy at lower costs. Biosimilars are driving affordability and expanding access to advanced psoriasis treatment in cost-sensitive markets. Pharmaceutical companies are focusing on biosimilar portfolios to strengthen market presence and compete in high-demand segments. Governments and healthcare providers are promoting biosimilar adoption through favorable regulatory frameworks, which will enhance market competitiveness and ensure long-term sustainability of biologic-based therapies globally.
- For instance, Samsung Bioepis and Biogen’s Imraldi, a biosimilar to Humira, is part of a portfolio that, combined with Benepali and Flixabi, has helped nearly 253,000 patients across Europe. Amgen’s Amjevita, the first FDA-approved adalimumab biosimilar, has been prescribed to more than 300,000 patients in over 60 countries, accumulating four years of real-world experience outside the United States.
Expansion of Personalized and Precision Medicine Approaches
Personalized medicine is emerging as a key trend in psoriasis care, focusing on patient-specific responses and genetic profiles. Biomarker-based drug selection and precision dosing are improving treatment success rates and reducing adverse effects. Pharmaceutical firms are investing in companion diagnostics and genomic research to develop individualized therapies. This trend is expected to redefine clinical practice by providing tailored treatment strategies that enhance patient satisfaction and long-term outcomes. The integration of AI and data analytics in dermatology further supports precision-based drug development and monitoring.
- For instance, Novartis uses real-world data and patient support programs for its Cosentyx treatment, which targets the IL-17A cytokine, with dosing based on large clinical trials. UCB is involved in dermatology and targets the IL-17 pathway with its drug Bimzelx, and genetic research is common in the field of psoriasis to identify genetic risk factors and inform potential precision medicine approaches.
Key Challenges
High Cost of Biologic and Targeted Therapies
Despite strong clinical efficacy, the high cost of biologic treatments remains a major barrier to widespread adoption. Many patients in low- and middle-income countries face limited access due to affordability issues and inadequate insurance coverage. High production and distribution costs associated with biologics also strain healthcare budgets. Although biosimilars offer some relief, pricing disparities continue to limit market reach. Reducing costs through manufacturing innovation, local production, and policy reforms is critical to improving global accessibility to advanced antipsoriatic treatments.
Adverse Effects and Long-Term Safety Concerns
The potential side effects and long-term safety issues associated with systemic and biologic therapies present ongoing challenges. Immunosuppressive drugs may increase the risk of infections, liver damage, or malignancies, leading to cautious prescribing practices. Continuous monitoring and stringent regulatory evaluations are necessary to ensure patient safety. Pharmaceutical companies must invest in robust post-market surveillance and clinical research to assess long-term efficacy and safety profiles. Addressing these concerns through innovation and patient education is essential to maintaining trust and adoption in the antipsoriatics market.
Regional Analysis
North America
North America dominates the antipsoriatics market with a 41.5% share in 2024, driven by high disease prevalence, strong healthcare infrastructure, and rapid adoption of biologic therapies. The United States leads the region with extensive use of advanced biologics and biosimilars, supported by favorable reimbursement policies. Continuous product launches and ongoing clinical research by key pharmaceutical players further strengthen regional growth. Canada also contributes significantly through increased awareness and early diagnosis initiatives. The presence of major market leaders and expanding access to specialty dermatology care continue to reinforce North America’s leadership position.
Europe
Europe holds a 28.4% share in 2024, supported by widespread awareness of psoriasis management and strong healthcare coverage systems. Countries such as Germany, the United Kingdom, and France are key contributors, with high adoption of biologic and biosimilar therapies. Government initiatives promoting affordable treatment access and robust regulatory support for biosimilars are driving steady growth. Ongoing investments in research and patient assistance programs enhance disease management. The region’s focus on innovation and early therapeutic adoption positions Europe as one of the most mature and stable markets for antipsoriatic treatments.
Asia-Pacific
Asia-Pacific accounts for a 21.9% share in 2024, emerging as the fastest-growing regional market due to increasing psoriasis prevalence and rising healthcare expenditure. China, Japan, and India are leading countries with expanding access to dermatological care and growing acceptance of biologic therapies. Improved awareness, rapid urbanization, and expansion of pharmaceutical manufacturing capabilities further support regional growth. Governments are focusing on enhancing healthcare accessibility and approval processes for innovative drugs. The rising presence of global and local pharmaceutical companies is driving affordability and accessibility across diverse patient populations in Asia-Pacific.
Latin America
Latin America represents a 5.2% share in 2024, with Brazil and Mexico serving as key markets driven by rising awareness and expanding healthcare investments. Growing diagnosis rates and access to biologic drugs are enhancing treatment adoption. However, cost barriers and uneven insurance coverage limit broader market penetration. Governments are promoting public health initiatives to improve dermatology services and reduce disease burden. Partnerships between global pharmaceutical firms and regional distributors are improving product availability, helping the region advance toward greater treatment accessibility and awareness of psoriasis management.
Middle East & Africa
The Middle East & Africa region holds a 3.0% share in 2024, supported by increasing investment in healthcare infrastructure and a gradual rise in dermatological care awareness. Countries such as Saudi Arabia, the United Arab Emirates, and South Africa are leading in adopting advanced therapies. Growing private healthcare expenditure and improved availability of branded medications are driving growth. However, limited affordability and shortage of specialized dermatologists continue to restrain market expansion. Efforts toward healthcare modernization and the introduction of cost-effective biosimilars are expected to strengthen the region’s future market potential.
Market Segmentations:
By Drug Type
- Biologic Antipsoriatic Drugs
- Non-Biologic Systemic Drugs
- Topical Antipsoriatic Agents
- Combination Therapy
By Route of Administration
- Oral
- Injectable
- Topical
By Type of Psoriasis
- Plaque Psoriasis
- Guttate Psoriasis
- Inverse Psoriasis
- Erythrodermic Psoriasis
By Distribution Channel
- Hospital Pharmacies
- Retail Pharmacies
- Online Pharmacies
By Geography
- North America
- U.S.
- Canada
- Mexico
- Europe
- Germany
- France
- U.K.
- Italy
- Spain
- Rest of Europe
- Asia Pacific
- China
- Japan
- India
- South Korea
- South-east Asia
- Rest of Asia Pacific
- Latin America
- Brazil
- Argentina
- Rest of Latin America
- Middle East & Africa
- GCC Countries
- South Africa
- Rest of the Middle East and Africa
Competitive Landscape
Competitive landscape analysis of the antipsoriatics market highlights the presence of major players such as Novartis AG, Johnson & Johnson Services, Inc., AbbVie Inc., Amgen Inc., Pfizer Inc., Eli Lilly and Company, Bristol-Myers Squibb Company, UCB S.A., Sun Pharmaceutical Industries Ltd., and Leo Pharma A/S. These companies dominate the global market through extensive product portfolios of biologics, biosimilars, and topical formulations. The market is moderately consolidated, with continuous innovation in immunomodulators and targeted therapies driving competition. Strategic collaborations, clinical trials, and regulatory approvals are expanding market reach and product differentiation. Companies are investing heavily in R&D to develop next-generation biologics and oral small molecules with improved efficacy and safety. Additionally, expansion into emerging economies and patient-centric pricing strategies are key focus areas to enhance accessibility and strengthen global competitiveness in psoriasis treatment solutions.
Key Player Analysis
- Novartis AG
- Johnson & Johnson Services, Inc.
- AbbVie Inc.
- Amgen Inc.
- Pfizer Inc.
- Eli Lilly and Company
- Bristol-Myers Squibb Company
- UCB S.A.
- Sun Pharmaceutical Industries Ltd.
- Leo Pharma A/S
Recent Developments
- In June 2025, Sun Pharmaceutical Industries Ltd. reported top-line results from a Phase 2 trial of its S1P₁ receptor modulator candidate SCD‑044 in moderate-to-severe plaque psoriasis (263 patients enrolled) — the trial did not meet its primary endpoint.
- In November 2023, Amgen Inc. announced results from the global Phase 4 FOREMOST study of its oral small-molecule drug Otezla® (apremilast) in early oligoarticular psoriatic arthritis, a related indication to psoriasis care.
- In March 2023, AbbVie Inc. released 52-week results from an open-label study of its IL-23 inhibitor SKYRIZI® (risankizumab) in plaque-psoriasis patients who had prior sub-optimal response to IL-17 inhibitor therapy.
Report Coverage
The research report offers an in-depth analysis based on Drug Type, Route of Administration, Type of Psoriasis, Distribution Channel and Geography. It details leading market players, providing an overview of their business, product offerings, investments, revenue streams, and key applications. Additionally, the report includes insights into the competitive environment, SWOT analysis, current market trends, as well as the primary drivers and constraints. Furthermore, it discusses various factors that have driven market expansion in recent years. The report also explores market dynamics, regulatory scenarios, and technological advancements that are shaping the industry. It assesses the impact of external factors and global economic changes on market growth. Lastly, it provides strategic recommendations for new entrants and established companies to navigate the complexities of the market.
Future Outlook
- Demand for biologic and targeted therapies will continue to grow with better treatment outcomes.
- Biosimilars will gain wider acceptance, improving affordability and access in developing regions.
- Personalized and precision medicine will shape future psoriasis management strategies.
- Oral small-molecule inhibitors will expand as convenient alternatives to injectable biologics.
- Increased R&D investment will lead to next-generation immunomodulatory drug development.
- Digital dermatology and telemedicine will enhance diagnosis and treatment monitoring.
- Pharmaceutical collaborations will accelerate innovation and global market expansion.
- Growing awareness and early diagnosis programs will boost patient treatment rates.
- Regulatory support for biosimilars and cost-effective therapies will strengthen market competitiveness.
- Asia-Pacific will emerge as a key growth region due to expanding healthcare access and rising patient awareness.
Request a Free Sample
Fill in your details and we'll send you a free sample report.
- Sample data tables & charts
- Research methodology
Need a Custom Version of This Report?
Tailor the scope, geography, or segments to your exact requirements.
- Custom geography or segment scope
- Direct access to our analyst team
Frequently Asked Questions
What is the current market size for Antipsoriatics Market, and what is its projected size in 2032?
At what Compound Annual Growth Rate is the Antipsoriatics Market projected to grow between 2025 and 2032?
Which Antipsoriatics Market segment held the largest share in 2024?
What are the primary factors fueling the growth of the Antipsoriatics Market?
Who are the leading companies in the Antipsoriatics Market?
Which region commanded the largest share of the Antipsoriatics Market in 2024?
Table of Content
Chapter 1. Report Introduction
- 1.1 Report Description & Purpose
- 1.1.1 Report Title & Market Definition
- 1.1.2 Unique Selling Propositions (USP) & Key Differentiators
- 1.1.3 Value Proposition for Stakeholders
- 1.2 Research Objectives
- 1.2.1 Market Sizing Objectives (Volume & Revenue)
- 1.2.2 Segmentation Objectives
- 1.2.3 Competitive Intelligence Objectives
- 1.2.4 Forecast & Scenario Objectives
- 1.3 Report Scope
- 1.3.1 Antipsoriatics Scope – Types & Subtypes Covered
- 1.3.2 Geographic Scope – Regions & Countries Covered
- 1.3.3 Historical Period, Base Year & Forecast Period (2024; forecast to 2032)
- 1.3.4 Inclusions & Exclusions
- 1.4 HS Code & Classification Framework
- 1.5 Currency, Units & Pricing Basis
- 1.6 Target Stakeholders
- 1.7 Limitations & Assumptions
Chapter 2. Executive Summary
- 2.1 Global Antipsoriatics Market Snapshot
- 2.1.1 Market Size – Historical (2024) & Forecast (2024-2032) (2024: USD 26 billion → 2032: USD 56.72 billion)
- 2.1.2 Volume & Revenue – Global Totals
- 2.1.3 Key Market Highlights – Top Five Facts
- 2.2 Antipsoriatics Market Segmentation Snapshot
- 2.2.1 Market Split by Region – 2024 vs. 2032
- 2.3 Competitive Snapshot
- 2.3.1 Top 10 Players by Revenue Share – 2024
- 2.3.2 Top 10 Players by Volume Share – 2024
- 2.3.3 Recent Strategic Developments (18-Month Summary)
- 2.4 Key Investment Highlights & Strategic Conclusions
Chapter 3. Antipsoriatics Market Dynamics & Industry Analysis
- 3.1 Market Overview & Context
- 3.1.1 Antipsoriatics Market Position in the Broader Automotive Value Chain
- 3.1.2 OEM vs. Replacement Market Dynamics
- 3.1.3 Market Maturity & Development Stage by Region
- 3.2 Antipsoriatics Market Drivers
- 3.3 Antipsoriatics Market Restraints & Challenges
- 3.4 Antipsoriatics Market Opportunities
- 3.5 Porter's Five Forces Analysis
- 3.5.1 Threat of New Entrants
- 3.5.2 Bargaining Power of Suppliers
- 3.5.3 Bargaining Power of Buyers
- 3.5.4 Threat of Substitutes
- 3.5.5 Competitive Rivalry – Intensity Assessment
- 3.6 Antipsoriatics Value Chain Analysis
- 3.6.1 Upstream – Raw Material/Input Suppliers
- 3.6.1.1 Raw Material/Input 1
- 3.6.1.2 Raw Material/Input 2
- 3.6.1.3 Raw Material/Input 3
- 3.6.2 Midstream – Production/Manufacturing/Service Delivery
- 3.6.2.1 Production/Process Overview
- 3.6.2.2 Key Facility Locations & Capacity by Manufacturer
- 3.6.3 Downstream – Distribution & End Consumer
- 3.6.3.1 Primary Channel – B2B/OEM
- 3.6.3.2 Secondary Channels – Dealer, Retail, Online, Direct
- 3.6.4 Value Chain Profitability Analysis
- 3.6.1 Upstream – Raw Material/Input Suppliers
- 3.7 PESTEL Analysis
- 3.7.1 Political Factors
- 3.7.2 Economic Factors
- 3.7.3 Social Factors
- 3.7.4 Technological Factors
- 3.7.5 Environmental Factors
- 3.7.6 Legal Factors
- 3.8 Antipsoriatics Supply Chain Analysis
- 3.8.1 Raw Material/Input Supply Risk Assessment
- 3.8.2 Manufacturing Concentration Risk (Geographic Exposure)
- 3.8.3 Trade Disruption Impact Analysis
- 3.9 Regulatory & Policy Landscape
Note: The regulatory and policy landscape section covers regulations based on their applicability to the market, Antipsoriatics category, geography, and scope of the study. Only regulatory frameworks with a material impact on operations, compliance, trade, sustainability, or market access are analyzed in detail.
Chapter 4. Key Investment Pockets & Opportunity Analysis
- 4.1 Antipsoriatics Market Attractiveness Analysis
- 4.1.1 By Region – Investment Attractiveness Matrix (Volume × CAGR)
- 4.2 Absolute Revenue Growth Opportunity
- 4.2.1 By Region – Absolute USD Growth Through 2032
- 4.3 Incremental Volume Opportunity
- 4.3.1 By Region – Incremental Volume Through 2032
- 4.3.2 Segment – Incremental Volume
- 4.4 Emerging Submarket Opportunity Deep Dive (Subject to Applicability)
- 4.5 Emerging Market Opportunity Scorecards
- 4.5.1 United States
- 4.5.2 Europe
- 4.5.3 Asia
- 4.5.4 Middle East & Africa
Note: Emerging Market Opportunity Scorecards will be included based on relevance and strategic importance. Regions listed are indicative and may vary depending on data availability and market dynamics.
Chapter 5. Antipsoriatics Import-Export Analysis & Trade Flows
- 5.1 Global Trade Overview
- 5.1.1 Global Export Value by Country (2024)
- 5.1.2 Global Export Volume by Country (2024)
- 5.1.3 Global Import Value by Country (2024)
- 5.1.4 Global Import Volume by Country (2024)
- 5.1.5 Net Trade Balance by Country (2024)
- 5.2 Export Analysis – Segment
- 5.2.1 Type 1 (HS Code)
- 5.2.2 Type 2 (HS Code)
- 5.2.3 Type 3 (HS Code)
- 5.2.4 Type 4 (HS Code)
- 5.2.5 Type 5 (HS Code)
- 5.3 Import Analysis – Segment
- 5.3.1 Type 1 (HS Code)
- 5.3.2 Type 2 (HS Code)
- 5.3.3 Type 3 (HS Code)
- 5.3.4 Type 4 (HS Code)
- 5.3.5 Type 5 (HS Code)
- 5.4 Average Unit Trade Prices
- 5.4.1 Average Export Price – Segment & Country
- 5.4.2 Average Import Price – Segment & Source Country
- 5.4.3 Price Trends (2024)
- 5.5 Key Trade Route Analysis
- 5.5.1 Trade Route 1
- 5.5.2 Trade Route 2
- 5.5.3 Trade Route 3
- 5.5.4 Trade Route 4
- 5.5.5 Trade Route 5
- 5.6 Trade Policy Impact Assessment
- 5.6.1 US Anti-Dumping & Section 301 Tariffs
- 5.6.2 EU Customs Union Impact
- 5.6.3 Major Free Trade Agreements
- 5.6.4 USMCA Rules of Origin
Note: Trade policy analysis will be included only where relevant to the Antipsoriatics market.
Chapter 6. Competitive Landscape & Company Benchmarking
- 6.1 Antipsoriatics Market Concentration & Structure
- 6.1.1 Herfindahl-Hirschman Index (HHI) – vs. 2024
- 6.1.2 Tier 1, Tier 2 & Tier 3 Market Structure
- 6.1.3 Global, Regional & Local Player Dynamics
- 6.2 Antipsoriatics Market Share Analysis – 2024
- 6.2.1 Global Revenue Share by Company
- 6.2.2 Global Volume Share by Company
- 6.2.3 Regional Revenue Share
- 6.2.4 Market Share Evolution ( vs. 2024)
- 6.2.5 OEM Segment Share by Company
- 6.2.6 Replacement Segment Share by Company
- 6.3 Production/Delivery Capacity & Facility Analysis
- 6.3.1 Global Installed Capacity
- 6.3.2 Capacity Utilization Rates
- 6.3.3 Production/Output Volume
- 6.3.4 Facility Locations & Capacity Map
- 6.3.5 Planned Capacity Additions
- 6.4 Antipsoriatics Competitive Benchmarking Matrix
- 6.4.1 Revenue, Volume, CAGR & Profitability Comparison
- 6.4.2 Channel Revenue Mix
- 6.4.3 Geographic Revenue Exposure
- 6.4.4 R&D Intensity
- 6.4.5 Sustainability Maturity
- 6.5 Strategic Developments in Antipsoriatics (Last 24 Months)
- 6.5.1 Mergers, Acquisitions & Divestments
- 6.5.2 New Antipsoriatics Launches
- 6.5.3 Facility Expansions
- 6.5.4 Strategic Alliances, Joint Ventures & Partnerships
- 6.5.5 Distribution Expansion & Market Entry
- 6.5.6 Sustainability & ESG Initiatives
- 6.6 Competitive Strategy Mapping
- 6.6.1 Leader, Challenger, Follower & Niche Classification
- 6.6.2 Pricing Strategy Comparison
- 6.6.3 Channel Strategy Matrix
Note: Strategic developments are included based on their materiality and the availability of reliable information.
Chapter 7. Global Antipsoriatics Market – By Distribution Channel
- 7.1 Segment Overview
- 7.1.1 Volume & Revenue Split by Channel (2024 & 2032)
- 7.1.2 Channel Mix Evolution (2024-2032)
Chapter 8. Regional Market Analysis – Global Overview
- 8.1 Global Regional Overview
- 8.1.1 Regional Volume Share
- 8.1.2 Regional Revenue Share
- 8.1.3 Regional Volume by Region
- 8.1.4 Regional Revenue by Region
- 8.1.5 Regional Forecast Through 2032
- 8.2 Cross-Regional Segment Analysis
- 8.2.1 By Distribution Channel
- 8.2.2 By Brand/Price Tier
Chapter 9. North America Antipsoriatics Market
- 9.1 United States
- 9.2 Canada
- 9.3 Mexico
Chapter 10. Europe Antipsoriatics Market
- 10.1 Germany
- 10.2 France
- 10.3 Italy
- 10.4 United Kingdom
- 10.5 Spain
- 10.6 Poland
- 10.7 Russia
- 10.8 Netherlands
- 10.9 Belgium
- 10.10 Sweden
- 10.11 Denmark
- 10.12 Norway
- 10.13 Rest of Europe
Chapter 11. Asia Pacific Antipsoriatics Market
- 11.1 China
- 11.2 India
- 11.3 Japan
- 11.4 South Korea
- 11.5 Thailand
- 11.6 Indonesia
- 11.7 Vietnam
- 11.8 Malaysia
- 11.9 Australia
- 11.10 Rest of Asia Pacific
Chapter 12. Latin America Antipsoriatics Market
- 12.1 Brazil
- 12.2 Argentina
- 12.3 Colombia
- 12.4 Chile
- 12.5 Rest of Latin America
Chapter 13. Middle East Antipsoriatics Market
- 13.1 Saudi Arabia
- 13.2 United Arab Emirates
- 13.3 Turkey
- 13.4 Israel
- 13.5 Iran
- 13.6 Rest of the Middle East
Chapter 14. Africa Antipsoriatics Market
- 14.1 South Africa
- 14.2 Egypt
- 14.3 Nigeria
- 14.4 Morocco
- 14.5 Rest of Africa
Chapter 15. Antipsoriatics Company Profiles
- 15.1 [Company 01]
- 15.1.1 Company Overview
- 15.1.2 Key Management Personnel
- 15.1.3 Products & Services Portfolio
- 15.1.4 Financial Performance
- 15.1.5 Key Market Focus & Geographic Presence
- 15.1.6 Recent Developments & Strategic Initiatives
Note: The company profile list is preliminary and may change based on research findings, market developments, data availability, and client requirements.
Chapter 16. Appendices
- Appendix A – List of Abbreviations & Acronyms
- Appendix B – Industry Classification Code Reference – Full Series
- Appendix C – Production & Capacity Data Tables
- Appendix D – End-Use & Demand Base Tables
- Appendix E – Consumption & Replacement Rate Assumptions
- Appendix F – ASP Reference Tables
- Appendix G – Manufacturing & Facility Database
- Appendix H – Import-Export Data Tables
- Appendix I – Regulatory Summary Tables
- Appendix J – Primary Research Participant List (Anonymized)
- Appendix K – Primary Research Questionnaire Framework
- Appendix L – Data Sources & Bibliography
- Appendix M – Market Size Divergence & Source Comparison
Chapter 17. Research Methodology
- 17.1 Research Framework & Philosophy
- 17.2 Secondary Research – Sources, Hierarchy & Data Extraction
- 17.3 Data Modeling – Bottom-Up & Top-Down Market Sizing
- 17.4 Primary Research – Stakeholder Framework, LOI & Sample Sizes
- 17.5 Forecast Methodology – Regression, Scenario & Sensitivity Analysis
- 17.6 Quality Control – Four-Layer Validation Framework
- 17.7 Limitations & Standard Assumptions
- 17.8 Disclaimer
