
| REPORT ATTRIBUTE | DETAILS |
|---|---|
| Historical Period | 2019-2022 |
| Base Year | 2023 |
| Forecast Period | 2024-2032 |
| Australia Reusable Water Bottles Market Size 2023 | USD 103.73 million |
| Australia Reusable Water Bottles Market, CAGR | 5.30% |
| Australia Reusable Water Bottles Market Size 2032 | USD 166.32 million |
Market Overview
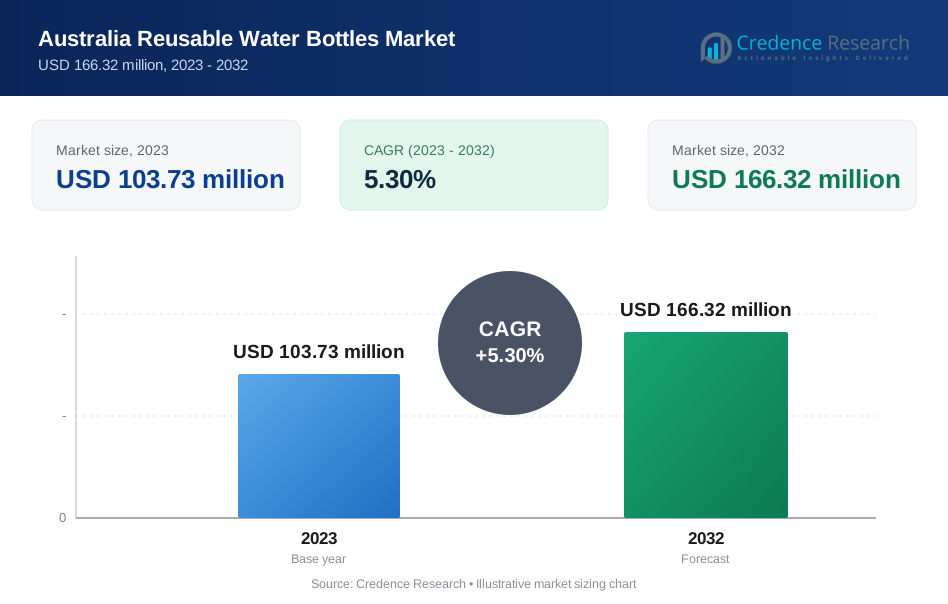
The Australia Reusable Water Bottles Market is projected to grow from USD 103.73 million in 2023 to an estimated USD 166.32 million by 2032, with a compound annual growth rate (CAGR) of 5.30% from 2024 to 2032. This significant growth is driven by increasing environmental awareness and consumer preferences shifting towards sustainable and eco-friendly products. The market has seen a consistent rise in demand due to the growing concerns about single-use plastics and their environmental impact, coupled with supportive government initiatives and regulations aimed at reducing plastic waste.
Key market drivers include the increasing health consciousness among consumers, leading to higher water consumption and the preference for reusable bottles for their convenience and long-term cost-effectiveness. Additionally, the trend towards outdoor recreational activities and fitness has bolstered the demand for durable and portable water bottles. Technological advancements in materials and design have also played a crucial role, with manufacturers offering innovative products that provide enhanced functionality, such as temperature retention and ergonomic designs. The market is also witnessing a trend towards customization and personalization, appealing to a broader consumer base.
Geographically, the reusable water bottles market in Australia is highly concentrated in urban areas where environmental consciousness and disposable income levels are higher. Major cities such as Sydney, Melbourne, and Brisbane are the key regions driving market growth. Key players in the market include prominent brands like CamelBak, Klean Kanteen, and S'well, which are recognized for their high-quality and durable products. These companies are continually investing in research and development to introduce new products that meet the evolving needs of consumers. Additionally, local Australian brands are gaining traction by emphasizing sustainability and aligning with the eco-friendly values of the population.
Market Drivers
Environmental Awareness and Sustainability Initiatives
The surge in environmental consciousness among Australian consumers is a significant driver of the reusable water bottles market. Growing awareness about the detrimental impact of single-use plastics on marine life and ecosystems has led to a shift in consumer behavior towards more sustainable alternatives. Government policies and initiatives promoting environmental sustainability have further fueled this shift. For instance, campaigns aimed at reducing plastic waste, such as bans on single-use plastics in various states, have bolstered the adoption of reusable water bottles. These measures encourage consumers to make eco-friendly choices, contributing to the steady growth of the market.
Health and Wellness Trends
The rising health consciousness among Australians has significantly influenced the demand for reusable water bottles. With a growing focus on hydration as an essential aspect of maintaining overall health and well-being, consumers are increasingly seeking convenient and reliable ways to carry water. Reusable water bottles offer a practical solution, aligning with the health and fitness trends that emphasize the importance of staying hydrated, especially during physical activities. The market benefits from the increasing participation in sports, outdoor activities, and fitness regimes, where the need for portable and durable hydration solutions is paramount. This trend is expected to continue driving market growth as more consumers adopt active and health-conscious lifestyles.
Technological Advancements and Product Innovations
Technological advancements and continuous product innovations are crucial drivers in the Australia reusable water bottles market. Manufacturers are investing in research and development to create bottles that cater to the evolving preferences of consumers. Innovations such as temperature-retaining bottles, lightweight and durable materials, and ergonomic designs enhance the usability and appeal of reusable water bottles. Additionally, the introduction of features like built-in filtration systems and smart hydration tracking technology has added a new dimension to product offerings. These advancements not only improve the functionality of reusable water bottles but also attract tech-savvy consumers looking for products that integrate seamlessly with their lifestyle.
Customization and Personalization Trends
The trend towards customization and personalization is playing a significant role in driving the market for reusable water bottles in Australia. Consumers are increasingly looking for products that reflect their personal style and preferences. Brands have responded to this demand by offering a wide range of customizable options, including various colors, patterns, and designs. Personalized bottles, which can be tailored with names, logos, or unique graphics, are particularly popular among younger consumers and corporate clients seeking branded merchandise. This trend not only enhances the consumer's connection to the product but also encourages brand loyalty and repeat purchases. The ability to personalize reusable water bottles adds value and differentiates them from generic alternatives, contributing to market growth.
Market Trends
Increased Adoption of Sustainable Materials
The demand for eco-friendly products has driven manufacturers to explore and utilize sustainable materials in the production of reusable water bottles. Consumers are increasingly seeking bottles made from materials such as stainless steel, glass, and BPA-free plastics. These materials are not only durable and safe but also align with the growing preference for products that have a minimal environmental footprint. Brands that emphasize their commitment to sustainability and use of recycled or biodegradable materials are gaining popularity among environmentally conscious consumers.
Technological Integration
The integration of technology into reusable water bottles is a notable trend in the Australian market. Smart water bottles equipped with features such as hydration tracking, temperature control, and even reminders to drink water are becoming increasingly popular. These technologically advanced bottles cater to health-conscious consumers who want to monitor their water intake and maintain optimal hydration levels. The rise of the Internet of Things (IoT) has facilitated the development of these smart bottles, making them a sought-after accessory for tech-savvy individuals.
Customization and Personalization
Customization and personalization are significant trends that cater to the consumer's desire for unique and individualized products. Companies are offering options for customers to personalize their bottles with names, logos, and custom designs. This trend is especially popular among younger consumers and corporate clients who use personalized bottles for promotional purposes. The ability to tailor products to individual tastes and preferences adds value and enhances customer loyalty.
Health and Wellness Focus
The increasing focus on health and wellness has driven the demand for reusable water bottles as a means to encourage regular hydration. Consumers are more aware of the health benefits associated with drinking water, and reusable bottles provide a convenient way to ensure they have access to water throughout the day. This trend is supported by the rise of fitness and wellness movements, which emphasize the importance of staying hydrated for overall health and physical performance.
Outdoor and Active Lifestyle
The popularity of outdoor activities and an active lifestyle has significantly influenced the reusable water bottles market. Australians who engage in hiking, cycling, running, and other outdoor pursuits prefer durable and portable water bottles that can withstand rigorous activities. Brands are responding to this trend by developing bottles that are lightweight, robust, and designed to fit into outdoor gear such as backpacks and bicycle holders.
Aesthetic Appeal and Design Innovation
The aesthetic appeal of reusable water bottles has become a key factor in consumer purchasing decisions. Sleek, modern designs and attractive color schemes are appealing to a broad range of consumers. Brands are focusing on innovative design elements that not only enhance the visual appeal of the bottles but also improve their functionality. Features such as easy-to-use lids, ergonomic shapes, and non-slip grips are becoming standard, ensuring that the bottles are both stylish and practical.
Corporate and Educational Institution Adoption
There is a growing trend of corporate and educational institutions adopting reusable water bottles as part of their sustainability initiatives. Companies are providing branded reusable bottles to employees as part of wellness programs, while schools and universities are encouraging students to use reusable bottles to reduce plastic waste. This institutional adoption not only helps in promoting a sustainable culture but also drives the demand for reusable water bottles on a larger scale.
Market Restraints and Challenges
High Initial Cost
One of the primary restraints in the Australia reusable water bottles market is the high initial cost of these products compared to single-use plastic bottles. High-quality reusable bottles made from materials like stainless steel or glass are priced significantly higher, which can deter cost-conscious consumers from making the switch. While the long-term benefits and cost savings of reusable bottles are evident, the upfront expense remains a barrier for many potential buyers, especially in a price-sensitive market.
Market Saturation and Competition
The market for reusable water bottles in Australia is becoming increasingly saturated with numerous local and international brands vying for market share. This intense competition makes it challenging for new entrants to establish themselves and for existing brands to maintain their market position. The proliferation of products can lead to market fragmentation, where no single brand can dominate, thus limiting the growth potential of individual companies. Additionally, brands must continually innovate and differentiate their products to stay competitive, which requires substantial investment in research and development.
Consumer Habits and Convenience of Single-Use Plastics
Despite the growing awareness of environmental issues, changing consumer habits remains a significant challenge. Many consumers still prefer the convenience of single-use plastic bottles, which are readily available and require no maintenance. The ingrained habit of using disposable bottles, especially in on-the-go situations, can be difficult to break. This preference for convenience over sustainability hampers the widespread adoption of reusable bottles.
Hygiene Concerns
Hygiene concerns associated with reusable water bottles can also act as a deterrent. Consumers worry about the potential for bacterial growth and the cleanliness of bottles, particularly if they are not cleaned regularly or properly. These concerns can discourage the use of reusable bottles, as consumers may find it easier to use and discard single-use bottles rather than dealing with the cleaning and maintenance of reusable ones. Addressing these hygiene issues requires educating consumers on proper cleaning practices and possibly integrating self-cleaning technologies.
Limited Infrastructure for Refilling Stations
The lack of sufficient infrastructure for refilling reusable water bottles is another challenge in the market. While there are increasing numbers of water refill stations being installed in public places, the availability is still not widespread enough to support the needs of all consumers. This limitation makes it inconvenient for users to refill their bottles, especially when traveling or in areas where refill stations are not readily accessible. Expanding the network of refill stations is essential to support the adoption of reusable bottles.
Environmental Impact of Production
Although reusable water bottles are marketed as an eco-friendly alternative, the production process of these bottles can have a significant environmental impact. The manufacturing of stainless steel, glass, and even BPA-free plastic bottles involves energy-intensive processes that can contribute to environmental degradation. Consumers who are highly conscious of their environmental footprint may be wary of the production practices of certain brands, which could affect their purchasing decisions.
Market Segmentation Analysis
By Material Type
Glass reusable water bottles offer a premium appeal due to their purity, as they do not retain flavors or odors, making them popular among health-conscious consumers. However, their fragility limits practicality for everyday or outdoor use. Stainless steel bottles, known for their durability and double-walled insulation, are ideal for active lifestyles, although their weight can be a drawback for portability. Plastic bottles are affordable and lightweight, suitable for everyday use, but pose environmental concerns despite being BPA-free. Silicone bottles are flexible, collapsible, and durable, catering to niche markets due to their unique properties. Additionally, innovative materials like bamboo appeal to eco-conscious consumers prioritizing sustainability.
By Distribution Channel
Specialty stores in the Australia reusable water bottles market offer a curated selection of high-quality, premium products and provide personalized recommendations and expert advice, though their limited geographical reach can affect market penetration. Convenience stores, on the other hand, ensure easy access for immediate purchase needs and impulse buying but typically offer a more limited, mainstream selection. Supermarkets and hypermarkets provide a wide range of products catering to diverse consumer preferences and price points, benefitting from high foot traffic and competitive pricing to boost sales. Online retail platforms enhance the shopping experience with extensive options, detailed descriptions, and home delivery convenience, while direct sales channels focus on building strong customer relationships and offering personalized services, particularly effective for niche and premium products.
Segments
Based on Material Type
- Glass
- Stainless Steel
- Plastic
- Silicone
- Others
Based on Distribution Channel
- Specialty Stores
- Convenience Stores
- Supermarkets and Hypermarkets
- Others
Regional Analysis
New South Wales (30%):
New South Wales, particularly Sydney, holds the largest market share in the Australia reusable water bottles market, accounting for approximately 30% of the total market. This dominance is attributed to the region's high population density, urban lifestyle, and strong environmental consciousness. Sydney, being a major economic and cultural hub, fosters a consumer base that is both affluent and health-conscious. The region's residents are more inclined towards adopting sustainable practices, including the use of reusable water bottles. Additionally, numerous initiatives and regulations aimed at reducing plastic waste have been implemented in NSW, further driving the demand for eco-friendly alternatives.
Victoria (25%):
Victoria, with Melbourne as its capital, captures around 25% of the market share. Melbourne’s reputation as a progressive city with a strong focus on sustainability significantly contributes to the market growth for reusable water bottles. The city’s vibrant culture of outdoor activities, fitness, and wellness supports the demand for portable hydration solutions. The Victorian government’s policies promoting environmental conservation and waste reduction also play a crucial role in boosting the adoption of reusable water bottles. Moreover, a well-developed retail sector ensures the availability of a wide range of reusable water bottles, catering to diverse consumer preferences.
Key players
- Smith Corporation
- Newell Brands, Inc.
- Vista Outdoor, Inc. (CamelBak Products LLC)
- Groupe SEB
- Tupperware Brands Company
- SIGG Switzerland Bottles AG (Zhejiang Haers Vacuum Containers Co., Ltd.)
- Klean Kanteen
- Hydaway LLC
- Bulletin Bottle
Competitive Analysis
The Australia reusable water bottles market is highly competitive, characterized by the presence of both global and local players. Leading companies such as CamelBak (Vista Outdoor, Inc.), Klean Kanteen, and SIGG Switzerland Bottles AG dominate the market with their extensive product portfolios and strong brand recognition. These companies leverage advanced technologies, innovative designs, and superior quality to maintain their market positions. Newell Brands, Inc. and Groupe SEB also hold significant market shares, offering a variety of durable and stylish bottles that cater to different consumer needs. Tupperware Brands Company is known for its focus on functional and everyday use bottles. Hydaway LLC and Bulletin Bottle cater to niche markets with unique, collapsible, and customizable products. The competitive landscape is dynamic, with companies continuously investing in research and development to introduce new products that align with evolving consumer preferences and sustainability trends.
Recent Developments
In April 2023, Nalgene announced its transition to using Eastman’s Tritan Renew for its reusable bottles. Tritan Renew is a certified 50% recycled material, determined using the mass balance technique. This shift began in 2020 and was fully implemented by January 2023. Throughout the conversion process, Nalgene successfully repurposed over 2.35 million pounds of plastic waste, underscoring its commitment to sustainability and environmental responsibility.
In February 2023, SIGG Switzerland AG participated in the ABN AMRO Open tennis tournament in Rotterdam, Netherlands. The company provided all players with reusable drinking bottles made from Tritan Renew, a highly impact and scratchresistant material. The Tritan used is certified by the International Sustainability and Carbon Certification (ISCC), reflecting SIGG's dedication to sustainability and highquality products.
In December 2022, Klean Kanteen, along with MiiR, Stanley, and YETI, formed the Drinkware CoLab. This initiative aims to reduce carbon emissions in their supply chains and support the Outdoor Industry Association's (OIA) goal of becoming the first climatepositive industry by 2030. As members of the OIA’s Climate Action Corps, these brands are committed to generating netpositive environmental benefits, surpassing netzero objectives.
In August 2022, S’well introduced its Elements Collection, featuring three highgloss bottles: ‘Blue Marble,’ ‘Charcoal Granite,’ and ‘Opal Marble.’ These bottles showcase earthy shades and tones, and are doublewalled and made of stainless steel with insulation that keeps beverages cold for 24 hours and hot for 12 hours. The design includes features such as condensation prevention, dripfree sipping, and a wide mouth for adding ice.
Market Concentration and Characteristics
The Australia reusable water bottles market is characterized by a moderate to high level of market concentration, dominated by several key players such as CamelBak, Klean Kanteen, SIGG Switzerland Bottles AG, and Newell Brands, Inc. These companies leverage strong brand recognition, extensive distribution networks, and continuous product innovation to maintain their market positions. The market features a diverse range of products catering to varying consumer preferences, from highend stainless steel and glass bottles to more affordable BPAfree plastic options. Additionally, the market is influenced by a growing consumer emphasis on sustainability and health, driving demand for ecofriendly and durable hydration solutions.
Report Coverage
The research report offers an indepth analysis based on Material Type and Distribution Channel. It details leading market players, providing an overview of their business, product offerings, investments, revenue streams, and key applications. Additionally, the report includes insights into the competitive environment, SWOT analysis, current market trends, as well as the primary drivers and constraints. Furthermore, it discusses various factors that have driven market expansion in recent years. The report also explores market dynamics, regulatory scenarios, and technological advancements that are shaping the industry. It assesses the impact of external factors and global economic changes on market growth. Lastly, it provides strategic recommendations for new entrants and established companies to navigate the complexities of the market.
Future Outlook
- The market is expected to continue its upward trajectory, driven by increasing environmental awareness and consumer preferences for sustainable products.
- Future developments will likely see more advanced materials being used, such as biodegradable plastics and enhanced stainless steel, to improve durability and sustainability.
- The incorporation of smart features, such as hydration tracking and temperature control, will become more prevalent, catering to techsavvy and healthconscious consumers.
- Companies will expand their product lines to include more customizable and aesthetically appealing designs, meeting the diverse tastes and preferences of consumers.
- Strengthening government regulations and initiatives aimed at reducing singleuse plastics will further boost the adoption of reusable water bottles.
- As urban areas grow, the demand for convenient and portable hydration solutions will rise, supporting market growth.
- Brands that emphasize their commitment to environmental sustainability will gain a competitive edge, attracting ecoconscious consumers.
- An increase in local manufacturing will be seen, driven by the demand for regionspecific designs and the desire to reduce carbon footprints associated with transportation.
- Collaborations between brands and environmental organizations will enhance product credibility and drive consumer trust and engagement.
- Efforts to penetrate rural and remote markets will increase, expanding the overall market reach and catering to a broader demographic.
Request a Free Sample
Fill in your details and we'll send you a free sample report.
- Sample data tables & charts
- Research methodology
Need a Custom Version of This Report?
Tailor the scope, geography, or segments to your exact requirements.
- Custom geography or segment scope
- Direct access to our analyst team
Frequently Asked Questions
What is the projected growth of the Australia Reusable Water Bottles Market?
What are the key drivers of the market growth?
Which regions in Australia dominate the reusable water bottles market?
How are technological advancements influencing the market?
What role does customization play in the market?
Table of Content
Chapter 1. Report Introduction
- 1.1 Report Description & Purpose
- 1.1.1 Report Title & Market Definition
- 1.1.2 Unique Selling Propositions (USP) & Key Differentiators
- 1.1.3 Value Proposition for Stakeholders
- 1.2 Research Objectives
- 1.2.1 Market Sizing Objectives (Volume & Revenue) (Volume Where Applicable)
- 1.2.2 Segmentation Objectives
- 1.2.3 Competitive Intelligence Objectives
- 1.2.4 Forecast & Scenario Objectives
- 1.3 Report Scope
- 1.3.1 Australia Reusable Water Bottles Scope – Segments & Subsegments Covered
- 1.3.2 Geographic Scope – Selected Country & Subnational Markets Covered
- 1.3.3 Historical Period, Base Year & Forecast Period (2023; forecast to 2032)
- 1.3.4 Inclusions & Exclusions
- 1.4 Industry Classification & Applicable Codes
- 1.5 Currency, Measurement Units & Valuation Basis
- 1.6 Target Stakeholders
- 1.7 Limitations & Assumptions
Chapter 2. Executive Summary
- 2.1 Australia Reusable Water Bottles Snapshot
- 2.1.1 Market Size – Historical (2023) & Forecast (2023-2032) (2023: USD 103.73 million → 2032: USD 166.32 million)
- 2.1.2 Volume & Revenue – National Totals (Volume Where Applicable)
- 2.1.3 Key Market Highlights – Top Five Facts
- 2.2 Australia Reusable Water Bottles Segmentation Snapshot
- 2.2.1 Market Split by Subnational Area – 2023 vs. 2032
- 2.3 Competitive Snapshot
- 2.3.1 Top 10 Players by Revenue Share – 2023
- 2.3.2 Top 10 Players by Volume Share – 2023 (Volume Where Applicable)
- 2.3.3 Recent Strategic Developments (18-Month Summary)
- 2.4 Key Investment Highlights & Strategic Conclusions
Chapter 3. Australia Reusable Water Bottles Dynamics & Industry Analysis
- 3.1 Market Overview & Context
- 3.1.1 Australia Reusable Water Bottles Position in the Broader Industry Value Chain
- 3.1.2 Demand Structure & Purchasing Dynamics
- 3.1.3 Market Maturity & Development Stage Across Domestic Markets
- 3.2 Australia Reusable Water Bottles Drivers
- 3.3 Australia Reusable Water Bottles Restraints & Challenges
- 3.4 Australia Reusable Water Bottles Opportunities
- 3.5 Porter's Five Forces Analysis
- 3.5.1 Threat of New Entrants
- 3.5.2 Bargaining Power of Suppliers
- 3.5.3 Bargaining Power of Buyers
- 3.5.4 Threat of Substitutes
- 3.5.5 Competitive Rivalry – Intensity Assessment
- 3.6 Australia Reusable Water Bottles Value Chain Analysis
- 3.6.1 Upstream – Key Inputs, Resources & Suppliers
- 3.6.1.1 Key Input/Resource 1
- 3.6.1.2 Key Input/Resource 2
- 3.6.1.3 Key Input/Resource 3
- 3.6.2 Midstream – Core Operations & Value Creation
- 3.6.2.1 Operating Model & Process Overview
- 3.6.2.2 Key Operating Locations & Capabilities by Company
- 3.6.3 Downstream – Market Channels & End Users
- 3.6.3.1 Direct Sales & Customer Engagement Channels
- 3.6.3.2 Indirect Sales, Intermediaries & Partner Channels
- 3.6.4 Value Chain Profitability Analysis
- 3.6.1 Upstream – Key Inputs, Resources & Suppliers
- 3.7 PESTEL Analysis
- 3.7.1 Political Factors
- 3.7.2 Economic Factors
- 3.7.3 Social Factors
- 3.7.4 Technological Factors
- 3.7.5 Environmental Factors
- 3.7.6 Legal Factors
- 3.8 Australia Reusable Water Bottles Supply Chain Analysis
- 3.8.1 Critical Input & Resource Availability Risk Assessment
- 3.8.2 Supplier & Operational Concentration Risk (Geographic Exposure)
- 3.8.3 Supply & Service Disruption Impact Analysis
- 3.9 National & Subnational Regulatory Landscape
Note: The regulatory and policy landscape section covers regulations based on their applicability to the market, Australia Reusable Water Bottles category, geography, and scope of the study. Only regulatory frameworks with a material impact on operations, compliance, trade, sustainability, or market access are analyzed in detail.
Chapter 4. Key Investment Pockets & Opportunity Analysis
- 4.1 Australia Reusable Water Bottles Attractiveness Analysis
- 4.1.1 By Subnational Area – Investment Attractiveness Matrix (Market Size × CAGR)
- 4.2 Absolute Revenue Growth Opportunity
- 4.2.1 By Subnational Area – Absolute Revenue Growth Through 2032
- 4.3 Incremental Demand Opportunity
- 4.3.1 By Subnational Area – Incremental Demand Through 2032
- 4.3.2 Segment – Incremental Demand
- 4.4 Emerging Submarket Opportunity Deep Dive (Subject to Applicability)
- 4.5 Priority Domestic Market Opportunity Scorecards
- 4.5.1 Priority Domestic Market 1
- 4.5.2 Priority Domestic Market 2
- 4.5.3 Priority Domestic Market 3
- 4.5.4 Priority Domestic Market 4
Note: Domestic market scorecards cover relevant states, provinces, territories, cities, or economic zones within the selected country. Numbered entries are populated with market names suited to the national administrative structure and research scope. Geographic share tables use one consistent, nonoverlapping set of areas.
Chapter 5. Australia Reusable Water Bottles Cross-Border Trade & Market Access Analysis
- 5.1 National Trade & International Partner Overview
- 5.1.1 Export Value by Destination Country (2023)
- 5.1.2 Export Volume by Destination Country (2023) (Where Applicable)
- 5.1.3 Import Value by Source Country (2023)
- 5.1.4 Import Volume by Source Country (2023) (Where Applicable)
- 5.1.5 National & Partner-Country Trade Balances (2023)
- 5.2 Export Analysis – Segment
- 5.2.1 Category 1 (Applicable Classification Code)
- 5.2.2 Category 2 (Applicable Classification Code)
- 5.2.3 Category 3 (Applicable Classification Code)
- 5.2.4 Category 4 (Applicable Classification Code)
- 5.2.5 Category 5 (Applicable Classification Code)
- 5.3 Import Analysis – Segment
- 5.3.1 Category 1 (Applicable Classification Code)
- 5.3.2 Category 2 (Applicable Classification Code)
- 5.3.3 Category 3 (Applicable Classification Code)
- 5.3.4 Category 4 (Applicable Classification Code)
- 5.3.5 Category 5 (Applicable Classification Code)
- 5.4 Cross-Border Pricing & Transaction Benchmarks
- 5.4.1 Export Pricing – Segment & Destination Country
- 5.4.2 Import Pricing – Segment & Source Country
- 5.4.3 Price Trends (2023)
- 5.5 Key Cross-Border Trade & Delivery Routes
- 5.5.1 Cross-Border Trade/Delivery Route 1
- 5.5.2 Cross-Border Trade/Delivery Route 2
- 5.5.3 Cross-Border Trade/Delivery Route 3
- 5.5.4 Cross-Border Trade/Delivery Route 4
- 5.5.5 Cross-Border Trade/Delivery Route 5
- 5.6 Trade Policy & Market Access Impact Assessment
- 5.6.1 Tariff & Non-Tariff Barriers
- 5.6.2 National Participation in Regional Trade & Economic Frameworks
- 5.6.3 Bilateral & Multilateral Trade Agreements
- 5.6.4 Cross-Border Operating, Licensing & Localization Requirements
Note: This chapter covers international trade relevant to Australia Reusable Water Bottles in the selected country. Exports are analyzed by destination and imports by source. Domestic interregional flows are excluded from international trade totals. Goods, services, and digital offerings use applicable classifications; volume and route analyses apply only where meaningful.
Chapter 6. Competitive Landscape & Company Benchmarking
- 6.1 Australia Reusable Water Bottles Concentration & Structure
- 6.1.1 Herfindahl-Hirschman Index (HHI) – vs. 2023
- 6.1.2 Leading, Mid-Sized & Emerging Player Structure
- 6.1.3 Multinational, National & Local Player Dynamics
- 6.2 Australia Reusable Water Bottles Share Analysis – 2023
- 6.2.1 National Revenue Share by Company
- 6.2.2 National Volume Share by Company (Volume Where Applicable)
- 6.2.3 Company Revenue Share by Subnational Area
- 6.2.4 Market Share Evolution ( vs. 2023)
- 6.2.5 Company Market Share by Key Segment
- 6.2.6 Company Market Share by Customer Group
- 6.3 Operating Scale, Capacity & Infrastructure Analysis
- 6.3.1 National Operating Scale & Supply Capacity
- 6.3.2 Resource Utilization & Operating Efficiency
- 6.3.3 Output, Service Delivery & Activity Metrics
- 6.3.4 Operating Footprint & Infrastructure Map
- 6.3.5 Planned Operational & Capacity Expansion
- 6.4 Australia Reusable Water Bottles Competitive Benchmarking Matrix
- 6.4.1 Revenue, Growth, Profitability & Operating Metric Comparison
- 6.4.2 Channel Revenue Mix
- 6.4.3 Revenue Exposure Across Domestic Markets
- 6.4.4 R&D Intensity
- 6.4.5 Sustainability Maturity
- 6.5 Strategic Developments in Australia Reusable Water Bottles (Last 24 Months)
- 6.5.1 Mergers, Acquisitions & Divestments
- 6.5.2 New Products, Services & Solutions in Australia Reusable Water Bottles
- 6.5.3 Operational & Infrastructure Expansions
- 6.5.4 Strategic Alliances, Joint Ventures & Partnerships
- 6.5.5 Distribution Expansion & Market Entry
- 6.5.6 Sustainability & ESG Initiatives
- 6.6 Competitive Strategy Mapping
- 6.6.1 Leader, Challenger, Follower & Niche Classification
- 6.6.2 Pricing Strategy Comparison
- 6.6.3 Channel Strategy Matrix
Note: Strategic developments are included based on their materiality and the availability of reliable information.
Chapter 7. Australia Reusable Water Bottles – By Sales & Delivery Channel
- 7.1 Segment Overview
- 7.1.1 Volume & Revenue Split by Channel (2023 & 2032) (Volume Where Applicable)
- 7.1.2 Channel Mix Evolution (2023-2032)
Chapter 8. Subnational Market Analysis – Country Overview
- 8.1 Domestic Geographic Market Overview
- 8.1.1 Subnational Volume Share (Where Applicable)
- 8.1.2 Subnational Revenue Share
- 8.1.3 Market Volume by Subnational Area (Where Applicable)
- 8.1.4 Market Revenue by Subnational Area
- 8.1.5 Subnational Forecasts Through 2032
- 8.2 Cross-Area Segment Analysis Within the Country
- 8.2.1 By Sales & Delivery Channel
- 8.2.2 By Competitive Positioning & Price Tier
Chapter 9. Australia Reusable Water Bottles – Priority Domestic Market 1
Chapter 10. Australia Reusable Water Bottles – Priority Domestic Market 2
Chapter 11. Australia Reusable Water Bottles – Priority Domestic Market 3
Chapter 12. Australia Reusable Water Bottles – Priority Domestic Market 4
Chapter 13. Australia Reusable Water Bottles Company Profiles
- 13.1 [Company 01]
- 13.1.1 Company Overview
- 13.1.2 Key Management Personnel
- 13.1.3 Products & Services Portfolio
- 13.1.4 Financial Performance
- 13.1.5 Domestic Market Focus & Local Operating Presence
- 13.1.6 Recent Developments & Strategic Initiatives
Note: The company profile list is preliminary and may change based on research findings, market developments, data availability, and client requirements.
Chapter 14. Appendices
- Appendix A – List of Abbreviations & Acronyms
- Appendix B – Industry Classification Code Reference – Full Series
- Appendix C – Supply, Output & Operating Capacity Data Tables
- Appendix D – End-Use & Demand Base Tables
- Appendix E – Demand, Adoption & Usage Assumptions
- Appendix F – Pricing & Revenue Metric Reference Tables
- Appendix G – Company Operations & Infrastructure Database
- Appendix H – Cross-Border Trade & Activity Data Tables (Where Applicable)
- Appendix I – Regulatory Summary Tables
- Appendix J – Primary Research Participant List (Anonymized)
- Appendix K – Primary Research Questionnaire Framework
- Appendix L – Data Sources & Bibliography
- Appendix M – Market Size Divergence & Source Comparison
Chapter 15. Research Methodology
- 15.1 Research Framework & Philosophy
- 15.2 Secondary Research – Sources, Hierarchy & Data Extraction
- 15.3 Data Modeling – National Market Sizing & Subnational Allocation
- 15.4 Primary Research – Stakeholder Framework, LOI & Sample Sizes
- 15.5 Forecast Methodology – Regression, Scenario & Sensitivity Analysis
- 15.6 Quality Control – Four-Layer Validation Framework
- 15.7 Limitations & Standard Assumptions
- 15.8 Disclaimer
