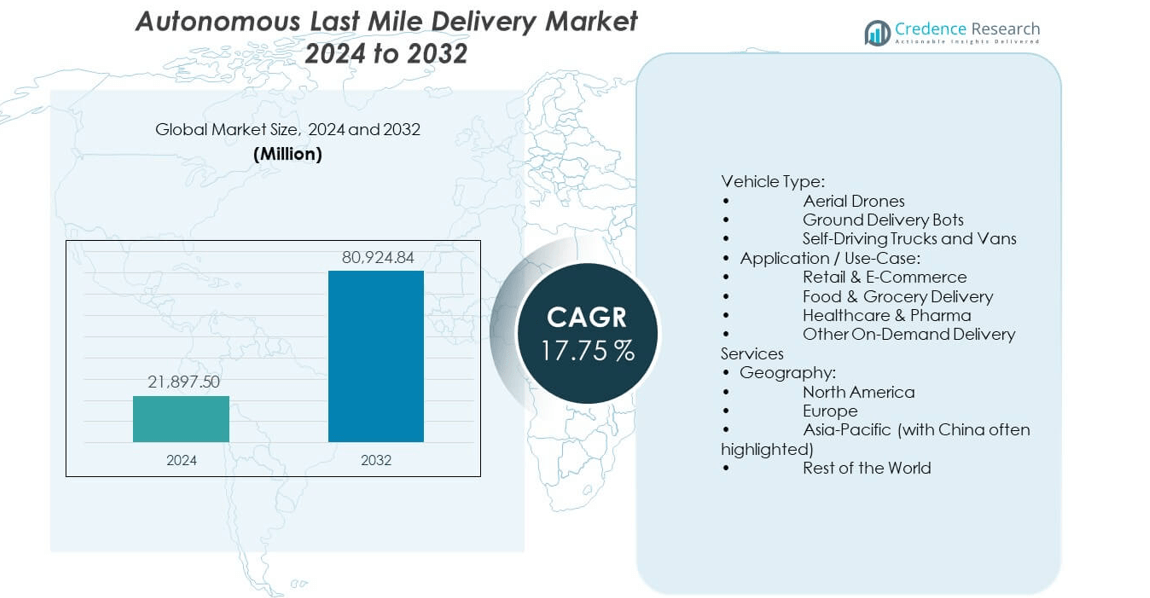
Home » Automotive & Transportation » Autonomous Last Mile Delivery Market

Autonomous Last Mile Delivery Market By Type, By Application, By Range -Growth, Future Prospects & Competitive Analysis, 2016 – 2030

Price: $4999

Published: | Report ID: 19851 | Report Format : PDF

Key Highlights of the Report

  • We expect the autonomous last-mile delivery market to reach a revenue of USD 5,471.32 million by 2030. The compound annual growth rate is expected to be 22.22 percent from 2023 to 2030.
  • In 2022, the short-range segment seemed to dominate the market. It accounted for more than 80 percent of the revenue share.
  • Ground delivery vehicles held the largest market share in 2022. They comprised more than 70 percent of the market.
  • The food delivery segment accounted for over 65 percent of the market share in 2022.
  • North America was the leading market in 2022. It captured over 45 percent of the overall market share.

Autonomous Last Mile Delivery Market

Executive Summary

Our exhaustive research on the autonomous last-mile delivery market revealed that the market has been witnessing steady growth in the last few years due to several factors. The demand for efficient and sustainable delivery solutions has intensified because of the increasing e-commerce activities. What is more, is that labor shortages have led to the need for automation in the last-mile delivery process.

A few hiccups that the market currently faces are regulatory and legal challenges, along with a few technical limitations. That said, technological advancements, collaboration and partnerships, and urbanization present promising opportunities to expand the market.

Market Insights

The autonomous last-mile delivery market caters to using autonomous vehicles and drones for delivering goods and packages to customers. Thanks to the rapid growth of e-commerce and the rising need for efficient delivery solutions, this market has gained traction in the last few years.

Autonomous last-mile delivery offers advantages like shortened delivery time, better cost-efficiency, and a fulfilling customer experience.

Design Element 2

Access crucial information at unmatched prices!

Request your free sample report today & start making informed decisions powered by Credence Research!

Download Free Sample
CTA Design Element 3

Current Market Trends in the Autonomous Last Mile Delivery Market

As per our research, the autonomous last-mile delivery market has enjoyed great growth when we talk about the last couple of years. Increasing demand for efficient and cost-effective delivery solutions drives the market.

With the rise of e-commerce and the need for faster delivery times, companies are turning to autonomous vehicles and drones to optimize their last-mile operations. This article will explore some of the current market trends shaping the autonomous last-mile delivery industry.

Artificial intelligence and machine learning technologies are important in producing autonomous last-mile delivery systems. These technologies enable vehicles and drones to not only navigate complex environments but also make real-time decisions.

They also allow the market products to adapt to changing road and traffic conditions. AI-powered systems can enhance efficiency and safety in last-mile deliveries better when they continuously learn from their surroundings.

Drone technology is revolutionizing last-mile delivery by enabling companies to bypass road traffic and deliver packages directly to customers’ doorsteps. Major players in the industry, like Amazon and Google’s Wing, are actively investing in drone delivery capabilities.

Drones offer the advantage of quick and flexible deliveries, especially in congested urban areas. Regulatory frameworks for drone operations are also evolving to accommodate the growing demand for autonomous aerial deliveries.

The world is ever so compelled and driven toward sustainability and reducing carbon emissions. For this reason, the adoption of electric and hybrid delivery vehicles is on the rise like never before.

Autonomous electric vehicles offer environmental benefits and lower operating costs when compared to traditional combustion engine vehicles. Companies like Tesla, Rivian, and Nuro are leading the way in developing autonomous EVs that are designed especially for last-mile deliveries.

Collaboration among industry players, including technology companies, logistics providers, and retailers, is becoming more prevalent in the autonomous last-mile delivery market.

These partnerships allow companies to leverage each other’s expertise and resources, accelerating the development and deployment of autonomous delivery solutions.

Take FedEx’s partnership with Walmart and Pizza Hut as an example. They joined hands to test autonomous delivery vehicles. On the other hand, Waymo collaborated with UPS for autonomous trucking trials.

Safety remains a top priority in the autonomous last-mile delivery market. As autonomous vehicles and drones operate in public spaces, there is a need to ensure the safety of pedestrians, cyclists, and other road users.

Regulatory bodies are working to establish guidelines and standards for the safe operation of autonomous delivery systems. Companies in the market are actively investing in advanced sensor technologies, including LiDAR and radar, to enhance safety and meet regulatory requirements.

As per our encompassing research, the autonomous last-mile delivery market is witnessing increased competition, with both established players and startups entering the space.

Companies like Amazon, Uber, and DHL are expanding their autonomous delivery operations, while startups like Starship Technologies and Nuro are gaining traction with their innovative solutions. Market consolidation is also taking place, with larger companies acquiring smaller ones to strengthen their capabilities and market presence.

Key Players and Competitive Landscape in the Autonomous Last Mile Delivery Market

Amazon: Amazon is at the forefront of autonomous last-mile delivery, and rightly so, as it is a dominant player in the e-commerce industry. The company has not only invested heavily in its Prime Air drone delivery program but is actively working on developing autonomous delivery vehicles as well.

Amazon’s acquisition of companies like Zoox and its partnership with Rivian clearly show its aim to shape the future of autonomous last-mile delivery.

Google’s Wing: Wing, a subsidiary of Alphabet (Google’s parent company), is heavily focused on developing and commercializing autonomous drone delivery technology.

Wing has successfully conducted numerous trials and received regulatory approval for its drone delivery services in several regions. The company is expanding its global operations and collaborating with local businesses and regulators to pave the way for efficient and safe drone deliveries.

Tesla: Known for its electric vehicles, Tesla is also exploring autonomous last-mile delivery solutions. The company’s electric trucks, like the Tesla Semi, have the potential to be integrated with autonomous driving capabilities, offering sustainable and efficient delivery options. Tesla’s expertise in battery technology and EV manufacturing gives it an advantage in the market.

Nuro: Nuro is a startup but is way ahead of many experienced organizations within the industry when it comes to developing autonomous delivery vehicles specifically designed for last-mile logistics.

The company’s compact, low-speed vehicles are designed to operate in urban environments and carry goods efficiently. Nuro partners with major retailers and has secured regulatory approvals for autonomous deliveries in certain locations.

Market Overview

The market is segmented based on range, vehicle type, and end-use industry. In terms of range, the short-range segment dominated the market in 2022, accounting for more than 80 percent of the revenue share.

Short-range autonomous delivery vehicles are majorly designed for urban and suburban areas as the delivery distance is short. On the contrary, long-range autonomous delivery vehicles are suitable for rural and intercity deliveries.

In 2022, ground delivery vehicles captured the largest market share, contributing over 70 percent. These vehicles include autonomous vans, trucks, and robots that operate on roads and sidewalks. They are widely used for packaging, food, and grocery deliveries.

Other autonomous vehicles, like aerial drones and robots, are also gaining popularity, especially for deliveries in remote or congested areas.

The food delivery segment accounted for over 65 percent of the market share in 2022. The rapid growth of online food delivery platforms, coupled with the increasing demand for quick and convenient food delivery services, has contributed to the dominance of this segment.

The healthcare and retail sectors are adopting autonomous last-mile delivery solutions to streamline their supply chain operations.

Autonomous Last Mile Delivery Market

Market Drivers

Increasing E-commerce Activities

The considerable growth of e-commerce has greatly fueled the demand for solutions that autonomous last-mile delivery market provides. When the number of e-commerce customers shopping online is on the rise, the need for efficient and timely delivery of products rises as well. Autonomous vehicles and drones offer different companies the potential to enhance delivery speed, reduce costs, and improve customer satisfaction.

Labor Shortages

For logistics companies, the exhausted availability of delivery personnel is an issue that is quite pressing. What autonomous last-mile delivery does is that it straightens this hiccup by reducing reliance on human labor. Companies can overcome labor shortages and ensure consistent and reliable delivery services by automating the delivery process.

Need for Efficient and Sustainable Delivery Solutions

The world is ever so concious about the environment and environmental concerns and the need for sustainable transportation have been raising their heads within the past couple of years. This is a major cause of organizations opting for autonomous last-mile delivery. These solutions can help reduce not only carbon emissions and congestion, but fuel consumption as well.

Market Restraints

Regulatory and Legal Challenges

Regulatory and legal challenges are two matters that have been worrying the players in this market. Safety, liability, privacy, and airspace management regulations vary across different regions. Unclear or restrictive regulations can hinder market growth and slow the adoption of autonomous delivery solutions.

Technical Limitations

Our research showed that there are some technical limitations still hinder the growth of the discussed industry. This is so despite the significant advancements in autonomous vehicle technology. These hinderances include navigation in complex urban environments, obstacle detection and avoidance, adverse weather conditions, and managing interactions with pedestrians and other vehicles.

Market Opportunities

Technological Advancements

There are certain advancements in autonomous vehicle technology that act as a push for the market. A few that are worth mentioning are artificial intelligence, machine learning, and sensor technology. These advancements allow vehicles to intake urban environments better, resulting in an improvement in their decision-making capacity. They also improve their general and overall performance as well as safety. There are some development efforts and research that are ongoing and are expected to drive innovation and open new possibilities in the autonomous last-mile delivery market.

Collaboration and Partnerships

There are certain things that can intensify the adoption of autonomous last-mile delivery solutions. These things include collaboration among stakeholders, including logistics companies, technology providers, and regulatory bodies. What collaborative initiatives can do for the industry is incite knowledge sharing, address regulatory challenges, and promote interoperability. Partnerships between e-commerce platforms and autonomous delivery providers can also be pretty helpful as it can straighten out the delivery processes and improve customer experience.

Urbanization and Population Growth

The ongoing global urbanization trend and population growth offer unprecedented market opportunities. The demand for efficient last-mile delivery services is directly proportional to the growing urban population. Autonomous delivery solutions can navigate dense urban environments and offer timely and reliable deliveries, catering to the needs of urban dwellers.

Shape Your Report to Specific Countries or Regions & Enjoy 30% Off!

Why Buy This Report

This report offers an exhaustive analysis of the autonomous last-mile delivery market. It discusses key opportunities, restraints, drivers, and trends within the discussed industry. It offers valuable insights not only into the current market scenario but future growth prospects as well. Thus, this report helps its readers and businesses make informed decisions.

The report presents the projected market size and revenue forecast for the autonomous last-mile delivery market until 2030. This information helps organizations understand the market’s potential and devise effective strategies to cash on emerging opportunities.

The report presents an overview of the market based on different segments, like range, vehicle type, and end-use industry, to provide an easy but comprehensive understanding of each segment’s market dynamics and trends. This segmentation helps businesses identify target investment areas and customize their offerings to satisfy their customers.

The report offers a detailed analysis of the competitive landscape of the autonomous last-mile delivery market, highlighting the key players and their strategies. This information helps organizations benchmark their performance against industry leaders and identify potential partnerships or collaborations to enhance their market presence.

The report covers the latest technological advancements in the autonomous last-mile delivery market, including integrating artificial intelligence, expanding drone delivery services, and developing electric and hybrid delivery vehicles. Understanding these advancements enables businesses to stay ahead of the competition and leverage innovative solutions.

The report discusses the regulatory and legal challenges associated with autonomous last-mile delivery and their impact on market growth. This insight helps organizations navigate the regulatory landscape and ensure compliance while developing and deploying autonomous delivery solutions.

The report identifies key market opportunities like technological advancements, collaborations and partnerships, urbanization, and population growth. By understanding these opportunities, businesses can strategize and capitalize on emerging trends to gain a competitive edge.

CHAPTER NO. 1: Introduction 15

1.1. Report Description 15

1.1.1. Purpose of the Report 15

1.1.2. USP & Key Offerings 15

1.2. Key Benefits for Stakeholders 15

1.3. Target Audience 16

1.4. Report Scope 16


CHAPTER NO. 2: Executive Summary 20

2.1. Autonomous Last Mile Delivery Market Snapshot 20

2.2. Global Autonomous Last Mile Delivery Market, 2017 – 2030 (USD Million) 22

2.3. Insights from Primary Respondents 22


CHAPTER NO. 3: COVID-19 IMPACT ANALYSIS 23

3.1. Impact Assessment of COVID-19 Pandemic, By Region 23


CHAPTER NO. 4: Autonomous Last Mile Delivery Market – Industry Analysis 24

4.1. Introduction 24

4.2. Market Drivers 25

4.2.1. Increasing E-commerce Activities 25

4.2.2. Need for Efficient and Sustainable Delivery Solutions 26

4.3. Market Restraints 26

4.3.1. Restraining Factor Analysis 26

4.4. Market Opportunities 27

4.4.1. Market Opportunity Analysis 27

4.5. Porter’s Five Forces Analysis 27

4.6. Value Chain Analysis 28


CHAPTER NO. 5: Key Investment Pockets Analysis 29

5.1. Top Investment Pockets 29

5.1.1.1. Autonomous Last Mile Delivery Market Attractiveness Analysis, By Type 29

5.1.1.2. Autonomous Last Mile Delivery Market Attractiveness Analysis, By Application 29

5.1.1.3. Autonomous Last Mile Delivery Market Attractiveness Analysis, By Range 30

5.2. Product Life Cycle Analysis 31

5.3. Incremental Revenue Growth Opportunity, 2023 – 2030 32

5.3.1. Type 32

5.3.2. Application 32

5.3.3. Range 33


CHAPTER NO. 6: Market Positioning of Key Players 33

6.1. Company Market Share Analysis –2020 and 2022 33

6.1.1. Global Autonomous Last Mile Delivery Market: Company Market Share, 2022 33

6.1.2. Global Autonomous Last Mile Delivery Market: Company Market Share, 2022 34

6.1.3. Global Autonomous Last Mile Delivery Market Company Volume Market Share, 2022 34

6.2. Global Autonomous Last Mile Delivery Market Company Revenue Market Share, 2022 36

6.3. Market Position of Key Players 2022 37

6.3.1. Market Position of Key Players, 2022 37

6.4. Strategic Development 38

6.4.1. Acquisitions & Mergers 38

6.4.2. New Product Launch 38

6.4.3. Regional Expansion 38


CHAPTER NO. 7: Autonomous Last Mile Delivery Market – By Type Segment Analysis 39

7.1. Autonomous Last Mile Delivery Market Overview by Type Segment 39

7.1.1. Global Autonomous Last Mile Delivery Market Revenue Share, By Type, 2022 & 2030 40

7.2. Ground Delivery Robots 41

7.2.1. Global Ground Delivery Robots Autonomous Last Mile Delivery Market Revenue, By Region, 2017 – 2022 (USD Million) 41

7.3. Aerial Delivery Drones 42

7.3.1. Global Ground Delivery Robots Autonomous Last Mile Delivery Market Revenue, By Region, 2017 – 2022 (USD Million) 42

7.4. Self-driving Vans 43

7.4.1. Global Self-driving Vans Autonomous Last Mile Delivery Market Revenue, By Region, 2017 – 2022 (USD Million) 43

7.5. Autonomous Bicycles and Scooters 44

7.5.1. Global Autonomous Bicycles and Scooters Autonomous Last Mile Delivery Market Revenue, By Region, 2017 – 2022 (USD Million) 44

7.6. Others 45

7.6.1. Global Others Autonomous Last Mile Delivery Market Revenue, By Region, 2017 – 2022 (USD Million) 45


CHAPTER NO. 8: Autonomous Last Mile Delivery Market – By Application Segment Analysis 46

8.1. Autonomous Last Mile Delivery Market Overview by Application Segment 46

8.1.1. Global Autonomous Last Mile Delivery Market Revenue Share, By Application, 2022 & 2030 47

8.2. E-commerce 48

8.2.1. Global Autonomous Last Mile Delivery for E-commerce Market Revenue, By Region, 2017 – 2022 (USD Million) 48

8.3. Retail 49

8.3.1. Global Autonomous Last Mile Delivery for Retail Market Revenue, By Region, 2017 – 2022 (USD Million) 49

8.4. Healthcare 50

8.4.1. Global Autonomous Last Mile Delivery for Healthcare Market Revenue, By Region, 2017 – 2022 (USD Million) 50

8.5. Food Delivery 51

8.5.1. Global Autonomous Last Mile Delivery for Food Delivery Market Revenue, By Region, 2017 – 2022 (USD Million) 51

8.6. Postal and Logistics 52

8.6.1. Global Autonomous Last Mile Delivery for Postal and Logistics Market Revenue, By Region, 2017 – 2022 (USD Million) 52


CHAPTER NO. 9: Autonomous Last Mile Delivery Market – By Range Segment Analysis 53

9.1. Autonomous Last Mile Delivery Market Overview by Range Segment 53

9.1.1. Global Autonomous Last Mile Delivery Market Revenue Share, By Range, 2022 & 2030 54

9.2. Short Range 55

9.2.1. Global Short Range Autonomous Last Mile Delivery Market Revenue, By Region, 2017 – 2022 (USD Million) 55

9.3. Long Range 56

9.3.1. Global Long Range Autonomous Last Mile Delivery Market Revenue, By Region, 2017 – 2022 (USD Million) 56


CHAPTER NO. 10: Autonomous Last Mile Delivery Market – Regional Analysis 60

10.1. Autonomous Last Mile Delivery Market Overview by Region Segment 60

10.1.1. Global Autonomous Last Mile Delivery Market Revenue Share, By Region, 2022 & 2030 61

10.1.2. Global Autonomous Last Mile Delivery Market Revenue, By Region, 2017 – 2022 (USD Million) 62

10.1.3. Global Autonomous Last Mile Delivery Market Revenue, By Type, 2017 – 2022 (USD Million) 63

10.1.4. Global Autonomous Last Mile Delivery Market Revenue, By Application, 2017 – 2022 (USD Million) 64

10.1.5. Global Autonomous Last Mile Delivery Market Revenue, By Range, 2017 – 2022 (USD Million) 65

10.1.6. Global Autonomous Last Mile Delivery Market Revenue, By Technology, 2017 – 2022 (USD Million) 66

10.2. North America 67

10.2.1. North America Autonomous Last Mile Delivery Market Revenue, By Country, 2017 – 2022 (USD Million) 68

10.2.2. North America Autonomous Last Mile Delivery Market Revenue, By Type, 2017 – 2022 (USD Million) 69

10.2.3. North America Autonomous Last Mile Delivery Market Revenue, By Application, 2017 – 2022 (USD Million) 70

10.2.4. North America Autonomous Last Mile Delivery Market Revenue, By Range, 2017 – 2022 (USD Million) 71

10.2.5. U.S. 72

10.2.6. Canada 72

10.2.7. Mexico 72

10.3. Europe 73

10.3.1. Europe Autonomous Last Mile Delivery Market Revenue, By Country, 2017 – 2022 (USD Million) 74

10.3.2. Europe Autonomous Last Mile Delivery Market Revenue, By Type, 2017 – 2022 (USD Million) 75

10.3.3. Europe Autonomous Last Mile Delivery Market Revenue, By Application, 2017 – 2022 (USD Million) 76

10.3.4. Europe Autonomous Last Mile Delivery Market Revenue, By Range, 2017 – 2022 (USD Million) 77

10.3.5. UK 78

10.3.6. France 78

10.3.7. Germany 78

10.3.8. Italy 78

10.3.9. Spain 78

10.3.10. Russia 78

10.3.11. BENELUX 78

10.3.12. Sweden 78

10.3.13. Denmark 78

10.3.14. Poland 78

10.3.15. Austria 78

10.3.16. Rest of Europe, 78

10.4. Asia Pacific 79

10.4.1. Asia Pacific Autonomous Last Mile Delivery Market Revenue, By Country, 2017 – 2022 (USD Million) 80

10.4.2. Asia Pacific Autonomous Last Mile Delivery Market Revenue, By Type, 2017 – 2022 (USD Million) 81

10.4.3. Asia Pacific Autonomous Last Mile Delivery Market Revenue, By Application, 2017 – 2022 (USD Million) 82

10.4.4. Asia Pacific Autonomous Last Mile Delivery Market Revenue, By Range, 2017 – 2022 (USD Million) 83

10.4.5. China 84

10.4.6. Japan 84

10.4.7. South Korea 84

10.4.8. India 84

10.4.9. Thailand 84

10.4.10. Indonesia 84

10.4.11. Vietnam 84

10.4.12. Malaysia 84

10.4.13. Philippines 84

10.4.14. Taiwan 84

10.4.15. Rest of Asia Pacific 84

10.5. Latin America 85

10.5.1. Latin America Autonomous Last Mile Delivery Market Revenue, By Country, 2017 – 2022 (USD Million) 86

10.5.2. Latin America Autonomous Last Mile Delivery Market Revenue, By Type, 2017 – 2022 (USD Million) 87

10.5.3. Latin America Autonomous Last Mile Delivery Market Revenue, By Application, 2017 – 2022 (USD Million) 88

10.5.4. Latin America Autonomous Last Mile Delivery Market Revenue, By Range, 2017 – 2022 (USD Million) 89

10.5.5. Brazil 90

10.5.6. Argentina 90

10.5.7. Colombia 90

10.5.8. Chile 90

10.5.9. Peru 90

10.5.10. Rest of Latin America 90

10.6. The Middle-East 91

10.6.1. Middle East Autonomous Last Mile Delivery Market Revenue, By Country, 2017 – 2022 (USD Million) 92

10.6.2. Middle East Autonomous Last Mile Delivery Market Revenue, By Type, 2017 – 2022 (USD Million) 93

10.6.3. Middle East Autonomous Last Mile Delivery Market Revenue, By Application, 2017 – 2022 (USD Million) 94

10.6.4. Middle East Autonomous Last Mile Delivery Market Revenue, By Range, 2017 – 2022 (USD Million) 95

10.6.5. GCC Countries 96

10.6.6. Israel 96

10.6.7. Turkey 96

10.6.8. Iran 96

10.6.9. Rest of Middle East & Africa 96

10.7. Africa 97

10.7.1. Africa Autonomous Last Mile Delivery Market Revenue, By Country, 2017 – 2022 (USD Million) 98

10.7.2. Africa Autonomous Last Mile Delivery Market Revenue, By Type, 2017 – 2022 (USD Million) 99

10.7.3. Africa Autonomous Last Mile Delivery Market Revenue, By Application, 2017 – 2022 (USD Million) 100

10.7.4. Africa Autonomous Last Mile Delivery Market Revenue, By Range, 2017 – 2022 (USD Million) 101

10.7.5. South Africa 102

10.7.6. Egypt 102

10.7.7. Nigeria 102

10.7.8. Algeria 102

10.7.9. Morocco 102

10.7.10. Rest of Africa 102


CHAPTER NO. 11: Company Profiles 103

11.1. Amazon.com, Inc. 103

11.1.1. Company Overview 103

11.1.2. Product Portfolio 103

11.1.3. Financial Overview 103

11.2. Alphabet Inc. (Google) 104

11.3. Uber Technologies, Inc. 104

11.4. FedEx Corporation 104

11.5. JD.com, Inc. 104

11.6. DHL International GmbH 104

11.7. UPS (United Parcel Service) Inc. 104

11.8. Nuro, Inc. 104

11.9. Starship Technologies 104

11.10. Kiwi Campus 104

11.11. Zipline 104

11.12. Wing (Alphabet Inc.) 104

11.13. Postmates Inc. 104

11.14. Instacart 104


CHAPTER NO. 12: Research Methodology 105

12.1. Research Methodology 105

12.2. Phase I – Secondary Research 106

12.3. Phase II – Data Modeling 106

12.3.1. Company Share Analysis Model 107

12.3.2. Revenue-Based Modeling 107

12.4. Phase III – Primary Research 108

12.5. Research Limitations 109

12.5.1. Assumptions 109


List of Figures

FIG NO. 1……….. Global Autonomous Last Mile Delivery Market Volume & Revenue, 2017 – 2030 (USD Million)……………………………………. 22

FIG NO. 2……….. Porter’s Five Forces Analysis for Global Autonomous Last Mile Delivery Market…………………………………………………………………. 27

FIG NO. 3……….. Value Chain Analysis for Global Autonomous Last Mile Delivery Market……………………………………………………………………………… 28

FIG NO. 4……….. Market Attractiveness Analysis, By Type………………………………. 29

FIG NO. 5……….. Market Attractiveness Analysis, By Application…………………….. 29

FIG NO. 6……….. Market Attractiveness Analysis, By Range…………………………….. 30

FIG NO. 7……….. Product Life Cycle Analysis………………………………………………….. 31

FIG NO. 8……….. Incremental Revenue Growth Opportunity by Type………………. 32

FIG NO. 9……….. Incremental Revenue Growth Opportunity by Application……… 32

FIG NO. 10……… Incremental Revenue Growth Opportunity by Range…………….. 33

FIG NO. 11……… Company Share Analysis, 2020……………………………………………. 33

FIG NO. 12……… Company Share Analysis, 2022……………………………………………. 34

FIG NO. 13……… Autonomous Last Mile Delivery Market – Company Volume Market Share, 2022……………………………………………………………. 34

FIG NO. 14……… Autonomous Last Mile Delivery Market – Company Revenue Market Share, 2022……………………………………………………………. 36

FIG NO. 15……… Market Position of Key Players, 2022…………………………………… 37

FIG NO. 16……… Global Autonomous Last Mile Delivery Market Revenue Share, By Type, 2022 & 2030…………………………………………………………….. 40

FIG NO. 17……… Global Autonomous Last Mile Delivery Market for Ground Delivery Robots, Volume & Revenue (USD Million) 2017 – 2030 41

FIG NO. 18……… Global Autonomous Last Mile Delivery Market for Aerial Delivery Drones, Volume & Revenue (USD Million) 2017 – 2030………….. 42

FIG NO. 19……… Global Autonomous Last Mile Delivery Market for Self-driving Vans, Volume & Revenue (USD Million) 2017 – 2030…………….. 43

FIG NO. 20……… Global Autonomous Last Mile Delivery Market for Autonomous Bicycles and Scooters, Volume & Revenue (USD Million) 2017 – 2030…………………………………………………………………………………. 44

FIG NO. 21……… Global Autonomous Last Mile Delivery Market for Others, Volume & Revenue (USD Million) 2017 – 2030……………………… 45

FIG NO. 22……… Global Autonomous Last Mile Delivery Market Revenue Share, By Application, 2022 & 2030……………………………………………………. 47

FIG NO. 23……… Global Autonomous Last Mile Delivery Market for E-commerce, Volume & Revenue (USD Million) 2017 – 2030……………………… 48

FIG NO. 24……… Global Autonomous Last Mile Delivery Market for Retail, Volume & Revenue (USD Million) 2017 – 2030………………………………….. 49

FIG NO. 25……… Global Autonomous Last Mile Delivery Market for Healthcare, Volume & Revenue (USD Million) 2017 – 2030……………………… 50

FIG NO. 26……… Global Autonomous Last Mile Delivery Market for Food Delivery, Volume & Revenue (USD Million) 2017 – 2030……………………… 51

FIG NO. 27……… Global Autonomous Last Mile Delivery Market for Postal and Logistics, Volume & Revenue (USD Million) 2017 – 2030………… 52

FIG NO. 28……… Global Autonomous Last Mile Delivery Market Revenue Share, By Range, 2022 & 2030…………………………………………………………… 54

FIG NO. 29……… Global Autonomous Last Mile Delivery Market for Short Range, Volume & Revenue (USD Million) 2017 – 2030……………………… 55

FIG NO. 30……… Global Autonomous Last Mile Delivery Market for Long Range, Volume & Revenue (USD Million) 2017 – 2030……………………… 56

FIG NO. 31……… Global Autonomous Last Mile Delivery Market for Range 3, Volume & Revenue (USD Million) 2017 – 2030……………………… 57

FIG NO. 32……… Global Autonomous Last Mile Delivery Market for Range 4, Volume & Revenue (USD Million) 2017 – 2030……………………… 58

FIG NO. 33……… Global Autonomous Last Mile Delivery Market for Range 5, Volume & Revenue (USD Million) 2017 – 2030……………………… 59

FIG NO. 34……… Global Autonomous Last Mile Delivery Market Revenue Share, By Region, 2022 & 2030………………………………………………………….. 61

FIG NO. 35……… North America Autonomous Last Mile Delivery Market Volume & Revenue, 2017 – 2022 (USD Million)……………………………………. 67

FIG NO. 36……… Europe Autonomous Last Mile Delivery Market Volume & Revenue, 2017 – 2022 (USD Million)……………………………………. 73

FIG NO. 37……… Asia Pacific Autonomous Last Mile Delivery Market Volume & Revenue, 2017 – 2022 (USD Million)……………………………………. 79

FIG NO. 38……… Latin America Autonomous Last Mile Delivery Market Volume & Revenue, 2017 – 2022 (USD Million)……………………………………. 85

FIG NO. 39……… The Middle-East Autonomous Last Mile Delivery Market Volume & Revenue, 2017 – 2022 (USD Million)…………………………………. 91

FIG NO. 40……… Africa Autonomous Last Mile Delivery Market Volume & Revenue, 2017 – 2022 (USD Million)……………………………………. 97

FIG NO. 41……… Research Methodology – Detailed View……………………………… 105

FIG NO. 42……… Research Methodology……………………………………………………. 106


List of Tables

TABLE NO. 1. :…. Global Autonomous Last Mile Delivery Market: Snapshot………. 20

TABLE NO. 2. :…. Drivers for the Autonomous Last Mile Delivery Market: Impact Analysis…………………………………………………………………………….. 25

TABLE NO. 3. :…. Restraints for the Autonomous Last Mile Delivery Market: Impact Analysis…………………………………………………………………………….. 26

TABLE NO. 4. :…. Global Ground Delivery Robots Autonomous Last Mile Delivery Market Revenue, By Region, 2017 – 2022 (USD Million)…………. 41

TABLE NO. 5. :…. Global Ground Delivery Robots Autonomous Last Mile Delivery Market Revenue, By Region, 2023– 2030 (USD Million)…………. 41

TABLE NO. 6. :…. Global Ground Delivery Robots Autonomous Last Mile Delivery Market Revenue, By Region, 2017 – 2022 (USD Million)…………. 42

TABLE NO. 7. :…. Global Ground Delivery Robots Autonomous Last Mile Delivery Market Revenue, By Region, 2023– 2030 (USD Million)…………. 42

TABLE NO. 8. :…. Global Self-driving Vans Autonomous Last Mile Delivery Market Revenue, By Region, 2017 – 2022 (USD Million)…………………….. 43

TABLE NO. 9. :…. Global Self-driving Vans Autonomous Last Mile Delivery Market Revenue, By Region, 2023– 2030 (USD Million)…………………….. 43

TABLE NO. 10. :.. Global Autonomous Bicycles and Scooters Autonomous Last Mile Delivery Market Revenue, By Region, 2017 – 2022 (USD Million) 44

TABLE NO. 11. :.. Global Autonomous Bicycles and Scooters Autonomous Last Mile Delivery Market Revenue, By Region, 2023– 2030 (USD Million) 44

TABLE NO. 12. :.. Global Others Autonomous Last Mile Delivery Market Revenue, By Region, 2017 – 2022 (USD Million)…………………………………… 45

TABLE NO. 13. :.. Global Others Autonomous Last Mile Delivery Market Revenue, By Region, 2023– 2030 (USD Million)…………………………………… 45

TABLE NO. 14. :.. Global Autonomous Last Mile Delivery for E-commerce Market Revenue, By Region, 2017 – 2022 (USD Million)…………………….. 48

TABLE NO. 15. :.. Global Autonomous Last Mile Delivery for E-commerce Market Revenue, By Region, 2023– 2030 (USD Million)…………………….. 48

TABLE NO. 16. :.. Global Autonomous Last Mile Delivery for Retail Market Revenue, By Region, 2017 – 2022 (USD Million)…………………….. 49

TABLE NO. 17. :.. Global Autonomous Last Mile Delivery for Retail Market Revenue, By Region, 2023– 2030 (USD Million)…………………….. 49

TABLE NO. 18. :.. Global Autonomous Last Mile Delivery for Healthcare Market Revenue, By Region, 2017 – 2022 (USD Million)…………………….. 50

TABLE NO. 19. :.. Global Autonomous Last Mile Delivery for Healthcare Market Revenue, By Region, 2023– 2030 (USD Million)…………………….. 50

TABLE NO. 20. :.. Global Autonomous Last Mile Delivery for Food Delivery Market Revenue, By Region, 2017 – 2022 (USD Million)…………………….. 51

TABLE NO. 21. :.. Global Autonomous Last Mile Delivery for Food Delivery Market Revenue, By Region, 2023– 2030 (USD Million)…………………….. 51

TABLE NO. 22. :.. Global Autonomous Last Mile Delivery for Postal and Logistics Market Revenue, By Region, 2017 – 2022 (USD Million)…………. 52

TABLE NO. 23. :.. Global Autonomous Last Mile Delivery for Postal and Logistics Market Revenue, By Region, 2023– 2030 (USD Million)…………. 52

TABLE NO. 24. :.. Global Short Range Autonomous Last Mile Delivery Market Revenue, By Region, 2017 – 2022 (USD Million)…………………….. 55

TABLE NO. 25. :.. Global Short Range Autonomous Last Mile Delivery Market Revenue, By Region, 2023– 2030 (USD Million)…………………….. 55

TABLE NO. 26. :.. Global Long Range Autonomous Last Mile Delivery Market Revenue, By Region, 2017 – 2022 (USD Million)…………………….. 56

TABLE NO. 27. :.. Global Long Range Autonomous Last Mile Delivery Market Revenue, By Region, 2023– 2030 (USD Million)…………………….. 56

TABLE NO. 28. :.. Global Range 3 Autonomous Last Mile Delivery Market Revenue, By Region, 2017 – 2022 (USD Million)…………………………………… 57

TABLE NO. 29. :.. Global Range 3 Autonomous Last Mile Delivery Market Revenue, By Region, 2023– 2030 (USD Million)…………………………………… 57

TABLE NO. 30. :.. Global Range 4 Autonomous Last Mile Delivery Market Revenue, By Region, 2017 – 2022 (USD Million)…………………………………… 58

TABLE NO. 31. :.. Global Range 4 Autonomous Last Mile Delivery Market Revenue, By Region, 2023– 2030 (USD Million)…………………………………… 58

TABLE NO. 32. :.. Global Range 5 Autonomous Last Mile Delivery Market Revenue, By Region, 2017 – 2022 (USD Million)…………………………………… 59

TABLE NO. 33. :.. Global Range 5 Autonomous Last Mile Delivery Market Revenue, By Region, 2023– 2030 (USD Million)…………………………………… 59

TABLE NO. 34. :.. Global Autonomous Last Mile Delivery Market Revenue, By Region, 2017 – 2022 (USD Million)……………………………………….. 62

TABLE NO. 35. :.. Global Autonomous Last Mile Delivery Market Revenue, By Region, 2023– 2030 (USD Million)……………………………………….. 62

TABLE NO. 36. :.. Global Autonomous Last Mile Delivery Market Revenue, By Type, 2017 – 2022 (USD Million)…………………………………………………… 63

TABLE NO. 37. :.. Global Autonomous Last Mile Delivery Market Revenue, By Type, 2023– 2030 (USD Million)…………………………………………………… 63

TABLE NO. 38. :.. Global Autonomous Last Mile Delivery Market Revenue, By Application, 2017 – 2022 (USD Million)…………………………………. 64

TABLE NO. 39. :.. Global Autonomous Last Mile Delivery Market Revenue, By Application, 2023– 2030 (USD Million)…………………………………. 64

TABLE NO. 40. :.. Global Autonomous Last Mile Delivery Market Revenue, By Range, 2017 – 2022 (USD Million)………………………………………… 65

TABLE NO. 41. :.. Global Autonomous Last Mile Delivery Market Revenue, By Range, 2023– 2030 (USD Million)………………………………………… 65

TABLE NO. 42. :.. Global Autonomous Last Mile Delivery Market Revenue, By Technology, 2017 – 2022 (USD Million)…………………………………. 66

TABLE NO. 43. :.. Global Autonomous Last Mile Delivery Market Revenue, By Technology, 2023– 2030 (USD Million)…………………………………. 66

TABLE NO. 44. :.. North America Autonomous Last Mile Delivery Market Revenue, By Country, 2017 – 2022 (USD Million)…………………………………. 68

TABLE NO. 45. :.. North America Autonomous Last Mile Delivery Market Revenue, By Country, 2023– 2030 (USD Million)………………………………….. 68

TABLE NO. 46. :.. North America Autonomous Last Mile Delivery Market Revenue, By Type, 2017 – 2022 (USD Million)………………………………………. 69

TABLE NO. 47. :.. North America Autonomous Last Mile Delivery Market Revenue, By Type, 2023– 2030 (USD Million)………………………………………. 69

TABLE NO. 48. :.. North America Autonomous Last Mile Delivery Market Revenue, By Application, 2017 – 2022 (USD Million)…………………………….. 70

TABLE NO. 49. :.. North America Autonomous Last Mile Delivery Market Revenue, By Application, 2023– 2030 (USD Million)…………………………….. 70

TABLE NO. 50. :.. North America Autonomous Last Mile Delivery Market Revenue, By Range, 2017 – 2022 (USD Million)……………………………………. 71

TABLE NO. 51. :.. North America Autonomous Last Mile Delivery Market Revenue, By Range, 2023– 2030 (USD Million)……………………………………. 71

TABLE NO. 52. :.. Europe Autonomous Last Mile Delivery Market Revenue, By Country, 2017 – 2022 (USD Million)……………………………………… 74

TABLE NO. 53. :.. Europe Autonomous Last Mile Delivery Market Revenue, By Country, 2023– 2030 (USD Million)……………………………………… 74

TABLE NO. 54. :.. Europe Autonomous Last Mile Delivery Market Revenue, By Type, 2017 – 2022 (USD Million)………………………………………….. 75

TABLE NO. 55. :.. Europe Autonomous Last Mile Delivery Market Revenue, By Type, 2023– 2030 (USD Million)…………………………………………… 75

TABLE NO. 56. :.. Europe Autonomous Last Mile Delivery Market Revenue, By Application, 2017 – 2022 (USD Million)…………………………………. 76

TABLE NO. 57. :.. Europe Autonomous Last Mile Delivery Market Revenue, By Application, 2023– 2030 (USD Million)…………………………………. 76

TABLE NO. 58. :.. Europe Autonomous Last Mile Delivery Market Revenue, By Range, 2017 – 2022 (USD Million)………………………………………… 77

TABLE NO. 59. :.. Europe Autonomous Last Mile Delivery Market Revenue, By Range, 2023– 2030 (USD Million)………………………………………… 77

TABLE NO. 60. :.. Asia Pacific Autonomous Last Mile Delivery Market Revenue, By Country, 2017 – 2022 (USD Million)……………………………………… 80

TABLE NO. 61. :.. Asia Pacific Autonomous Last Mile Delivery Market Revenue, By Country, 2023– 2030 (USD Million)……………………………………… 80

TABLE NO. 62. :.. Asia Pacific Autonomous Last Mile Delivery Market Revenue, By Type, 2017 – 2022 (USD Million)………………………………………….. 81

TABLE NO. 63. :.. Asia Pacific Autonomous Last Mile Delivery Market Revenue, By Type, 2023– 2030 (USD Million)…………………………………………… 81

TABLE NO. 64. :.. Asia Pacific Autonomous Last Mile Delivery Market Revenue, By Application, 2017 – 2022 (USD Million)…………………………………. 82

TABLE NO. 65. :.. Asia Pacific Autonomous Last Mile Delivery Market Revenue, By Application, 2023– 2030 (USD Million)…………………………………. 82

TABLE NO. 66. :.. Asia Pacific Autonomous Last Mile Delivery Market Revenue, By Range, 2017 – 2022 (USD Million)………………………………………… 83

TABLE NO. 67. :.. Asia Pacific Autonomous Last Mile Delivery Market Revenue, By Range, 2023– 2030 (USD Million)………………………………………… 83

TABLE NO. 68. :.. Latin America Autonomous Last Mile Delivery Market Revenue, By Country, 2017 – 2022 (USD Million)…………………………………. 86

TABLE NO. 69. :.. Latin America Autonomous Last Mile Delivery Market Revenue, By Country, 2023– 2030 (USD Million)………………………………….. 86

TABLE NO. 70. :.. Latin America Autonomous Last Mile Delivery Market Revenue, By Type, 2017 – 2022 (USD Million)………………………………………. 87

TABLE NO. 71. :.. Latin America Autonomous Last Mile Delivery Market Revenue, By Type, 2023– 2030 (USD Million)………………………………………. 87

TABLE NO. 72. :.. Latin America Autonomous Last Mile Delivery Market Revenue, By Application, 2017 – 2022 (USD Million)…………………………….. 88

TABLE NO. 73. :.. Latin America Autonomous Last Mile Delivery Market Revenue, By Application, 2023– 2030 (USD Million)…………………………….. 88

TABLE NO. 74. :.. Latin America Autonomous Last Mile Delivery Market Revenue, By Range, 2017 – 2022 (USD Million)……………………………………. 89

TABLE NO. 75. :.. Latin America Autonomous Last Mile Delivery Market Revenue, By Range, 2023– 2030 (USD Million)……………………………………. 89

TABLE NO. 76. :.. Middle East Autonomous Last Mile Delivery Market Revenue, By Country, 2017 – 2022 (USD Million)……………………………………… 92

TABLE NO. 77. :.. Middle East Autonomous Last Mile Delivery Market Revenue, By Country, 2023– 2030 (USD Million)……………………………………… 92

TABLE NO. 78. :.. Middle East Autonomous Last Mile Delivery Market Revenue, By Type, 2017 – 2022 (USD Million)………………………………………….. 93

TABLE NO. 79. :.. Middle East Autonomous Last Mile Delivery Market Revenue, By Type, 2023– 2030 (USD Million)…………………………………………… 93

TABLE NO. 80. :.. Middle East Autonomous Last Mile Delivery Market Revenue, By Application, 2017 – 2022 (USD Million)…………………………………. 94

TABLE NO. 81. :.. Middle East Autonomous Last Mile Delivery Market Revenue, By Application, 2023– 2030 (USD Million)…………………………………. 94

TABLE NO. 82. :.. Middle East Autonomous Last Mile Delivery Market Revenue, By Range, 2017 – 2022 (USD Million)………………………………………… 95

TABLE NO. 83. :.. Middle East Autonomous Last Mile Delivery Market Revenue, By Range, 2023– 2030 (USD Million)………………………………………… 95

TABLE NO. 84. :.. Africa Autonomous Last Mile Delivery Market Revenue, By Country, 2017 – 2022 (USD Million)……………………………………… 98

TABLE NO. 85. :.. Africa Autonomous Last Mile Delivery Market Revenue, By Country, 2023– 2030 (USD Million)……………………………………… 98

TABLE NO. 86. :.. Africa Autonomous Last Mile Delivery Market Revenue, By Type, 2017 – 2022 (USD Million)…………………………………………………… 99

TABLE NO. 87. :.. Africa Autonomous Last Mile Delivery Market Revenue, By Type, 2023– 2030 (USD Million)…………………………………………………… 99

TABLE NO. 88. :.. Africa Autonomous Last Mile Delivery Market Revenue, By Application, 2017 – 2022 (USD Million)……………………………….. 100

TABLE NO. 89. :.. Africa Autonomous Last Mile Delivery Market Revenue, By Application, 2023– 2030 (USD Million)……………………………….. 100

TABLE NO. 90. :.. Africa Autonomous Last Mile Delivery Market Revenue, By Range, 2017 – 2022 (USD Million)………………………………………. 101

TABLE NO. 91. :.. Africa Autonomous Last Mile Delivery Market Revenue, By Range, 2023– 2030 (USD Million)………………………………………. 101

What is the Autonomous Last Mile Delivery Market?

The Autonomous Last Mile Delivery Market relates to the industry that is involved in developing and deploying autonomous vehicles and drones. These drones and vehicles are produced for the specific purpose of delivering goods from point A to point B. This delivery usually covers a small distance and is the last leg of the delivery process

What are the benefits of autonomous last-mile delivery?

Autonomous last-mile delivery provides quite a few advantages to businesses as well as consumers. These benefits are inclusive of enhanced efficiency and cost savings as the labor expenses are waived off in this process and the accuracy and speed of delivery is also increased

What types of autonomous vehicles are used in the last-mile delivery market?

The last-mile delivery market utilizes different types of autonomous vehicles. These vehicles include autonomous ground vehicles (AGVs), autonomous drones, and robots. AGVs are designed for ground transportation, while drones are airborne devices capable of delivering packages to specific locations. Robots can be either ground-based or airborne, depending on the specific application.

What are the main challenges facing the autonomous last-mile delivery market?

Currently, there are a few hurdles that are affecting the smooth expansion of the industry. These include regulatory hurdles and legal frameworks, ensuring the safety of autonomous vehicles and pedestrians, navigating complex urban environments, handling unexpected scenarios, managing the logistics of autonomous fleets, and addressing public acceptance and trust in autonomous delivery systems.

Which industries are adopting autonomous last-mile delivery solutions?

The autonomous last-mile delivery market is being gleefully accepted and embraced across various industries. The industries that are welcoming the market are of all sizes and types. They include e-commerce, retail, logistics, food and beverage, healthcare, and postal services.

How does autonomous last-mile delivery impact job opportunities?

Adopting autonomous last-mile delivery may lead to a shift in job opportunities. While some traditional delivery jobs may be affected, new roles related to managing and maintaining autonomous vehicle fleets, software development, system integration, and customer support for autonomous delivery services will likely emerge, creating new employment opportunities.

Are autonomous last-mile delivery systems safe?

Safety is a top priority in developing autonomous last-mile delivery systems. Manufacturers and developers implement various safety measures, including advanced sensors, collision avoidance technologies, redundant systems, and comprehensive testing to ensure the safe operation of autonomous vehicles and drones. Regulatory bodies also play a crucial role in establishing safety standards for autonomous vehicles.

How are autonomous last-mile delivery systems regulated?

Regulation of autonomous last-mile delivery systems varies across countries and regions. Governments and regulatory bodies are working to establish guidelines and standards for autonomous vehicles and drones. These regulations cover safety, data privacy, vehicle certifications, and operating licenses. The regulatory landscape is evolving as the technology advances.

How does autonomous last-mile delivery impact the environment?

Autonomous last-mile delivery is a good news for the environment. The market paves way for the optimization of delivery routes, reduction of idle time, and utilization of electric vehicles. Autonomous systems also produce lower carbon emissions. They also decrease the environmental footprint of the delivery process.

What is the future outlook for the autonomous last-mile delivery market?

The autonomous last-mile delivery market, as per our research, is expected to grow significantly in the coming years. Rapid technological advancements, increased investments by major players, and rising consumer demand for faster and more efficient deliveries are driving the market’s growth. As regulatory frameworks continue to evolve, the market is likely to witness widespread adoption of autonomous delivery solutions across various industries, transforming the logistics and delivery sector.

Off-Highway Vehicle Engine Market

Published:
Report ID: 36969

Crane Market

Published:
Report ID: 36945

Automotive Rear-View Mirror Market

Published:
Report ID: 36709

Airless Tires Market

Published:
Report ID: 1175

Singapore Electric Vehicle (EV) Market

Published:
Report ID: 35964

Asia Pacific Automotive Infotainment Systems Market

Published:
Report ID: 35958

Peer-To-Peer Electric Vehicle Charging Market

Published:
Report ID: 9059

Japan Tire Market

Published:
Report ID: 32634

Automotive Steel Wheels Market

Published:
Report ID: 35559

Automotive Alloy Wheels Market

Published:
Report ID: 35549

Automotive Active Safety System Market

Published:
Report ID: 35497

Driving Apparel Market

Published:
Report ID: 35443

Purchase Options

$2999
Delivery Format: Excel.
$4999
Designed for the individual purchaser.
$6999
Users located at a single corporate site or regional office.
$7999
Allowed for unlimited sharing globally within one company.
Smallform of Sample request

Have a question?

User Profile

Don’t settle for less – trust Mitul to help you find the best solution.

Report delivery within 24 to 48 hours

– Other Info –

What people say?-

User Review

I am very impressed with the information in this report. The author clearly did their research when they came up with this product and it has already given me a lot of ideas.

Jana Schmidt
CEDAR CX Technologies

– Connect with us –

Phone

+91 6232 49 3207


support

24/7 Research Support


sales@credenceresearch.com

– Research Methodology –

Going beyond the basics: advanced techniques in research methodology

– Trusted By –

Pepshi, LG, Nestle
Motorola, Honeywell, Johnson and johnson
LG Chem, SIEMENS, Pfizer
Unilever, Samsonite, QIAGEN