
Bacterial Biopesticides Market
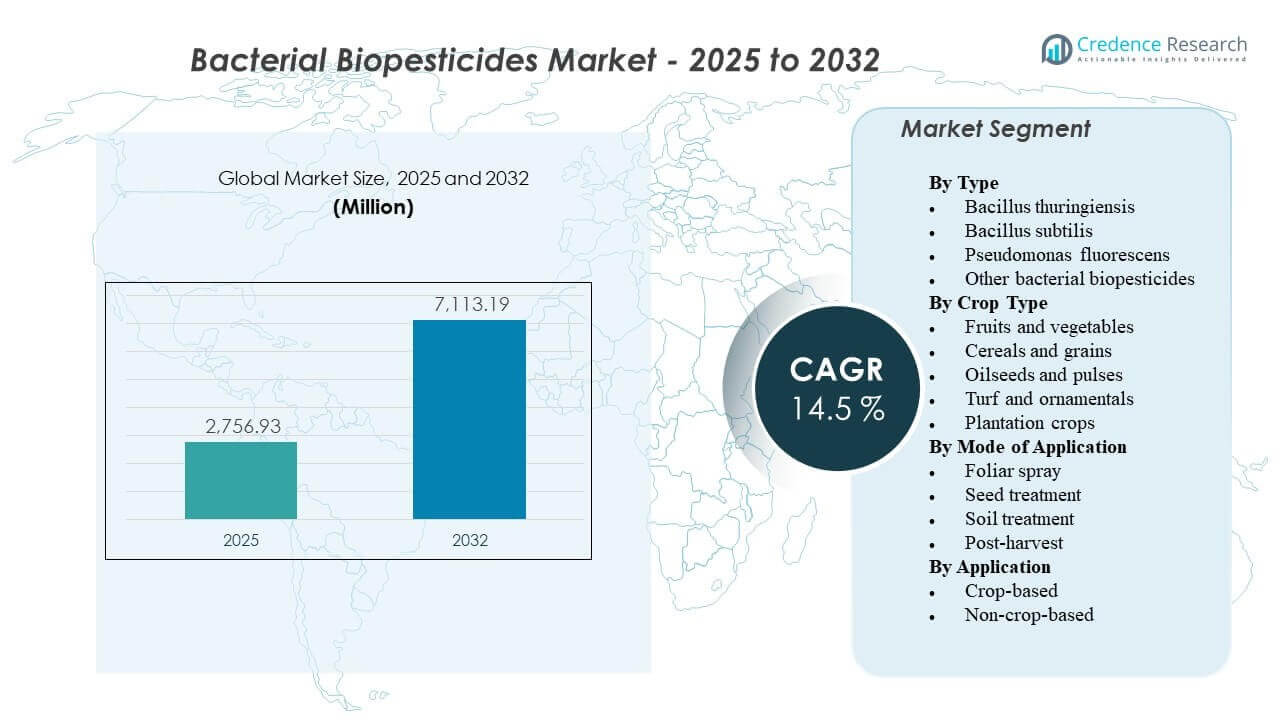
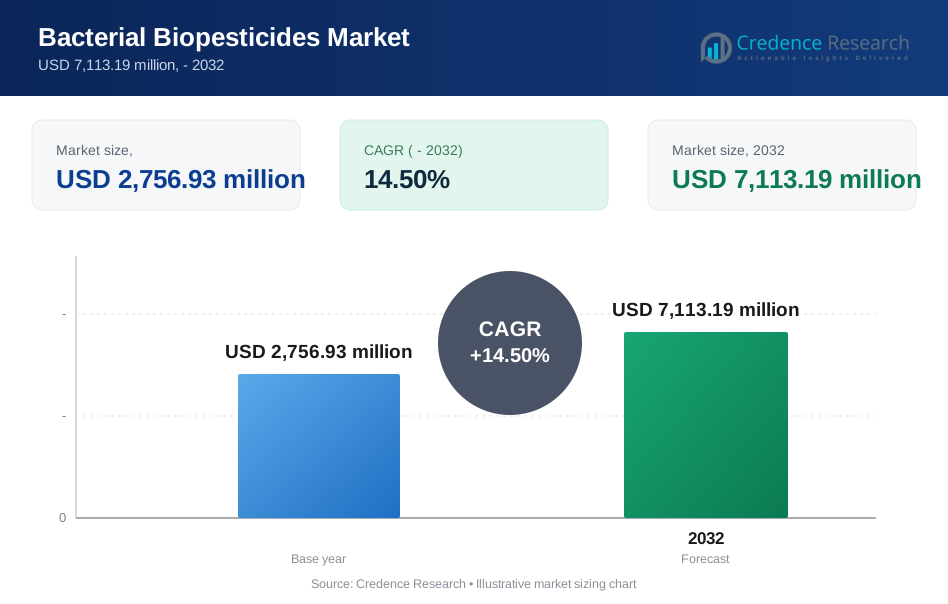
The global Bacterial Biopesticides Market size was estimated at USD 2,756.93 million in 2025 and is expected to reach USD 7,113.19 million by 2032, growing at a CAGR of 14.5% from 2025 to 2032. Demand is accelerating as growers and supply chains increase adoption of biological pest management to meet residue expectations, manage resistance risk, and strengthen integrated pest management programs. Expansion of organic and low-residue production systems is reinforcing product trials and repeat use across both high-value horticulture and select broadacre crops.
| REPORT ATTRIBUTE | DETAILS |
|---|---|
| Historical Period | 2020-2024 |
| Base Year | 2025 |
| Forecast Period | 2026-2032 |
| Bacterial Biopesticides Market Size 2025 | USD 2,756.93 million |
| Bacterial Biopesticides Market, CAGR | 14.5% |
| Bacterial Biopesticides Market Size 2032 | USD 7,113.19 million |
Key Market Trends & Insights
- Bacillus thuringiensis accounted for the largest share of 72.8% in 2025, supported by strong installed usage in insect control and label familiarity across key crops.
- Foliar spray led application modes with a 43.6% share in 2025, driven by compatibility with existing spray programs and in-season flexibility.
- Fruits and vegetables represented 36.9% of demand in 2025, reflecting residue sensitivity, export compliance, and higher value-per-hectare economics.
- Asia Pacific is positioned as the fastest-growing region with an estimated CAGR of 17.4% over 2026–2031, supported by expanding crop protection intensity and scaling distribution networks.
- North America held an estimated 36.8% revenue share in 2025, reflecting established biological adoption pathways and strong commercialization infrastructure.
Segment Analysis
Bacterial biopesticide adoption is strongly influenced by residue-sensitive supply chains and the broader shift toward biologically aligned farming practices. As organic agriculture continues to expand, demand rises for solutions that comply with certification needs and support stewardship goals. Residue scrutiny remains a key decision driver for growers and buyers, and research highlighting elevated pesticide contamination risks in agricultural soils further encourages the use of microbial-based options within integrated pest management programs.
Demand momentum is most visible in horticulture, where pest pressure, frequent harvests, and stringent buyer quality standards make residue management especially critical. Residue screening results in high-value crops such as strawberries underscore how closely these categories are monitored and why low-residue strategies matter. In response, bacterial solutions are increasingly used not only for pest control, but also to protect market access, stabilize crop quality, and support chemical rotation strategies where resistance management is a priority.
By Type Insights
Bacillus thuringiensis accounted for the largest share of 72.8% in 2025. Bacillus thuringiensis leadership is supported by its long-standing role in insect control programs and broad familiarity among growers and advisors. Bacillus thuringiensis products are commonly integrated into rotation strategies to reduce resistance pressure in target pests across multiple cropping systems. Commercial availability, formulation upgrades, and extensive label footprints strengthen repeat use and support large-scale adoption.
By Crop Type Insights
Fruits and vegetables accounted for the largest share of 36.9% in 2025. Fruits and vegetables demand is reinforced by high-value economics that allow greater tolerance for premium biological inputs when quality and market access benefits are clear. Residue compliance expectations and short pre-harvest intervals increase the attractiveness of bacterial solutions in intensive horticulture. High pest pressure and frequent scouting cycles also support repeat applications and integrated programs that combine biologicals with selective chemistries.
By Mode of Application Insights
Foliar spray accounted for the largest share of 43.6% in 2025. Foliar spray remains the primary mode because it aligns with existing farm equipment, scheduling practices, and advisory protocols. Foliar deployment enables rapid response to pest pressure and is easier to integrate into in-season rotation plans. Improvements in formulation stability and tank-mix guidance also support broader usage across geographies and crop calendars.
By Application Insights
Crop-based applications lead overall demand because the largest consumption volume is tied to field and protected cultivation where pest pressure directly affects yield and quality outcomes. Crop-based adoption is also driven by residue and export requirements in fruit and vegetable value chains and by resistance management priorities in broadacre crops. Non-crop-based use is expanding where municipalities, turf managers, and ornamental producers prioritize stewardship and regulatory alignment. Performance expectations and application discipline influence success in both settings, favoring suppliers with strong technical support and product education.
Bacterial Biopesticides Market Drivers
Increasing residue scrutiny and market-access requirements
Bacterial biopesticides adoption is rising as food value chains intensify residue monitoring and supplier compliance requirements. Many horticulture categories face frequent testing and retailer standards that favor low-residue production systems. Bacterial biopesticides provide alternatives that support integrated pest management without relying solely on conventional chemistries. This driver is strongest in export-focused supply chains where consistent compliance can directly affect pricing and contract continuity.
Resistance management needs across insect and disease control programs
Pest resistance pressure is pushing growers to diversify modes of action and rotate solutions more effectively. Bacterial biopesticides help reduce repeated use of the same chemical classes and can be used to fill rotation gaps in seasonal programs. Adoption improves when products are positioned as part of a full-season strategy rather than single-event interventions. Advisory engagement and on-farm demonstrations also improve confidence in performance consistency under variable pest pressure.
- For instance, in a two-year apple scab management trial, rotating Bacillus subtilis QST 713 (Serenade Opti, Bayer/BASF) with the SDHI fungicide benzovindiflupyr produced no statistically significant difference in disease incidence compared to full synthetic programs (P > 0.05), while entirely eliminating reliance on multisite fungicides such as captan and mancozeb.
Expansion of organic and biologically aligned farming practices
Growth in organic acreage and biologically oriented production approaches is expanding addressable demand for bacterial solutions. Many growers also adopt partial-transition strategies, using biologicals to reduce chemical load while maintaining performance targets. This driver is reinforced by consumer expectations around sustainability and by brand-led sourcing commitments. Product availability in multiple formulations and stronger distribution reach further accelerates adoption in both developed and emerging markets.
- For instance, Koppert Biological Systems, which has integrated bacterial and biological solutions across horticulture systems for over five decades, reports that pesticide and chemical agent use in tomato, cucumber, and sweet pepper cultivation has declined by between 50% and 90% in regions where biological programs replaced conventional inputs.
Product innovation in formulation, shelf-life, and application compatibility
Technical improvements in formulation stability, storage handling, and field persistence are improving real-world performance outcomes. Better compatibility with standard spray routines reduces operational friction and increases the likelihood of repeat purchases. Expanded labels and improved guidance on timing and coverage strengthen efficacy and customer satisfaction. Suppliers that combine product performance with strong agronomic support are capturing larger shares of commercial trials and renewals.
Bacterial Biopesticides Market Challenges
Bacterial biopesticides performance can vary with environmental conditions, application timing, and pest pressure intensity, creating confidence gaps when growers benchmark against chemical knockdown expectations. Shelf-life, storage temperature sensitivity, and distribution handling can still limit product reliability in hotter regions or fragmented supply chains. Efficacy perception issues often arise when products are applied outside recommended windows or without adequate coverage discipline. These factors increase the importance of training, technical support, and clear positioning within integrated programs.
Regulatory heterogeneity across countries and regions can extend time-to-market and increase compliance costs for microbial products. Registration timelines and label restrictions may limit rapid geographic scaling, especially for smaller suppliers. Pricing sensitivity remains a constraint in broadacre segments where input-cost decisions are strongly yield-driven. Competition from improved conventional chemistries and other biological categories can also pressure differentiation unless products are supported by field data and consistent service.
- For instance, Valent BioSciences markets XenTari with a three-protein Bacillus thuringiensis profile built around Cry1A, Cry1C, and Cry1D, and although the company says its biorational portfolio is sold in more than 95 countries, the product still requires country-level approvals such as Switzerland’s separate XenTari WG registration number W-6966, highlighting how global reach does not remove jurisdiction-by-jurisdiction regulatory friction.
Bacterial Biopesticides Market Trends and Opportunities
Bacterial biopesticides are increasingly being packaged and promoted as components of integrated crop solutions rather than standalone products. This trend favors suppliers that can bundle microbial insect control, microbial disease suppression, and plant health support into season-long programs. Channel partners are expanding advisory services around timing, compatibility, and resistance management to improve outcomes and reduce trial failure. As a result, product differentiation is shifting toward program design, technical stewardship, and measurable on-farm results.
- For instance, Bayer’s Serenade ASO has been used within program-based potato disease management, with 10 of 13 UK and European trials showing yield increases, an average gain of 1.9 t/ha across all 13 trials, and a 2018 Scotland trial showing nearly 50% lower black dot incidence when Emesto was applied at 1 kg/t and Serenade at 5 L/ha versus untreated plots.
Opportunity is expanding in seed treatment and early-stage crop protection where biological coatings and delivery systems improve convenience and consistency. Growth is also emerging in controlled-environment agriculture where pest pressure, rapid crop turns, and low-residue expectations align well with bacterial solutions. Digital agronomy platforms are improving decision-making around timing and scouting, supporting more reliable use patterns. Additional opportunity exists in expanding labeled crops and geographies through targeted registration strategies and localized field validation.
Regional Insights
North America
North America accounted for the largest share of 36.8% in 2025. North America demand is supported by established commercialization channels, frequent biological program adoption in residue-sensitive crops, and strong integration with advisory networks. The region also benefits from robust product support services that help growers optimize timing and application discipline. Adoption remains strongest where biologicals are embedded into resistance-management strategies and retailer-aligned quality programs.
Europe
Europe held an estimated 24.1% revenue share in 2025. Europe demand is supported by strong integrated pest management practices and policy emphasis on reducing reliance on conventional pesticides. Adoption is reinforced in high-value specialty crops where residue compliance and sustainability requirements are central to buyer expectations. Regulatory complexity can extend product approvals, increasing the value of suppliers with established registrations and strong distribution presence.
Asia Pacific
Asia Pacific represented an estimated 26.7% share in 2025 and is positioned as the fastest-growing region with a CAGR of 17.4% during 2026–2031. Growth is supported by expanding horticulture production, rising crop protection intensity, and growing interest in safer alternatives in both domestic and export supply chains. Distribution expansion and localized agronomic support are improving trial conversion rates. Adoption opportunities are increasing in both open-field and protected cultivation systems where pest pressure and residue expectations are high.
Latin America
Latin America accounted for an estimated 8.2% share in 2025. Adoption is supported by export-oriented crop systems that prioritize residue management and compliance with external buyer standards. Large-acreage farming creates scale opportunities, but penetration depends on cost competitiveness, logistics, and demonstrated field performance. Regional growth accelerates where registration clarity and technical support infrastructure are improving.
Middle East & Africa
Middle East & Africa held an estimated 4.2% share in 2025. Demand is supported by horticulture segments, especially where production is linked to export markets and premium domestic channels. Storage and handling constraints, climate conditions, and fragmented farm structures can limit rapid scaling without strong distribution and stewardship support. Opportunities improve as suppliers expand localized technical programs and improve formulation resilience.
Competitive Landscape
The Bacterial Biopesticides Market remains moderately consolidated, with established crop-protection companies and biological specialists competing on portfolio breadth, field performance consistency, regulatory coverage, and technical support depth. Competitive strategy increasingly emphasizes integrated programs, expanded labels across priority crops, and distribution partnerships that improve product reach. Differentiation is also influenced by formulation quality, shelf-life, and advisory enablement that improves trial-to-repeat conversion.
BASF SE is positioned to compete through a broader crop solutions approach that integrates biological and conventional offerings into end-to-end programs aligned with resistance management and residue goals. BASF SE strengths typically include strong regulatory experience, distribution scale, and investment capacity that supports portfolio expansion and localized validation. BASF SE strategy in biologicals increasingly focuses on pairing efficacy with agronomic guidance to improve consistency across conditions. BASF SE also benefits from global customer relationships that support adoption in large commercial operations.
The industry research and growth report includes detailed analyses of the competitive landscape of the market and information about key companies, including:
- BASF SE
- Bayer CropScience
- Syngenta AG
- Valent BioSciences LLC
- Koppert Biological Systems
- Novonesis
- Certis USA LLC
- Marrone Bio Innovations
Qualitative and quantitative analysis of companies has been conducted to help clients understand the wider business environment as well as the strengths and weaknesses of key industry players. Data is qualitatively analyzed to categorize companies as pure play, category-focused, industry-focused, and diversified; it is quantitatively analyzed to categorize companies as dominant, leading, strong, tentative, and weak.
Recent Developments
- In March 2025, CSIR-IIIM and HAPICO Industries signed an MoU on March 20 to jointly develop novel, sustainable biopesticides. The collaboration is intended to use CSIR-IIIM’s fermentation and microbial technology capabilities to create eco-friendly crop protection solutions and support HAPICO’s product pipeline.
- In January 2025, Simbiose announced the launch of Frontier Control on January 21 as a microbiocide recommended for ground application, and the product is identified in the source as based on Bacillus subtilis. The same update also highlighted Simbiose’s partnership with UEL as an important part of the commercialization and innovation effort behind the product.
- In August 2024, IPL Biologicals and Spain-based AFEPASA signed an agreement on August 26 to register and market IPL’s proprietary microbial biopesticides globally. The companies said the first product under this partnership would be IPL’s nematicide, with Europe as the starting market before broader international expansion.
Report Scope
| Report Attribute | Details |
| Market size value in 2025 | USD 2,756.93 million |
| Revenue forecast in 2032 | USD 7,113.19 million |
| Growth rate (CAGR) | 14.5% (2025–2032) |
| Base year | 2025 |
| Forecast period | 2026–2032 |
| Quantitative units | USD million |
| Segments covered | By Type Outlook: Bacillus thuringiensis, Bacillus subtilis, Pseudomonas fluorescens, Other bacterial biopesticides; By Crop Type Outlook: Fruits and vegetables, Cereals and grains, Oilseeds and pulses, Turf and ornamentals, Plantation crops; By Mode of Application Outlook: Foliar spray, Seed treatment, Soil treatment, Post-harvest; By Application Outlook: Crop-based, Non-crop-based |
| Regional scope | North America, Europe, Asia Pacific, Latin America, Middle East & Africa |
| Key companies profiled | BASF SE, Bayer CropScience, Syngenta AG, Valent BioSciences LLC, Koppert Biological Systems, Novonesis, Certis USA LLC, Marrone Bio Innovations |
| No. of Pages | 328 |
Segmentation
By Type
- Bacillus thuringiensis
- Bacillus subtilis
- Pseudomonas fluorescens
- Other bacterial biopesticides
By Crop Type
- Fruits and vegetables
- Cereals and grains
- Oilseeds and pulses
- Turf and ornamentals
- Plantation crops
By Mode of Application
- Foliar spray
- Seed treatment
- Soil treatment
- Post-harvest
By Application
- Crop-based
- Non-crop-based
By Region
- North America
- U.S.
- Canada
- Mexico
- Europe
- Germany
- France
- U.K.
- Italy
- Spain
- Rest of Europe
- Asia Pacific
- China
- Japan
- India
- South Korea
- South-east Asia
- Rest of Asia Pacific
- Latin America
- Brazil
- Argentina
- Rest of Latin America
- Middle East & Africa
- GCC Countries
- South Africa
- Rest of the Middle East and Africa
Request a Free Sample
Fill in your details and we'll send you a free sample report.
- Sample data tables & charts
- Research methodology
Need a Custom Version of This Report?
Tailor the scope, geography, or segments to your exact requirements.
- Custom geography or segment scope
- Direct access to our analyst team
Frequently Asked Questions
What is the market size of the Bacterial Biopesticides Market in 2025?
What is the forecast value of the Bacterial Biopesticides Market by 2032?
What is the CAGR for the Bacterial Biopesticides Market during 2025–2032?
Which segment leads the Bacterial Biopesticides Market by type?
Who are the major companies in the Bacterial Biopesticides Market?
Which region leads the Bacterial Biopesticides Market in 2025?
Table of Content
Chapter 1. Report Introduction
- 1.1 Report Description & Purpose
- 1.1.1 Report Title & Market Definition
- 1.1.2 Unique Selling Propositions (USP) & Key Differentiators
- 1.1.3 Value Proposition for Stakeholders
- 1.2 Research Objectives
- 1.2.1 Market Sizing Objectives (Volume & Revenue)
- 1.2.2 Segmentation Objectives
- 1.2.3 Competitive Intelligence Objectives
- 1.2.4 Forecast & Scenario Objectives
- 1.3 Report Scope
- 1.3.1 Bacterial Biopesticides Scope – Types & Subtypes Covered
- 1.3.2 Geographic Scope – Regions & Countries Covered
- 1.3.3 Historical Period, Base Year & Forecast Period (the historical period; forecast to 2032)
- 1.3.4 Inclusions & Exclusions
- 1.4 HS Code & Classification Framework
- 1.5 Currency, Units & Pricing Basis
- 1.6 Target Stakeholders
- 1.7 Limitations & Assumptions
Chapter 2. Executive Summary
- 2.1 Global Bacterial Biopesticides Market Snapshot
- 2.1.1 Market Size – Historical (the historical period) & Forecast (2032) (base year: USD 2,756.93 million → 2032: USD 7,113.19 million)
- 2.1.2 Volume & Revenue – Global Totals
- 2.1.3 Key Market Highlights – Top Five Facts
- 2.2 Bacterial Biopesticides Market Segmentation Snapshot
- 2.2.1 Market Split by Region – vs. 2032
- 2.3 Competitive Snapshot
- 2.3.1 Top 10 Players by Revenue Share –
- 2.3.2 Top 10 Players by Volume Share –
- 2.3.3 Recent Strategic Developments (18-Month Summary)
- 2.4 Key Investment Highlights & Strategic Conclusions
Chapter 3. Bacterial Biopesticides Market Dynamics & Industry Analysis
- 3.1 Market Overview & Context
- 3.1.1 Bacterial Biopesticides Market Position in the Broader Automotive Value Chain
- 3.1.2 OEM vs. Replacement Market Dynamics
- 3.1.3 Market Maturity & Development Stage by Region
- 3.2 Bacterial Biopesticides Market Drivers
- 3.3 Bacterial Biopesticides Market Restraints & Challenges
- 3.4 Bacterial Biopesticides Market Opportunities
- 3.5 Porter's Five Forces Analysis
- 3.5.1 Threat of New Entrants
- 3.5.2 Bargaining Power of Suppliers
- 3.5.3 Bargaining Power of Buyers
- 3.5.4 Threat of Substitutes
- 3.5.5 Competitive Rivalry – Intensity Assessment
- 3.6 Bacterial Biopesticides Value Chain Analysis
- 3.6.1 Upstream – Raw Material/Input Suppliers
- 3.6.1.1 Raw Material/Input 1
- 3.6.1.2 Raw Material/Input 2
- 3.6.1.3 Raw Material/Input 3
- 3.6.2 Midstream – Production/Manufacturing/Service Delivery
- 3.6.2.1 Production/Process Overview
- 3.6.2.2 Key Facility Locations & Capacity by Manufacturer
- 3.6.3 Downstream – Distribution & End Consumer
- 3.6.3.1 Primary Channel – B2B/OEM
- 3.6.3.2 Secondary Channels – Dealer, Retail, Online, Direct
- 3.6.4 Value Chain Profitability Analysis
- 3.6.1 Upstream – Raw Material/Input Suppliers
- 3.7 PESTEL Analysis
- 3.7.1 Political Factors
- 3.7.2 Economic Factors
- 3.7.3 Social Factors
- 3.7.4 Technological Factors
- 3.7.5 Environmental Factors
- 3.7.6 Legal Factors
- 3.8 Bacterial Biopesticides Supply Chain Analysis
- 3.8.1 Raw Material/Input Supply Risk Assessment
- 3.8.2 Manufacturing Concentration Risk (Geographic Exposure)
- 3.8.3 Trade Disruption Impact Analysis
- 3.9 Regulatory & Policy Landscape
Note: The regulatory and policy landscape section covers regulations based on their applicability to the market, Bacterial Biopesticides category, geography, and scope of the study. Only regulatory frameworks with a material impact on operations, compliance, trade, sustainability, or market access are analyzed in detail.
Chapter 4. Key Investment Pockets & Opportunity Analysis
- 4.1 Bacterial Biopesticides Market Attractiveness Analysis
- 4.1.1 By Region – Investment Attractiveness Matrix (Volume × CAGR)
- 4.2 Absolute Revenue Growth Opportunity
- 4.2.1 By Region – Absolute USD Growth Through 2032
- 4.3 Incremental Volume Opportunity
- 4.3.1 By Region – Incremental Volume Through 2032
- 4.3.2 Segment – Incremental Volume
- 4.4 Emerging Submarket Opportunity Deep Dive (Subject to Applicability)
- 4.5 Emerging Market Opportunity Scorecards
- 4.5.1 United States
- 4.5.2 Europe
- 4.5.3 Asia
- 4.5.4 Middle East & Africa
Note: Emerging Market Opportunity Scorecards will be included based on relevance and strategic importance. Regions listed are indicative and may vary depending on data availability and market dynamics.
Chapter 5. Bacterial Biopesticides Import-Export Analysis & Trade Flows
- 5.1 Global Trade Overview
- 5.1.1 Global Export Value by Country (the historical period)
- 5.1.2 Global Export Volume by Country (the historical period)
- 5.1.3 Global Import Value by Country (the historical period)
- 5.1.4 Global Import Volume by Country (the historical period)
- 5.1.5 Net Trade Balance by Country (the historical period)
- 5.2 Export Analysis – Segment
- 5.2.1 Type 1 (HS Code)
- 5.2.2 Type 2 (HS Code)
- 5.2.3 Type 3 (HS Code)
- 5.2.4 Type 4 (HS Code)
- 5.2.5 Type 5 (HS Code)
- 5.3 Import Analysis – Segment
- 5.3.1 Type 1 (HS Code)
- 5.3.2 Type 2 (HS Code)
- 5.3.3 Type 3 (HS Code)
- 5.3.4 Type 4 (HS Code)
- 5.3.5 Type 5 (HS Code)
- 5.4 Average Unit Trade Prices
- 5.4.1 Average Export Price – Segment & Country
- 5.4.2 Average Import Price – Segment & Source Country
- 5.4.3 Price Trends (the historical period)
- 5.5 Key Trade Route Analysis
- 5.5.1 Trade Route 1
- 5.5.2 Trade Route 2
- 5.5.3 Trade Route 3
- 5.5.4 Trade Route 4
- 5.5.5 Trade Route 5
- 5.6 Trade Policy Impact Assessment
- 5.6.1 US Anti-Dumping & Section 301 Tariffs
- 5.6.2 EU Customs Union Impact
- 5.6.3 Major Free Trade Agreements
- 5.6.4 USMCA Rules of Origin
Note: Trade policy analysis will be included only where relevant to the Bacterial Biopesticides market.
Chapter 6. Competitive Landscape & Company Benchmarking
- 6.1 Bacterial Biopesticides Market Concentration & Structure
- 6.1.1 Herfindahl-Hirschman Index (HHI) – vs.
- 6.1.2 Tier 1, Tier 2 & Tier 3 Market Structure
- 6.1.3 Global, Regional & Local Player Dynamics
- 6.2 Bacterial Biopesticides Market Share Analysis –
- 6.2.1 Global Revenue Share by Company
- 6.2.2 Global Volume Share by Company
- 6.2.3 Regional Revenue Share
- 6.2.4 Market Share Evolution ( vs. )
- 6.2.5 OEM Segment Share by Company
- 6.2.6 Replacement Segment Share by Company
- 6.3 Production/Delivery Capacity & Facility Analysis
- 6.3.1 Global Installed Capacity
- 6.3.2 Capacity Utilization Rates
- 6.3.3 Production/Output Volume
- 6.3.4 Facility Locations & Capacity Map
- 6.3.5 Planned Capacity Additions
- 6.4 Bacterial Biopesticides Competitive Benchmarking Matrix
- 6.4.1 Revenue, Volume, CAGR & Profitability Comparison
- 6.4.2 Channel Revenue Mix
- 6.4.3 Geographic Revenue Exposure
- 6.4.4 R&D Intensity
- 6.4.5 Sustainability Maturity
- 6.5 Strategic Developments in Bacterial Biopesticides (Last 24 Months)
- 6.5.1 Mergers, Acquisitions & Divestments
- 6.5.2 New Bacterial Biopesticides Launches
- 6.5.3 Facility Expansions
- 6.5.4 Strategic Alliances, Joint Ventures & Partnerships
- 6.5.5 Distribution Expansion & Market Entry
- 6.5.6 Sustainability & ESG Initiatives
- 6.6 Competitive Strategy Mapping
- 6.6.1 Leader, Challenger, Follower & Niche Classification
- 6.6.2 Pricing Strategy Comparison
- 6.6.3 Channel Strategy Matrix
Note: Strategic developments are included based on their materiality and the availability of reliable information.
Chapter 7. Global Bacterial Biopesticides Market – By Distribution Channel
- 7.1 Segment Overview
- 7.1.1 Volume & Revenue Split by Channel ( & 2032)
- 7.1.2 Channel Mix Evolution (2032)
Chapter 8. Regional Market Analysis – Global Overview
- 8.1 Global Regional Overview
- 8.1.1 Regional Volume Share
- 8.1.2 Regional Revenue Share
- 8.1.3 Regional Volume by Region
- 8.1.4 Regional Revenue by Region
- 8.1.5 Regional Forecast Through 2032
- 8.2 Cross-Regional Segment Analysis
- 8.2.1 By Distribution Channel
- 8.2.2 By Brand/Price Tier
Chapter 9. North America Bacterial Biopesticides Market
- 9.1 United States
- 9.2 Canada
- 9.3 Mexico
Chapter 10. Europe Bacterial Biopesticides Market
- 10.1 Germany
- 10.2 France
- 10.3 Italy
- 10.4 United Kingdom
- 10.5 Spain
- 10.6 Poland
- 10.7 Russia
- 10.8 Netherlands
- 10.9 Belgium
- 10.10 Sweden
- 10.11 Denmark
- 10.12 Norway
- 10.13 Rest of Europe
Chapter 11. Asia Pacific Bacterial Biopesticides Market
- 11.1 China
- 11.2 India
- 11.3 Japan
- 11.4 South Korea
- 11.5 Thailand
- 11.6 Indonesia
- 11.7 Vietnam
- 11.8 Malaysia
- 11.9 Australia
- 11.10 Rest of Asia Pacific
Chapter 12. Latin America Bacterial Biopesticides Market
- 12.1 Brazil
- 12.2 Argentina
- 12.3 Colombia
- 12.4 Chile
- 12.5 Rest of Latin America
Chapter 13. Middle East Bacterial Biopesticides Market
- 13.1 Saudi Arabia
- 13.2 United Arab Emirates
- 13.3 Turkey
- 13.4 Israel
- 13.5 Iran
- 13.6 Rest of the Middle East
Chapter 14. Africa Bacterial Biopesticides Market
- 14.1 South Africa
- 14.2 Egypt
- 14.3 Nigeria
- 14.4 Morocco
- 14.5 Rest of Africa
Chapter 15. Bacterial Biopesticides Company Profiles
- 15.1 [Company 01]
- 15.1.1 Company Overview
- 15.1.2 Key Management Personnel
- 15.1.3 Products & Services Portfolio
- 15.1.4 Financial Performance
- 15.1.5 Key Market Focus & Geographic Presence
- 15.1.6 Recent Developments & Strategic Initiatives
Note: The company profile list is preliminary and may change based on research findings, market developments, data availability, and client requirements.
Chapter 16. Appendices
- Appendix A – List of Abbreviations & Acronyms
- Appendix B – Industry Classification Code Reference – Full Series
- Appendix C – Production & Capacity Data Tables
- Appendix D – End-Use & Demand Base Tables
- Appendix E – Consumption & Replacement Rate Assumptions
- Appendix F – ASP Reference Tables
- Appendix G – Manufacturing & Facility Database
- Appendix H – Import-Export Data Tables
- Appendix I – Regulatory Summary Tables
- Appendix J – Primary Research Participant List (Anonymized)
- Appendix K – Primary Research Questionnaire Framework
- Appendix L – Data Sources & Bibliography
- Appendix M – Market Size Divergence & Source Comparison
Chapter 17. Research Methodology
- 17.1 Research Framework & Philosophy
- 17.2 Secondary Research – Sources, Hierarchy & Data Extraction
- 17.3 Data Modeling – Bottom-Up & Top-Down Market Sizing
- 17.4 Primary Research – Stakeholder Framework, LOI & Sample Sizes
- 17.5 Forecast Methodology – Regression, Scenario & Sensitivity Analysis
- 17.6 Quality Control – Four-Layer Validation Framework
- 17.7 Limitations & Standard Assumptions
- 17.8 Disclaimer
