
Bio Implants Market Overview:
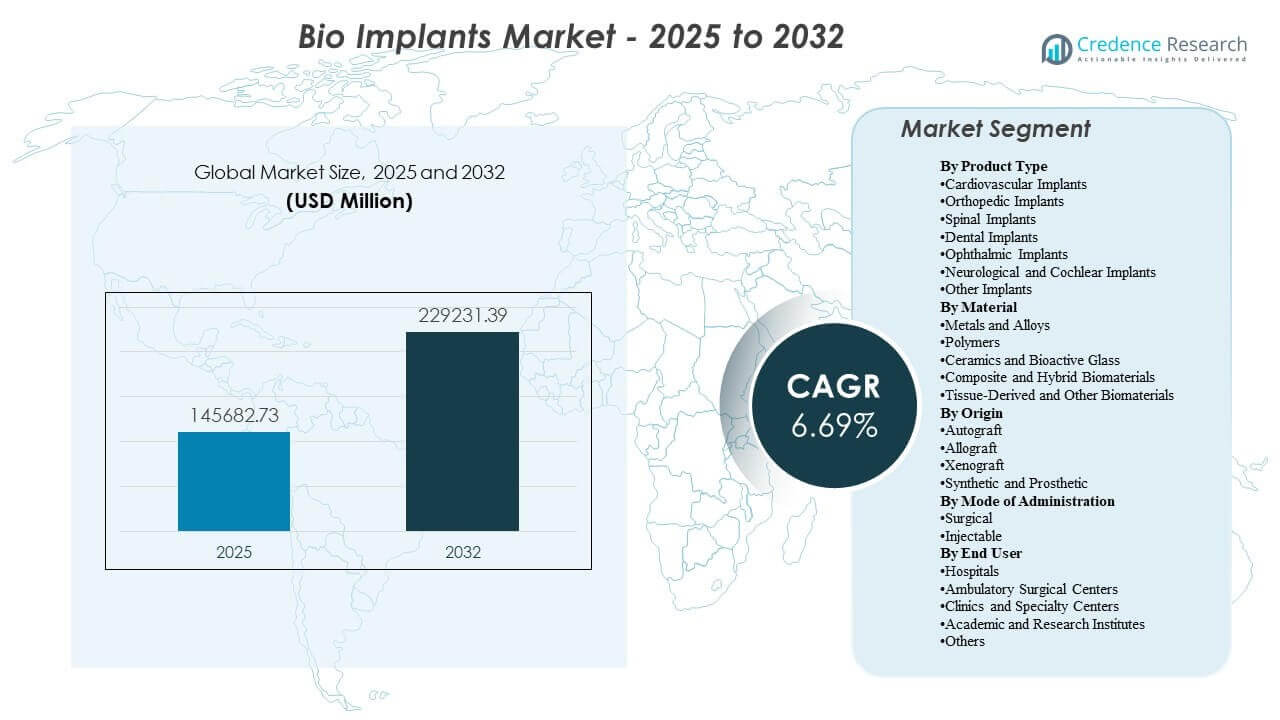
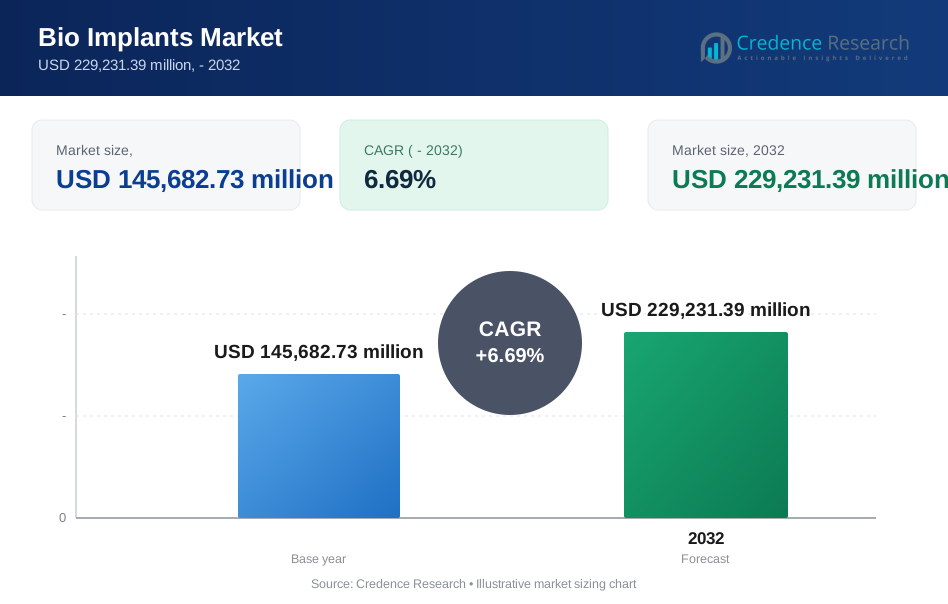
The global Bio Implants Market size was estimated at USD 145,682.73 million in 2025 and is expected to reach USD 229,231.39 million by 2032, growing at a CAGR of 6.69% from 2025 to 2032. Primarily shaped by rising surgical volumes linked to aging populations and the increasing incidence of cardiovascular and musculoskeletal disorders that require long-duration implantable solutions. Innovation in biomaterials, minimally invasive delivery methods, and digital surgical planning continues to improve outcomes and supports broader adoption across hospital and outpatient settings.
| REPORT ATTRIBUTE | DETAILS |
|---|---|
| Historical Period | 2020-2023 |
| Base Year | 2024 |
| Forecast Period | 2025-2032 |
| Bio Implants Market Size 2025 | USD 145,682.73 million |
| Bio Implants Market, CAGR | 6.69% |
| Bio Implants Market Size 2032 | USD 229,231.39 million |
Key Market Trends & Insights
- The Bio Implants Market is projected to add USD 83,548.66 million in incremental value between 2025 and 2032, moving from USD 145,682.73 million to USD 229,231.39 million over the forecast period.
- North America accounted for 42.85% share of the Bio Implants Market in 2025, supported by high procedure volumes and strong adoption of advanced implant technologies.
- Orthopedic Implants held 36.95% share in 2025, reflecting sustained demand for joint reconstruction and trauma fixation procedures.
- Hospitals represented 43.20% share in 2025, indicating continued concentration of complex implant procedures within hospital-based surgical infrastructure.
- Metals and Alloys contributed 47.65% share in 2025, highlighting continued preference for high-strength, fatigue-resistant materials in load-bearing applications.
Segment Analysis
The Bio Implants Market is influenced by sustained procedural demand across orthopedic reconstruction, cardiovascular intervention, dental restoration, and sensory-neural implants. Clinical priorities increasingly emphasize long-term device performance, reduced complication rates, and faster recovery pathways, reinforcing adoption of optimized designs and improved surface engineering. Surgical workflow modernization, including navigation, robotics, and imaging integration, supports more consistent placement and expands eligibility for complex procedures. Procurement decisions also reflect total-cost-of-care considerations, where implant longevity and reduced revision rates can justify premium pricing.
Buyer behavior increasingly favors implant systems that offer predictable outcomes, surgeon familiarity, and robust post-implant support ecosystems. Hospitals and large surgical networks continue to prefer vendor partners that can provide implants, instruments, training, and revision options as a unified platform. In parallel, minimally invasive and outpatient shifts are raising demand for streamlined implant delivery and simplified perioperative pathways. These dynamics collectively support a steady transition toward next-generation implants across cardiovascular, orthopedic, and selected neuro-sensory indications.
By Product Type Insights
Orthopedic Implants accounted for the largest share of 36.95% in 2025. Orthopedic Implants lead due to consistently high procedure volumes for joint replacement, trauma fixation, and degenerative musculoskeletal conditions across aging populations. Orthopedic Implants benefit from standardized clinical pathways and broad surgeon familiarity, which supports repeat procurement and predictable utilization. Orthopedic Implants also gain momentum from improvements in implant geometry, fixation strategies, and surface treatments that enhance stability and reduce revision risk.
By Material Insights
Metals and Alloys accounted for the largest share of 47.65% in 2025. Metals and Alloys lead because many high-value implant categories require mechanical strength, fatigue resistance, and long service life under continuous load. Metals and Alloys remain widely used in major orthopedic and cardiovascular applications where structural integrity is critical. Metals and Alloys also support advanced manufacturing approaches such as porous structures and engineered surfaces that improve osseointegration and long-term fixation.
By Origin Insights
Synthetic / Prosthetic solutions lead implant adoption due to manufacturing scalability, standardized performance, and established evidence across high-volume procedures. Synthetic / Prosthetic systems are supported by repeatable quality controls and predictable supply availability that fit large hospital procurement models. Synthetic / Prosthetic approaches also align with specialized instrumentation ecosystems and standardized surgical techniques used across orthopedic, cardiovascular, and dental procedures. Biologic graft approaches remain important in selected indications but face constraints related to sourcing, processing variability, and availability.
By Mode of Administration Outlook Insights
Surgical placement remains the dominant mode of administration for the Bio Implants Market because many implants require precise positioning, anchoring, and long-term mechanical integration. Surgical workflows support durable fixation and allow clinicians to address complex anatomy and co-morbid conditions during implantation. Injectable approaches are gaining relevance in select biomaterial and regenerative contexts where minimally invasive delivery improves recovery time. Adoption depends heavily on indication suitability, required mechanical performance, and the ability to achieve stable integration without open procedures.
By End User Insights
Hospitals accounted for the largest share of 43.20% in 2025. Hospitals lead due to concentration of complex procedures that require advanced imaging, perioperative monitoring, and specialized surgical teams. Hospitals also benefit from procurement scale and structured clinical pathways that enable repeat use of standardized implant systems. Hospitals frequently serve as referral hubs for high-acuity cases, reinforcing demand for multi-category implant portfolios and revision-capable product ecosystems.
Market Drivers
Rising procedure volumes linked to aging demographics and chronic disease burden
The Bio Implants Market benefits from increasing surgical volumes driven by aging populations and higher prevalence of cardiovascular and musculoskeletal disorders. Degenerative joint disease and structural heart conditions create sustained demand for durable implantable solutions. Healthcare systems continue to expand elective and semi-elective capacity to address backlogs and improve quality of life outcomes. These factors reinforce a stable long-term demand foundation for implants across multiple specialties.
Material innovation improving fixation, longevity, and clinical confidence
Advances in biomaterials and surface engineering continue to enhance implant stability, reduce wear, and improve tissue integration. Porous and textured surfaces, improved coatings, and optimized geometries support stronger fixation and lower revision risk in load-bearing indications. Clinical confidence increases when implants demonstrate consistent outcomes and predictable recovery profiles. These performance improvements support adoption across both mature and expanding healthcare markets.
- For instance, Straumann’s SLActive hydrophilic surface on dental implants has demonstrated survival rates above 98% at 10 years in clinical follow‑up, while Nitinol-based stents from companies such as Boston Scientific leverage high fatigue resistance exceeding 400 million loading cycles in bench testing, supporting long‑term durability in vascular applications.
Expansion of minimally invasive and catheter-based intervention pathways
Minimally invasive approaches are expanding access to implant procedures by lowering perioperative risk and shortening recovery time. Cardiovascular categories increasingly rely on transcatheter and catheter-delivered devices, supporting broader eligibility among older and higher-risk patients. Outpatient growth trends influence device design priorities toward easier delivery, reduced operative time, and simplified postoperative management. These dynamics strengthen adoption in both hospital and ambulatory settings.
Increasing standardization of surgical workflows and digital planning
Digital planning tools, navigation systems, and robotics-enabled procedures improve consistency and reduce variability in implant placement. More standardized workflows can improve outcomes and increase surgeon adoption of advanced implant systems. Integrated training, instrumentation, and software ecosystems also strengthen vendor lock-in and repeat purchasing behavior. This driver supports scale-up of implant utilization across networks that prioritize outcome metrics and procedural efficiency.
- For instance, Stryker’s Mako robotic-arm–assisted platform for total knee arthroplasty has demonstrated reduced total postoperative blood loss within 72 hours (approximately 1030 mL vs 1120 mL) and lower intraoperative blood loss compared with conventional techniques in controlled clinical cohorts, while also improving alignment accuracy into a ±3° target range in more than 90% of cases in real‑world series.
Market Challenges
The Bio Implants Market faces pressure from pricing constraints and procurement-driven purchasing behavior, particularly in cost-sensitive health systems. Hospital tenders and group purchasing organizations can compress margins and favor suppliers that deliver broad portfolios rather than specialized products. Reimbursement variability across regions also influences adoption of premium implants, especially where payers prioritize lower upfront costs. These factors can slow uptake of next-generation implants even when clinical value is clear.
Regulatory scrutiny and post-market surveillance requirements remain significant challenges, especially for high-risk implant categories. Longer approval timelines, evidence demands, and real-world performance monitoring increase development cost and time-to-market. Product recalls or safety signals can rapidly impact brand trust and purchasing behavior. Clinical training requirements also create adoption friction for newer systems that require workflow changes or specialized instrumentation.
- For instance, Straumann’s Restorative Dentistry 360 digital implant workflow couples its implants with a full training and implementation program because clinicians need dedicated instruction in CBCT-based planning, guided surgery, and digital restoration steps before the system can be routinely adopted in practice.
Market Trends and Opportunities
Personalized and patient-matched implants are gaining momentum as imaging and design tools enable better anatomical fit and improved functional outcomes. Additive manufacturing and advanced machining increasingly support customized solutions in orthopedic and craniofacial applications. This trend can reduce revision risk and improve surgeon confidence in complex anatomies. Growing availability of digital planning platforms supports broader commercialization of patient-specific implant programs.
- For instance, Anatomics Pty Ltd supplied 4,120 patient-specific craniomaxillofacial implants using additive manufacturing, including 2,689 from PMMA and 885 from titanium mesh. This trend can reduce revision risk and improve surgeon confidence in complex anatomies.
Outpatient migration creates opportunities for simplified implant systems and minimally invasive delivery models that reduce procedure time and postoperative burden. Demand is rising for implants and instruments optimized for ambulatory surgical centers and specialty clinics, especially in orthopedics and dental. Vendor strategies increasingly bundle implants with training and workflow tools to reduce adoption barriers. These opportunities support differentiated product positioning and stronger recurring revenue models.
Regional Insights
North America
North America held 42.85% share, supported by high procedural intensity, strong reimbursement coverage, and early adoption of advanced implant technologies. The Bio Implants Market in North America benefits from deep specialist availability and broad access to high-acuity hospital infrastructure. Vendor competition is reinforced by innovation cycles that include improved biomaterials, minimally invasive approaches, and digital surgical workflows. Purchasing decisions frequently emphasize total-cost-of-care outcomes, including revision risk and long-term performance.
Europe
Europe accounted for 23.95% share, supported by aging demographics, established surgical capacity, and steady elective procedure volumes across orthopedics, dental, and cardiovascular care. The Bio Implants Market in Europe is shaped by structured reimbursement systems and strong clinical standardization in many countries. Procurement frameworks can create pricing pressure, increasing demand for value-based differentiation and outcome evidence. Technology adoption remains strong in major healthcare systems that emphasize quality and long-term durability.
Asia Pacific
Asia Pacific represented 23.10% share, supported by expanding healthcare access, rising procedure volumes, and increasing penetration of modern surgical techniques. The Bio Implants Market in Asia Pacific continues to benefit from large patient bases and growing investment in tertiary hospitals and specialty centers. Pricing sensitivity and variable reimbursement can affect premium implant adoption, encouraging tiered portfolios and localized manufacturing strategies. Faster procedural growth supports strong medium-term expansion across major markets.
Latin America
Latin America accounted for 6.05% share, with demand concentrated in private hospital networks and major urban centers. The Bio Implants Market in Latin America is influenced by budget constraints, reimbursement variability, and uneven access to advanced implant systems across countries. Public-sector procurement processes often prioritize affordability, which can limit adoption of premium technologies. Growth opportunities are supported by expanding private care capacity and increasing orthopedic and cardiovascular procedure volumes.
Middle East & Africa
Middle East & Africa held 4.05% share, with adoption concentrated in high-spend pockets such as GCC markets and selected private hospital systems. The Bio Implants Market in Middle East & Africa faces constraints related to specialist availability, uneven infrastructure, and procurement affordability across many countries. Imports remain important for advanced implant categories, reinforcing supply-chain and pricing considerations. Demand growth is supported by investment in tertiary care, medical tourism corridors, and expanding surgical capacity in key markets.
Competitive Landscape
Competition in the Bio Implants Market is shaped by portfolio breadth, clinical evidence depth, and the ability to integrate implants with enabling technologies such as navigation, robotics, and digital planning. Leading suppliers differentiate through biomaterial innovation, implant design improvements, and specialized instrumentation ecosystems that support surgeon adoption and repeat purchasing. Strategic priorities also include expanding minimally invasive delivery platforms, strengthening hospital contracting access, and building training programs to reduce adoption friction. Product reliability, revision support, and outcomes-based positioning remain central to long-term share retention.
Medtronic plc maintains a broad implant and device presence with strong positioning in cardiovascular intervention platforms and related procedural ecosystems. Medtronic plc focuses on expanding therapy access through iterative product improvements and broad clinical adoption pathways that support consistent utilization in complex care settings. Medtronic plc also benefits from established relationships with hospital systems and the ability to pair implantable technologies with procedural tools and training. Medtronic plc strategy aligns with long-term demand growth driven by chronic disease prevalence and minimally invasive procedural expansion.
The industry research and growth report includes detailed analyses of the competitive landscape of the market and information about key companies, including:
- Medtronic plc
- Johnson & Johnson / DePuy Synthes
- Stryker Corporation
- Zimmer Biomet Holdings, Inc.
- Abbott Laboratories
- Boston Scientific Corporation
- Smith+Nephew plc
- Edwards Lifesciences Corporation
- B. Braun Melsungen AG
- Integra LifeSciences Holdings Corporation
- Straumann AG
- Cochlear Ltd.
Qualitative and quantitative analysis of companies has been conducted to help clients understand the wider business environment as well as the strengths and weaknesses of key industry players. Data is qualitatively analyzed to categorize companies as pure play, category-focused, industry-focused, and diversified; it is quantitatively analyzed to categorize companies as dominant, leading, strong, tentative, and weak.
Recent Developments
- In January 2026, Smith+Nephew plc completed the acquisition of Integrity Orthopaedics adding the Tendon Seam rotator cuff repair system to complement its REGENETEN Bioinductive Implant for advanced shoulder bio repair solutions.
- In October 2025, Johnson & Johnson announced plans to spin off its DePuy Synthes orthopedics division into a standalone company within 18-24 months to focus on higher-growth areas, impacting bio implants like hip, knee, and shoulder products.
- In January 2025, Stryker announced a definitive agreement to sell its U.S. spinal implants business to Viscogliosi Brothers, LLC, expected to close in the first half of 2025, allowing refocus on faster-growing segments in the bio implants space.
- In January 2025, Zimmer Biomet announced a definitive agreement to acquire Paragon 28 for $13 per share in cash, enhancing its foot and ankle bio implants portfolio in the high-growth musculoskeletal segment.
Report Scope
| Report Attribute | Details |
| Market size value in 2025 | USD 145,682.73 million |
| Revenue forecast in 2032 | USD 229,231.39 million |
| Growth rate (CAGR) | 6.69% (2025–2032) |
| Base year | 2025 |
| Forecast period | 2026–2032 |
| Quantitative units | USD million |
| Segments covered | By Product Type Outlook: Cardiovascular Implants, Orthopedic Implants, Spinal Implants, Dental Implants, Ophthalmic Implants, Neurological and Cochlear Implants, Other Implants; By Material Outlook: Metals and Alloys, Polymers, Ceramics and Bioactive Glass, Composite and Hybrid Biomaterials, Tissue-Derived and Other Biomaterials; By Origin Outlook: Autograft, Allograft, Xenograft, Synthetic / Prosthetic; By Mode of Administration Outlook: Surgical, Injectable; By End User Outlook: Hospitals, Ambulatory Surgical Centers, Clinics and Specialty Centers, Academic and Research Institutes, Others |
| Regional scope | North America, Europe, Asia Pacific, Latin America, Middle East & Africa |
| Key companies profiled | Medtronic plc, Johnson & Johnson / DePuy Synthes, Stryker Corporation, Zimmer Biomet Holdings, Inc., Abbott Laboratories, Boston Scientific Corporation, Smith+Nephew plc, Edwards Lifesciences Corporation, B. Braun Melsungen AG, Integra LifeSciences Holdings Corporation, Straumann AG, Cochlear Ltd. |
| No. of Pages | 340 |
Segmentation
By Product Type
- Cardiovascular Implants
- Orthopedic Implants
- Spinal Implants
- Dental Implants
- Ophthalmic Implants
- Neurological and Cochlear Implants
- Other Implants
By Material
- Metals and Alloys
- Polymers
- Ceramics and Bioactive Glass
- Composite and Hybrid Biomaterials
- Tissue-Derived and Other Biomaterials
By Origin
- Autograft
- Allograft
- Xenograft
- Synthetic / Prosthetic
By Mode of Administration Outlook
- Surgical
- Injectable
By End User
- Hospitals
- Ambulatory Surgical Centers
- Clinics and Specialty Centers
- Academic and Research Institutes
- Others
By Region
- North America
- U.S.
- Canada
- Mexico
- Europe
- Germany
- France
- U.K.
- Italy
- Spain
- Rest of Europe
- Asia Pacific
- China
- Japan
- India
- South Korea
- South-east Asia
- Rest of Asia Pacific
- Latin America
- Brazil
- Argentina
- Rest of Latin America
- Middle East & Africa
- GCC Countries
- South Africa
- Rest of the Middle East and Africa
Request a Free Sample
Fill in your details and we'll send you a free sample report.
- Sample data tables & charts
- Research methodology
Need a Custom Version of This Report?
Tailor the scope, geography, or segments to your exact requirements.
- Custom geography or segment scope
- Direct access to our analyst team
Frequently Asked Questions
What is the current size of the Bio Implants Market and what is the forecast value?
What is the growth rate of the Bio Implants Market?
Which segment leads the Bio Implants Market by product type?
What are the key growth factors shaping the Bio Implants Market?
Which companies are profiled in the Bio Implants Market competitive landscape?
Which region leads the Bio Implants Market?
Table of Content
Chapter 1. Report Introduction
- 1.1 Report Description & Purpose
- 1.1.1 Report Title & Market Definition
- 1.1.2 Unique Selling Propositions (USP) & Key Differentiators
- 1.1.3 Value Proposition for Stakeholders
- 1.2 Research Objectives
- 1.2.1 Market Sizing Objectives (Volume & Revenue)
- 1.2.2 Segmentation Objectives
- 1.2.3 Competitive Intelligence Objectives
- 1.2.4 Forecast & Scenario Objectives
- 1.3 Report Scope
- 1.3.1 Bio Implants Scope – Types & Subtypes Covered
- 1.3.2 Geographic Scope – Regions & Countries Covered
- 1.3.3 Historical Period, Base Year & Forecast Period (the historical period; forecast to 2032)
- 1.3.4 Inclusions & Exclusions
- 1.4 HS Code & Classification Framework
- 1.5 Currency, Units & Pricing Basis
- 1.6 Target Stakeholders
- 1.7 Limitations & Assumptions
Chapter 2. Executive Summary
- 2.1 Global Bio Implants Market Snapshot
- 2.1.1 Market Size – Historical (the historical period) & Forecast (2032) (base year: USD 145,682.73 million → 2032: USD 229,231.39 million)
- 2.1.2 Volume & Revenue – Global Totals
- 2.1.3 Key Market Highlights – Top Five Facts
- 2.2 Bio Implants Market Segmentation Snapshot
- 2.2.1 Market Split by Region – vs. 2032
- 2.3 Competitive Snapshot
- 2.3.1 Top 10 Players by Revenue Share –
- 2.3.2 Top 10 Players by Volume Share –
- 2.3.3 Recent Strategic Developments (18-Month Summary)
- 2.4 Key Investment Highlights & Strategic Conclusions
Chapter 3. Bio Implants Market Dynamics & Industry Analysis
- 3.1 Market Overview & Context
- 3.1.1 Bio Implants Market Position in the Broader Automotive Value Chain
- 3.1.2 OEM vs. Replacement Market Dynamics
- 3.1.3 Market Maturity & Development Stage by Region
- 3.2 Bio Implants Market Drivers
- 3.3 Bio Implants Market Restraints & Challenges
- 3.4 Bio Implants Market Opportunities
- 3.5 Porter's Five Forces Analysis
- 3.5.1 Threat of New Entrants
- 3.5.2 Bargaining Power of Suppliers
- 3.5.3 Bargaining Power of Buyers
- 3.5.4 Threat of Substitutes
- 3.5.5 Competitive Rivalry – Intensity Assessment
- 3.6 Bio Implants Value Chain Analysis
- 3.6.1 Upstream – Raw Material/Input Suppliers
- 3.6.1.1 Raw Material/Input 1
- 3.6.1.2 Raw Material/Input 2
- 3.6.1.3 Raw Material/Input 3
- 3.6.2 Midstream – Production/Manufacturing/Service Delivery
- 3.6.2.1 Production/Process Overview
- 3.6.2.2 Key Facility Locations & Capacity by Manufacturer
- 3.6.3 Downstream – Distribution & End Consumer
- 3.6.3.1 Primary Channel – B2B/OEM
- 3.6.3.2 Secondary Channels – Dealer, Retail, Online, Direct
- 3.6.4 Value Chain Profitability Analysis
- 3.6.1 Upstream – Raw Material/Input Suppliers
- 3.7 PESTEL Analysis
- 3.7.1 Political Factors
- 3.7.2 Economic Factors
- 3.7.3 Social Factors
- 3.7.4 Technological Factors
- 3.7.5 Environmental Factors
- 3.7.6 Legal Factors
- 3.8 Bio Implants Supply Chain Analysis
- 3.8.1 Raw Material/Input Supply Risk Assessment
- 3.8.2 Manufacturing Concentration Risk (Geographic Exposure)
- 3.8.3 Trade Disruption Impact Analysis
- 3.9 Regulatory & Policy Landscape
Note: The regulatory and policy landscape section covers regulations based on their applicability to the market, Bio Implants category, geography, and scope of the study. Only regulatory frameworks with a material impact on operations, compliance, trade, sustainability, or market access are analyzed in detail.
Chapter 4. Key Investment Pockets & Opportunity Analysis
- 4.1 Bio Implants Market Attractiveness Analysis
- 4.1.1 By Region – Investment Attractiveness Matrix (Volume × CAGR)
- 4.2 Absolute Revenue Growth Opportunity
- 4.2.1 By Region – Absolute USD Growth Through 2032
- 4.3 Incremental Volume Opportunity
- 4.3.1 By Region – Incremental Volume Through 2032
- 4.3.2 Segment – Incremental Volume
- 4.4 Emerging Submarket Opportunity Deep Dive (Subject to Applicability)
- 4.5 Emerging Market Opportunity Scorecards
- 4.5.1 United States
- 4.5.2 Europe
- 4.5.3 Asia
- 4.5.4 Middle East & Africa
Note: Emerging Market Opportunity Scorecards will be included based on relevance and strategic importance. Regions listed are indicative and may vary depending on data availability and market dynamics.
Chapter 5. Bio Implants Import-Export Analysis & Trade Flows
- 5.1 Global Trade Overview
- 5.1.1 Global Export Value by Country (the historical period)
- 5.1.2 Global Export Volume by Country (the historical period)
- 5.1.3 Global Import Value by Country (the historical period)
- 5.1.4 Global Import Volume by Country (the historical period)
- 5.1.5 Net Trade Balance by Country (the historical period)
- 5.2 Export Analysis – Segment
- 5.2.1 Type 1 (HS Code)
- 5.2.2 Type 2 (HS Code)
- 5.2.3 Type 3 (HS Code)
- 5.2.4 Type 4 (HS Code)
- 5.2.5 Type 5 (HS Code)
- 5.3 Import Analysis – Segment
- 5.3.1 Type 1 (HS Code)
- 5.3.2 Type 2 (HS Code)
- 5.3.3 Type 3 (HS Code)
- 5.3.4 Type 4 (HS Code)
- 5.3.5 Type 5 (HS Code)
- 5.4 Average Unit Trade Prices
- 5.4.1 Average Export Price – Segment & Country
- 5.4.2 Average Import Price – Segment & Source Country
- 5.4.3 Price Trends (the historical period)
- 5.5 Key Trade Route Analysis
- 5.5.1 Trade Route 1
- 5.5.2 Trade Route 2
- 5.5.3 Trade Route 3
- 5.5.4 Trade Route 4
- 5.5.5 Trade Route 5
- 5.6 Trade Policy Impact Assessment
- 5.6.1 US Anti-Dumping & Section 301 Tariffs
- 5.6.2 EU Customs Union Impact
- 5.6.3 Major Free Trade Agreements
- 5.6.4 USMCA Rules of Origin
Note: Trade policy analysis will be included only where relevant to the Bio Implants market.
Chapter 6. Competitive Landscape & Company Benchmarking
- 6.1 Bio Implants Market Concentration & Structure
- 6.1.1 Herfindahl-Hirschman Index (HHI) – vs.
- 6.1.2 Tier 1, Tier 2 & Tier 3 Market Structure
- 6.1.3 Global, Regional & Local Player Dynamics
- 6.2 Bio Implants Market Share Analysis –
- 6.2.1 Global Revenue Share by Company
- 6.2.2 Global Volume Share by Company
- 6.2.3 Regional Revenue Share
- 6.2.4 Market Share Evolution ( vs. )
- 6.2.5 OEM Segment Share by Company
- 6.2.6 Replacement Segment Share by Company
- 6.3 Production/Delivery Capacity & Facility Analysis
- 6.3.1 Global Installed Capacity
- 6.3.2 Capacity Utilization Rates
- 6.3.3 Production/Output Volume
- 6.3.4 Facility Locations & Capacity Map
- 6.3.5 Planned Capacity Additions
- 6.4 Bio Implants Competitive Benchmarking Matrix
- 6.4.1 Revenue, Volume, CAGR & Profitability Comparison
- 6.4.2 Channel Revenue Mix
- 6.4.3 Geographic Revenue Exposure
- 6.4.4 R&D Intensity
- 6.4.5 Sustainability Maturity
- 6.5 Strategic Developments in Bio Implants (Last 24 Months)
- 6.5.1 Mergers, Acquisitions & Divestments
- 6.5.2 New Bio Implants Launches
- 6.5.3 Facility Expansions
- 6.5.4 Strategic Alliances, Joint Ventures & Partnerships
- 6.5.5 Distribution Expansion & Market Entry
- 6.5.6 Sustainability & ESG Initiatives
- 6.6 Competitive Strategy Mapping
- 6.6.1 Leader, Challenger, Follower & Niche Classification
- 6.6.2 Pricing Strategy Comparison
- 6.6.3 Channel Strategy Matrix
Note: Strategic developments are included based on their materiality and the availability of reliable information.
Chapter 7. Global Bio Implants Market – By Distribution Channel
- 7.1 Segment Overview
- 7.1.1 Volume & Revenue Split by Channel ( & 2032)
- 7.1.2 Channel Mix Evolution (2032)
Chapter 8. Regional Market Analysis – Global Overview
- 8.1 Global Regional Overview
- 8.1.1 Regional Volume Share
- 8.1.2 Regional Revenue Share
- 8.1.3 Regional Volume by Region
- 8.1.4 Regional Revenue by Region
- 8.1.5 Regional Forecast Through 2032
- 8.2 Cross-Regional Segment Analysis
- 8.2.1 By Distribution Channel
- 8.2.2 By Brand/Price Tier
Chapter 9. North America Bio Implants Market
- 9.1 United States
- 9.2 Canada
- 9.3 Mexico
Chapter 10. Europe Bio Implants Market
- 10.1 Germany
- 10.2 France
- 10.3 Italy
- 10.4 United Kingdom
- 10.5 Spain
- 10.6 Poland
- 10.7 Russia
- 10.8 Netherlands
- 10.9 Belgium
- 10.10 Sweden
- 10.11 Denmark
- 10.12 Norway
- 10.13 Rest of Europe
Chapter 11. Asia Pacific Bio Implants Market
- 11.1 China
- 11.2 India
- 11.3 Japan
- 11.4 South Korea
- 11.5 Thailand
- 11.6 Indonesia
- 11.7 Vietnam
- 11.8 Malaysia
- 11.9 Australia
- 11.10 Rest of Asia Pacific
Chapter 12. Latin America Bio Implants Market
- 12.1 Brazil
- 12.2 Argentina
- 12.3 Colombia
- 12.4 Chile
- 12.5 Rest of Latin America
Chapter 13. Middle East Bio Implants Market
- 13.1 Saudi Arabia
- 13.2 United Arab Emirates
- 13.3 Turkey
- 13.4 Israel
- 13.5 Iran
- 13.6 Rest of the Middle East
Chapter 14. Africa Bio Implants Market
- 14.1 South Africa
- 14.2 Egypt
- 14.3 Nigeria
- 14.4 Morocco
- 14.5 Rest of Africa
Chapter 15. Bio Implants Company Profiles
- 15.1 [Company 01]
- 15.1.1 Company Overview
- 15.1.2 Key Management Personnel
- 15.1.3 Products & Services Portfolio
- 15.1.4 Financial Performance
- 15.1.5 Key Market Focus & Geographic Presence
- 15.1.6 Recent Developments & Strategic Initiatives
Note: The company profile list is preliminary and may change based on research findings, market developments, data availability, and client requirements.
Chapter 16. Appendices
- Appendix A – List of Abbreviations & Acronyms
- Appendix B – Industry Classification Code Reference – Full Series
- Appendix C – Production & Capacity Data Tables
- Appendix D – End-Use & Demand Base Tables
- Appendix E – Consumption & Replacement Rate Assumptions
- Appendix F – ASP Reference Tables
- Appendix G – Manufacturing & Facility Database
- Appendix H – Import-Export Data Tables
- Appendix I – Regulatory Summary Tables
- Appendix J – Primary Research Participant List (Anonymized)
- Appendix K – Primary Research Questionnaire Framework
- Appendix L – Data Sources & Bibliography
- Appendix M – Market Size Divergence & Source Comparison
Chapter 17. Research Methodology
- 17.1 Research Framework & Philosophy
- 17.2 Secondary Research – Sources, Hierarchy & Data Extraction
- 17.3 Data Modeling – Bottom-Up & Top-Down Market Sizing
- 17.4 Primary Research – Stakeholder Framework, LOI & Sample Sizes
- 17.5 Forecast Methodology – Regression, Scenario & Sensitivity Analysis
- 17.6 Quality Control – Four-Layer Validation Framework
- 17.7 Limitations & Standard Assumptions
- 17.8 Disclaimer
