Market Overview
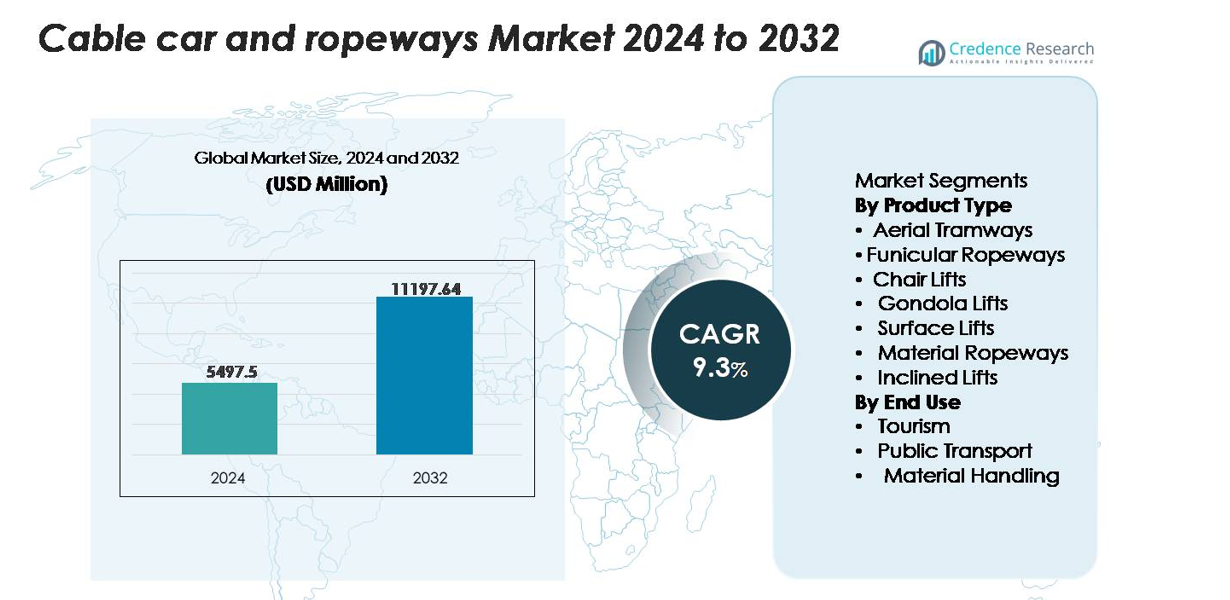
The global cable car and ropeways market was valued at USD 5,497.5 million in 2024 and is projected to reach USD 11,197.64 million by 2032, registering a CAGR of 9.3% during the forecast period.
| REPORT ATTRIBUTE |
DETAILS |
| Historical Period |
2020-2023 |
| Base Year |
2024 |
| Forecast Period |
2025-2032 |
| Cable Car and Ropeways Market Size 2024 |
USD 5,497.5 million |
| Cable Car and Ropeways Market, CAGR |
9.3% |
| Cable Car and Ropeways Market Size 2032 |
USD 11,197.64 million |
The cable car and ropeways market is shaped by leading companies such as Doppelmayr/Garaventa Group, Leitner Group, Leitner-Poma of America, Bartholet Maschinenbau AG (BMF), Nippon Cable Co., Ltd., MND Group, STM Teleferik, Damodar Ropeways & Infra Ltd., CONVEYOR & ROPEWAY SERVICES PVT. LTD., CCM FINOTELLO SRL, Bullwheel International Cable Car Corp., and Dubrovnik Cable Cars. These players compete through high-capacity gondola systems, energy-efficient drives, and advanced safety technologies. Europe dominates the global market with a 34% share, supported by extensive alpine tourism infrastructure and continuous modernization, while Asia-Pacific, accounting for 28%, emerges as the fastest-growing region driven by tourism expansion and urban mobility initiatives.
Market Insights
- The global cable car and ropeways market was valued at USD 5,497.5 million in 2024 and is projected to reach USD 11,197.64 million by 2032, registering a 9.3% CAGR during the forecast period.
- Market growth is driven by rising demand for efficient mountain transport, tourism expansion, and increasing adoption of ropeways in urban mobility projects to reduce congestion and emissions.
- Key trends include deployment of long-span gondolas, integration of digital monitoring and automation systems, and modernization of legacy infrastructure, with leading players expanding high-capacity and energy-efficient product portfolios.
- Market restraints arise from high initial capital costs, complex regulatory approvals, and weather-related operational vulnerabilities, particularly in mountainous or high-wind regions.
- Europe leads with 34% share, followed by Asia-Pacific at 28%, North America at 23%, Latin America at 9%, and Middle East & Africa at 6%; Gondola lifts remain the dominant product segment due to high capacity, enclosed cabins, and broad suitability across tourism and urban applications.
Access crucial information at unmatched prices!
Request your sample report today & start making informed decisions powered by Credence Research Inc.!
Download Sample
Market Segmentation Analysis:
By Product Type
Gondola lifts hold the dominant share within the product-type segmentation, driven by their ability to transport high passenger volumes efficiently across long, complex terrains while ensuring continuous cabin movement. Their adoption is rising in urban mobility initiatives and high-altitude tourism corridors, where enclosed cabins enhance safety and all-weather reliability. Chair lifts and aerial tramways remain essential in ski resorts and mountainous regions, while funicular ropeways support steep-gradient applications. Material ropeways and inclined lifts continue to grow in specialized industrial and infrastructure environments requiring dependable, low-footprint vertical transport.
- For instance, Leitner’s 6-seater “Premium Chairlift” line integrates DirectDrive propulsion capable of delivering up to 1,000 kW output, reducing mechanical components and improving energy efficiency.
By End Use
Tourism remains the leading end-use segment, accounting for the largest market share as destinations increasingly adopt ropeway systems to enhance accessibility, reduce road congestion, and support sustainable sightseeing. Scenic routes in mountain regions, heritage sites, and eco-tourism locations rely heavily on gondolas and aerial tramways to deliver safe, high-capacity travel. Public transport applications are expanding as cities deploy ropeways for last-mile connectivity and congestion reduction. Material handling continues to serve industrial sites, mines, and construction zones where aerial transport provides efficient, terrain-independent movement of goods.
- For instance, POMA’s Ba Na Hills cable car system in Vietnam operates a single tri-cable line spanning 5,801 meters with a vertical rise of 1,368 meters, enabling continuous visitor flow to high-altitude attractions.
Key Growth Drivers
Expansion of Sustainable Urban Mobility Solutions
Cities worldwide are embracing cable-propelled transit as a low-emission, space-efficient transport mode that helps alleviate road congestion without requiring extensive civil infrastructure. Urban cable cars offer consistent travel times, minimal right-of-way disruption, and the ability to deploy over rivers, steep slopes, or densely built environments where conventional public transport expansion is constrained. Governments are increasingly integrating ropeways into multimodal mobility plans to enhance last-mile connectivity and reduce vehicular emissions. The rising focus on green mobility, coupled with the cost-effectiveness of ropeways compared with tunnels or elevated rail corridors, significantly accelerates adoption. Municipalities also benefit from faster project execution timelines, reduced land acquisition requirements, and lower maintenance demands. As urban populations expand, ropeways present a scalable, low-footprint mobility alternative that supports decarbonization goals while improving transport accessibility.
- For instance, Leitner Câblebús Line 2 in Mexico City spans 10.6 kilometers with 300 cabins traveling at 6 m/s, providing uninterrupted transit over densely populated districts.
Rising Tourism Development and Mountain Accessibility Projects
Tourism-driven installations continue to serve as a major growth catalyst, particularly in mountainous and scenic destinations where ropeways enhance accessibility and visitor experience. Governments and tourism boards are investing in new gondola and aerial tramway corridors to expand footfall at remote sites, reduce road traffic, and provide safer access across challenging terrains. Ropeways also support year-round tourism, enabling smooth transit during snow, monsoon, or fog conditions that typically restrict vehicle movement. Modern cabins with panoramic glazing, automated safety systems, and high-capacity drives further elevate demand for premium visitor experiences. Many destinations are upgrading legacy ropeway assets to improve energy efficiency, comfort, and ride smoothness, fueling replacement demand. As global tourism rebounds and countries diversify into eco-tourism and adventure travel, cable cars are increasingly viewed as critical infrastructure for sustainable destination development, supporting both economic growth and environmental conservation.
- For instance, the Titlis Rotair in Switzerland—originally developed in cooperation with Garaventa and later upgraded by the Doppelmayr/Garaventa Group—features a fully rotating cabin that completes a full 360-degree turn during its ascent to the summit station located at approximately 3,020 meters above sea level, enhancing visibility for high-altitude tourists.
Industrial Adoption for Efficient and Terrain-Independent Material Handling
Material ropeways are gaining traction as industries seek reliable, energy-efficient solutions for transporting bulk materials across rugged, inaccessible, or environmentally sensitive regions. These systems enable continuous, high-capacity conveyance of minerals, aggregates, timber, or construction material with significantly lower operational costs than trucking. Ropeways reduce fuel dependency, minimize road maintenance requirements, and decrease greenhouse gas emissions, making them ideal for mining regions and hydropower construction sites. Operators also benefit from enhanced safety, as aerial transport reduces roadway congestion and eliminates hazards associated with heavy vehicle movement. Modern material ropeways incorporate automated loading systems, high-tensile ropes, and monitoring sensors that improve uptime and operating precision. As industries expand into remote geographies and environmental regulations tighten, ropeways provide a sustainable and cost-optimized alternative for long-distance material movement.
- For instance, Doppelmayr’s RopeCon installation for the bauxite quarry in Jamaica transports up to 1,200 tons of material per hour across a 3.4-kilometer aerial route, while minimizing ground disturbance.
Key Trends & Opportunities
Integration of Automation, Digital Monitoring, and Smart Cabin Technologies
Technological advancements are reshaping next-generation ropeway systems with sensors, automation platforms, and predictive maintenance capabilities. Operators increasingly deploy IoT-based monitoring solutions to track rope tension, cabin movement, vibration patterns, and brake performance in real time, reducing downtime and enhancing safety. Automated cabin spacing, advanced grip designs, and regenerative drive systems also improve energy efficiency and operational reliability. Smart cabins equipped with climate control, infotainment, CCTV, and emergency communication systems elevate passenger comfort while supporting tourism-focused premium experiences. These digital enhancements open new opportunities for operators to optimize fleet management, extend asset life cycles, and comply with stringent safety norms. As regulatory bodies push for higher service reliability and modernization, digital innovation stands out as a transformative trend shaping the market’s evolution.
- For instance, Doppelmayr’s D-Line systems use integrated sensors capable of performing continuous diagnostics across haul ropes, grips, and drive units, which involves the monitoring of numerous operational parameters in real-time, aligning with their ‘Smart Ropeway’ philosophy of high digitalization and predictive maintenance.
Growing Investments in Urban Ropeway Corridors and Multimodal Transport Integration
The global shift toward integrated public transport ecosystems is creating strong opportunities for ropeways to serve as feeder systems to metro, bus rapid transit, and suburban rail networks. Urban planners recognize the value of aerial corridors in overcoming geographical limitations and providing rapid connectivity in congested zones. Many cities are evaluating ropeway proposals under public–private partnership models, accelerating feasibility assessments and execution timelines. Infrastructure developers see value in the low disruption, cost-efficient deployment, and strong ridership potential in underserved neighborhoods. Additionally, the availability of advanced ropeway designs with higher capacity and reduced noise emissions enables smoother urban integration. As financial incentives for clean mobility and sustainable transport rise globally, the opportunity for ropeway-based urban transit continues to expand rapidly.
- For instance, the Medellín Metrocable Line K—built by POMA—covers 2,072 meters with cabins operating at 5 m/s, directly linking hillside communities to the city’s metro system via Santo Domingo station.
Key Challenges
High Initial Capital Costs and Lengthy Regulatory Approvals
Despite their long-term operational advantages, ropeway projects often face significant upfront capital investments tied to towers, stations, drive systems, and safety infrastructure. Many municipalities, particularly in developing regions, struggle to allocate funding or secure private participation due to budget constraints. Regulatory approvals add further delays, involving environmental clearances, right-of-way permissions, aviation authority reviews, and structural safety certifications. Complex terrain, weather considerations, and engineering requirements increase planning time and cost variability. These challenges can slow down project initiation and procurement cycles. For operators and governments, balancing financial feasibility with safety and compliance standards remains a core hurdle limiting widespread deployment.
Operational Risks, Weather Vulnerability, and Maintenance Complexity
Ropeways, especially those located in mountainous or high-wind zones, remain vulnerable to climatic conditions such as storms, heavy snowfall, lightning, and extreme temperature shifts. Weather-induced downtime affects reliability and reduces revenue for tourism and urban transport operators. Maintenance complexity—spanning rope inspections, grip overhauls, gearbox lubrication, and tower alignment—requires skilled technicians and periodic shutdowns. Failure to maintain strict safety protocols can result in mechanical failures or service disruptions, eroding public confidence. Additionally, aging installations require costly modernizations to meet evolving safety standards. These operational and environmental challenges necessitate continuous investment in monitoring technologies, skilled workforce development, and proactive maintenance planning.
Regional Analysis
North America
North America accounts for 23% of the cable car and ropeways market, driven by strong adoption in ski resorts, national parks, and emerging urban transport corridors. The U.S. and Canada continue to modernize legacy systems with high-capacity gondolas, advanced safety controls, and digital monitoring platforms. Growing interest in low-emission mobility solutions has encouraged several cities to evaluate ropeways as congestion-relief transit options. High tourism expenditure, robust regulatory frameworks, and early deployment of automation technologies further strengthen the region’s share. Ongoing replacement of older ropeway infrastructure provides additional long-term demand momentum.
Europe
Europe leads the global market with 34% share, supported by its extensive ropeway networks across the Alps, Pyrenees, and Dolomites. The region benefits from mature winter sports tourism, high ridership volumes, and continuous investment in technologically advanced gondolas and aerial tramways. Countries such as Switzerland, Austria, France, and Italy dominate installations, emphasizing safety-certified components, energy-efficient drive systems, and noise-optimized operations. Urban ropeways are also gaining traction in select European cities as sustainable mobility alternatives. Strong replacement demand, heritage infrastructure modernization, and long-standing engineering expertise underpin Europe’s dominant market position.
Asia-Pacific
Asia-Pacific holds 28% of the market, driven by rapid tourism development, expanding urban populations, and increasing adoption in mountainous and pilgrimage destinations. China and India lead installations with large-scale tourism corridors and new gondola projects designed to improve accessibility in high-altitude or road-constrained regions. Japan and South Korea continue upgrading systems to enhance safety and passenger comfort. Urban ropeway proposals are rising in densely populated cities seeking efficient, low-footprint transport solutions. Growing middle-class tourism, expanding eco-tourism initiatives, and government-backed infrastructure programs position APAC as a high-growth regional market.
Latin America
Latin America accounts for 9% of the global market, supported by strong adoption of aerial ropeways for urban mobility in topographically complex cities. Colombia and Bolivia lead deployments with widely recognized systems serving hillside communities and improving public transport integration. Mexico, Brazil, Chile, and Peru are expanding tourism-oriented installations that connect scenic or heritage sites. Despite budget constraints, public–private partnerships continue enabling new projects. Growing emphasis on reducing congestion and improving accessibility in low-income neighborhoods supports steady regional uptake. Ropeway projects in Latin America remain a model for cost-efficient urban transport innovation.
Middle East & Africa
The Middle East & Africa region represents 6% of the market, driven by tourism-focused projects, heritage-site accessibility initiatives, and luxury destination development. The UAE and Saudi Arabia are investing in advanced gondola systems as part of large-scale tourism and urban development programs under national vision strategies. African countries—such as Morocco and South Africa—use ropeways to enhance tourism appeal and connect hard-to-reach areas. Although adoption remains gradual due to funding limitations and technical capacity gaps, rising tourism investment and sustainable mobility initiatives continue to support the region’s growth trajectory.
Market Segmentations:
By Product Type
- Aerial Tramways
- Funicular Ropeways
- Chair Lifts
- Gondola Lifts
- Surface Lifts
- Material Ropeways
- Inclined Lifts
By End Use
- Tourism
- Public Transport
- Material Handling
By Geography
- North America
- Europe
- Germany
- France
- U.K.
- Italy
- Spain
- Rest of Europe
- Asia Pacific
- China
- Japan
- India
- South Korea
- South-east Asia
- Rest of Asia Pacific
- Latin America
- Brazil
- Argentina
- Rest of Latin America
- Middle East & Africa
- GCC Countries
- South Africa
- Rest of the Middle East and Africa
Competitive Landscape
The competitive landscape of the cable car and ropeways market is characterized by the presence of established global manufacturers, engineering specialists, and regional system integrators competing on technology, safety performance, and large-scale installation capability. Leading companies focus on expanding their portfolios with advanced gondola systems, detachable grips, high-capacity cabins, and energy-efficient drive technologies to support both tourism and urban mobility applications. Strategic partnerships with government authorities and infrastructure developers play a critical role in securing long-term projects, particularly in mountain transport corridors and emerging urban ropeway networks. Firms are also investing in digital monitoring platforms, automated evacuation systems, and predictive maintenance tools to enhance reliability and operational safety. As several regions prioritize modernization of aging ropeway assets, competitive differentiation increasingly hinges on lifecycle service offerings, customization flexibility, and compliance with rigorous international safety standards. The market continues to see strong bidding competition, especially for high-capacity public transport ropeway projects.
Shape Your Report to Specific Countries or Regions & Enjoy 30% Off!
Key Player Analysis
- Bartholet Maschinenbau AG (BMF)
- Bullwheel International Cable Car Corp.
- Leitner-Poma of America, Inc.
- Dubrovnik Cable Cars
- MND Group
- Damodar Ropeways & Infra Ltd.
- STM Teleferik
- Nippon Cable Co., Ltd.
- CONVEYOR & ROPEWAY SERVICES PVT. LTD.
- CCM FINOTELLO SRL
Recent Developments
- In May 2024, Jordan Free and Development Zones Group (JFDZG) unveiled its new website for the Ajloun cable car, a digital platform aimed at improving the booking experience for tourists by providing convenient access to information and appealing engagement for international and domestic visitors.
- In January 2024, the inauguration of the Neemach Mata Mandir ropeway was announced by Damodar Ropeways and Infra Ltd Udaipur, India. The ropeway uses a mono cable fixed grip system, potentially transporting 400 passengers per hour
Report Coverage
The research report offers an in-depth analysis based on Product type, End-Use and Geography. It details leading market players, providing an overview of their business, product offerings, investments, revenue streams, and key applications. Additionally, the report includes insights into the competitive environment, SWOT analysis, current market trends, as well as the primary drivers and constraints. Furthermore, it discusses various factors that have driven market expansion in recent years. The report also explores market dynamics, regulatory scenarios, and technological advancements that are shaping the industry. It assesses the impact of external factors and global economic changes on market growth. Lastly, it provides strategic recommendations for new entrants and established companies to navigate the complexities of the market.
Future Outlook
- Urban mobility agencies will increasingly integrate ropeways into public transport networks to improve last-mile connectivity and reduce road congestion.
- Tourism authorities will continue investing in long-span gondolas to enhance accessibility to remote scenic destinations and support year-round visitor traffic.
- Advancements in automation, predictive maintenance, and digital monitoring will strengthen operational reliability and reduce downtime.
- Energy-efficient drive systems and regenerative braking technologies will become standard as operators focus on sustainability and reduced operating costs.
- Replacement of aging installations will accelerate, driven by stricter international safety regulations and modernization needs.
- Demand for high-capacity cabins and detachable grip systems will rise as operators target faster throughput and improved comfort.
- Public–private partnerships will expand, supporting large-scale ropeway deployments in both developed and emerging markets.
- Multi-modal integration with metro and bus networks will grow, making ropeways more viable as mainstream urban transit solutions.
- Emerging economies will adopt ropeways to address mobility challenges in hilly, densely populated, or infrastructure-scarce regions.
- Innovation in smart cabins, including climate control and onboard connectivity, will enhance passenger experience and open new commercial opportunities.


