
Chromoendoscopy Agents Market Overview:
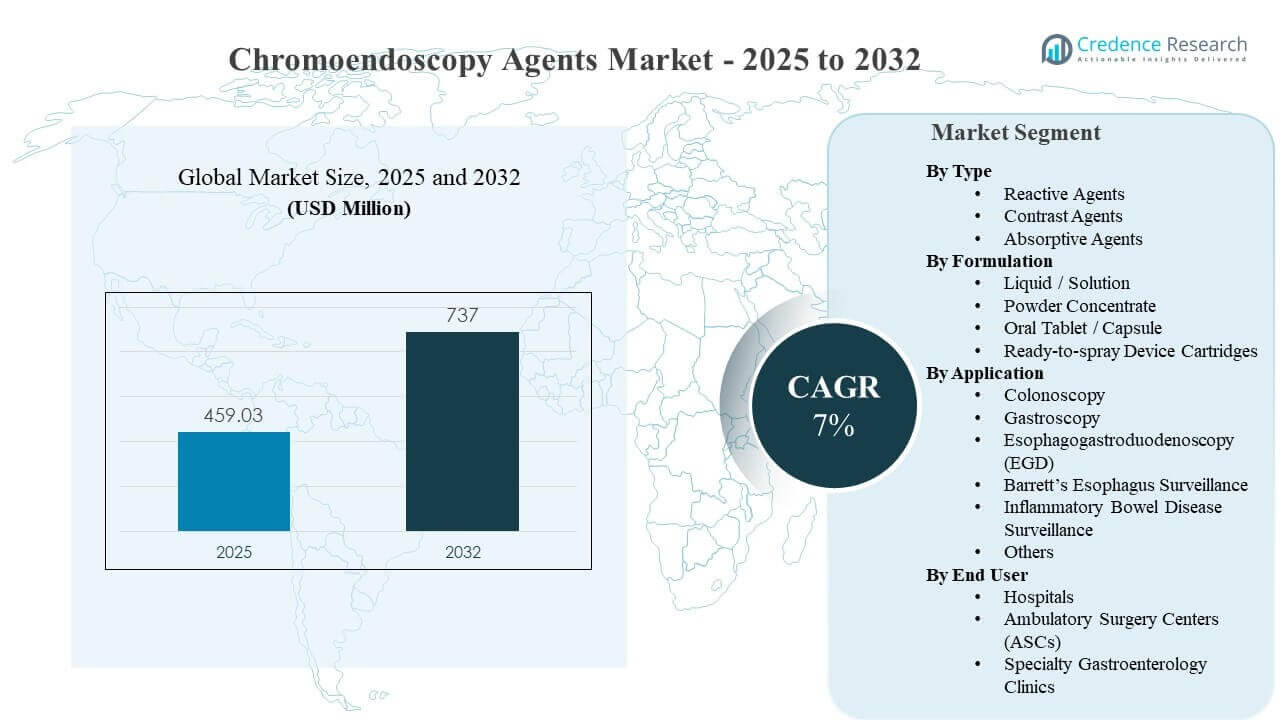
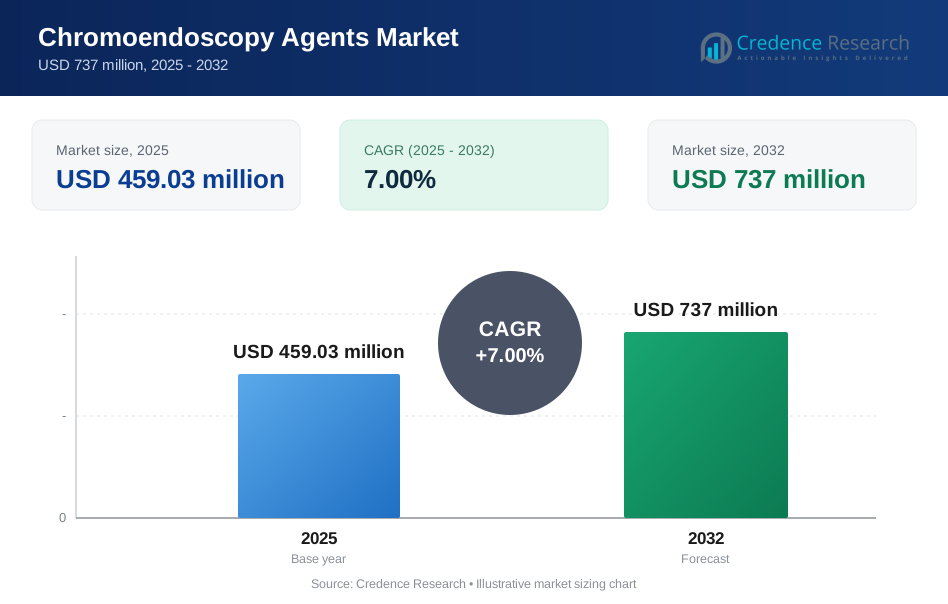
The global Chromoendoscopy Agents Market size was estimated at USD 459.03 million in 2025 and is expected to reach USD 737 million by 2032, growing at a CAGR of 7% from 2025 to 2032. Growth is primarily driven by the rising clinical and quality focus on improving mucosal visualization during endoscopic screening and surveillance, which increases utilization of dye-based or contrast-enhancing techniques in routine workflows. Expansion of outpatient endoscopy capacity and modernization of endoscopy suites across major regions further supports adoption of chromoendoscopy agents in high-volume GI procedures.
| REPORT ATTRIBUTE | DETAILS |
|---|---|
| Historical Period | 2020-2024 |
| Base Year | 2025 |
| Forecast Period | 2026-2032 |
| Chromoendoscopy Agents Market Size 2025 | USD 459.03 million |
| Chromoendoscopy Agents Market, CAGR | 7% |
| Chromoendoscopy Agents Market Size 2032 | USD 737 million |
Key Market Trends & Insights
- North America accounted for 35.9% of 2025 revenue, supported by high screening penetration and advanced endoscopy infrastructure.
- Asia Pacific represented 27.8% of 2025 revenue, benefiting from expanding procedure capacity and growing demand for early GI cancer detection.
- Liquid / Solution led formulation with 51.2% share in 2025, reflecting procedural familiarity and ease of titration during endoscopy.
- Colonoscopy held 49.3% share in 2025, as colorectal screening remains the highest-volume use case for contrast enhancement.
- Hospitals accounted for 47.1% share in 2025, due to complex case mix, higher throughput endoscopy units, and integrated pathology pathways.
Segment Analysis
Chromoendoscopy agents demand is shaped by procedure standardization in GI suites and the clinical objective of improving lesion conspicuity during screening and surveillance. Adoption is strongest where quality metrics prioritize detection and where facilities have consistent staff training for dye preparation and application. Formulation choice increasingly aligns with workflow efficiency, including reduced setup steps and standardized dosing. Buyer preference typically favors products that are easy to store, prepare, and administer without interrupting procedure time.
Application dynamics are led by colorectal procedures, but surveillance indications in chronic disease pathways support incremental volume growth. Sites seek solutions that improve visualization consistency across operators, reduce variability, and support targeted assessment of suspicious mucosa. End-user expansion toward ambulatory settings increases demand for simplified formats, predictable supply, and easy-to-use delivery options. Overall segment momentum is reinforced by rising endoscopy volumes and the shift toward structured surveillance programs.
By Type Insights
Contrast Agents accounted for the largest share of 34.6% in 2025. Demand is supported by broad procedural familiarity and established use in improving mucosal contrast during routine GI examinations. Clinical teams value predictable staining behavior that integrates smoothly into standard workflows without extensive additional training. Utilization is further reinforced by high screening volumes where incremental visibility improvements can support consistent lesion identification.
By Formulation Insights
Liquid / Solution accounted for the largest share of 51.2% in 2025. This format remains preferred because it enables real-time control of concentration and coverage during procedures. Liquid handling is widely embedded in endoscopy room preparation routines, supporting rapid adoption and repeat purchasing. Procurement decisions also favor stable supply and packaging that reduces waste, improves shelf management, and supports consistent performance.
By Application Insights
Colonoscopy accounted for the largest share of 49.3% in 2025. High procedure volume and screening-led demand make colonoscopy the most consistent driver for chromoendoscopy agent utilization. Providers prioritize visibility enhancement to support identification of subtle lesions, particularly in surveillance and high-risk cohorts. Standardized practice patterns, strong referral pipelines, and quality initiatives help sustain repeat demand and broaden routine usage in GI centers.
By End User Insights
Hospitals accounted for the largest share of 47.1% in 2025. Large facilities typically run high-throughput endoscopy units and manage more complex diagnostic pathways that can increase use of visualization-enhancing agents. Hospital purchasing also benefits from established formularies, centralized procurement, and integrated pathology workflows. At the same time, procedure migration to lower-cost sites encourages hospitals to emphasize efficiency, consistency, and clinical performance in selection criteria.
Market Drivers
Rising endoscopy screening and surveillance volumes
Screening programs for colorectal disease and structured surveillance pathways expand overall endoscopy procedure counts, increasing the addressable demand for chromoendoscopy agents. Higher throughput in GI suites strengthens routine use of visualization enhancement tools that fit into standardized workflows. Providers increasingly align procedure protocols with quality expectations, supporting consistent consumption. As facilities expand capacity, purchasing decisions favor products that are easy to prepare, predictable in use, and reliable in supply.
Quality focus on lesion detection and visualization consistency
Clinical emphasis on improving mucosal visualization supports adoption of dyes and contrast approaches that reduce operator variability. Facilities seeking more consistent detection outcomes prefer solutions that integrate smoothly into standard endoscopy practice. This quality-driven approach also supports training and protocol development, which increases repeat utilization. Vendors that provide predictable staining behavior and operational simplicity benefit as buyers prioritize performance consistency across different operators and sites.
- For instance, Fujifilm’s ELUXEO 8000 endoscopic imaging system delivers 4K resolution and triple noise reduction (3NR), while enabling clinicians to switch among three enhanced imaging modes LCI, BLI, and the newly introduced ACI mode to support more consistent lesion visualization and characterization across operators.
Expansion of outpatient endoscopy and cost-efficient care settings
Growth in ambulatory procedure settings increases demand for products that reduce preparation time and simplify delivery. Outpatient centers typically focus on throughput and reproducibility, encouraging adoption of standardized formats and easy handling. This setting shift also expands procurement among specialized GI clinics and ASCs that run high procedure volumes. As outpatient infrastructure grows, supply reliability and convenient packaging become more important purchasing factors.
- For instance, PENTAX Medical reported that its I-DEC duodenoscope design reduced persistent microbial contamination from 11.2% to 3.8%, a 66% reduction in contamination risk, while maintaining ERCP technical success at 94.6% versus 90.7% for standard scopes, reinforcing the value of reproducible and safety-oriented endoscopy technology in efficient care settings.
Broader access to modern endoscopy infrastructure and workflow upgrades
Investment in modern endoscopy suites and supporting infrastructure improves procedural capability across regions, enabling wider adoption of enhanced visualization techniques. Workflow upgrades emphasize speed, standardization, and consistent outcomes, which supports demand for chromoendoscopy agents. Facilities also seek solutions compatible with routine disinfection, storage, and handling practices. Expanding access to trained staff and endoscopy services strengthens market penetration, especially in fast-developing healthcare systems.
Market Challenges
Clinical adoption can be limited by workflow friction, including additional preparation steps, variability in staining technique, and inconsistent operator training. In high-throughput environments, incremental steps can be perceived as disruptive unless protocols are standardized and staff are well trained. Procurement teams may also face constraints when products require specialized handling, storage, or delivery accessories. These operational barriers can slow uptake outside leading GI centers and large hospitals.
- For instance, in a multicentre real-life chromoendoscopy study using Olympus’s PW-5V1 dye spray catheter for 0.4% indigo carmine delivery, the protocol required segment-by-segment pancolonic spraying and timed withdrawal from the caecum, illustrating how dye-based visualization adds defined workflow steps that depend on operator consistency.
Pricing pressure and reimbursement sensitivity can constrain premiumization, particularly in cost-focused outpatient settings and in regions with uneven funding for screening programs. Facilities may prioritize lower-cost alternatives or reduce routine usage if incremental clinical value is not consistently demonstrated across operators. Supply consistency and quality assurance also matter because shortages or variability can disrupt standardized protocols. Competitive substitution from alternative visualization techniques can further challenge sustained adoption in some segments.
Market Trends and Opportunities
Demand is trending toward formats and packaging that simplify room preparation and reduce variability, which supports broader adoption across outpatient sites. Providers increasingly prefer standardized dosing, easy storage, and fast setup to protect procedure throughput. This creates opportunity for delivery formats that minimize handling steps and support consistent application across different operators. Companies that align product design with GI suite workflow constraints can strengthen placement and repeat purchasing.
- For instance, Medtronic’s Nexpowder endoscopic hemostasis system uses a battery-powered delivery platform rather than CO2 propulsion, is supplied with a 220 cm catheter, and was supported in FDA-cleared documentation by 3-year accelerated aging tests for the powder and delivery components; the same filing also reported immediate hemostasis rates ranging from 94% to 100% across cited clinical datasets, which directly supports claims around standardized setup, storage practicality, and consistent procedural use.
Another opportunity lies in expanding use across surveillance indications where enhanced visualization can support more structured decision-making and targeted assessment. Growth in specialty GI clinics and outpatient networks increases the number of procurement points and encourages portfolio standardization across multi-site systems. Training support, protocol compatibility, and supply reliability become differentiators in these networks. Vendors that build strong clinical adoption pathways and dependable distribution can gain share as volumes expand.
Regional Insights
North America
North America held 35.9% of 2025 revenue, supported by strong screening penetration, high endoscopy capacity, and broad availability of specialized GI services. Adoption is reinforced by hospital networks and specialty clinics that standardize protocols across facilities. Buyers typically prioritize product reliability, ease of use, and consistent visualization performance to protect throughput. Competitive intensity is higher due to established procurement processes and preference for proven clinical workflows.
Europe
Europe accounted for 23.4% of 2025 revenue, supported by mature healthcare systems and established GI surveillance pathways. Demand is strengthened by structured referral patterns and provider emphasis on consistent diagnostic quality. Procurement decisions often focus on standardization, training alignment, and consistent supply, particularly in larger hospital systems. Uptake is strongest in countries with high endoscopy volumes and well-developed screening initiatives.
Asia Pacific
Asia Pacific represented 27.8% of 2025 revenue, driven by expanding endoscopy infrastructure and rising focus on earlier detection of GI disease. Growth is supported by capacity additions in urban hospital systems and increasing penetration of specialty GI services. Buyers often balance performance goals with cost efficiency, favoring formats that reduce preparation time and waste. As outpatient networks expand, demand for simplified, standardized usage protocols continues to rise.
Latin America
Latin America held 8.6% of 2025 revenue, with demand concentrated in large private hospitals and higher-capability urban centers. Screening penetration and endoscopy capacity are improving, but access remains uneven, shaping purchasing volumes. Facilities tend to prioritize availability and cost-effective solutions that fit existing workflows. Expansion of private care networks and modernization of GI services can gradually increase adoption over the forecast period.
Middle East & Africa
Middle East & Africa accounted for 4.3% of 2025 revenue, with demand concentrated in countries investing in advanced hospital infrastructure. Uptake is strongest where specialist GI services and endoscopy capacity are expanding. Procurement often emphasizes supply reliability and ease of implementation due to variability in service maturity across the region. Wider adoption depends on continued infrastructure development and broader access to endoscopy services.
Competitive Landscape
The Chromoendoscopy Agents Market is characterized by competition focused on product reliability, formulation handling advantages, and fit with endoscopy suite workflows. Suppliers differentiate through consistent performance, packaging and delivery convenience, and the ability to support protocol standardization across multi-site provider networks. Distribution strength and dependable supply chains are key factors because procedure schedules depend on uninterrupted availability. Competitive positioning also benefits from clinical education and operational support that reduce variability in use and improve adoption across facilities.
Cosmo Pharmaceuticals N.V. is positioned around specialized diagnostic solutions that emphasize workflow compatibility and adoption support in routine endoscopy settings. The company’s focus on enabling practical implementation alongside clinical needs supports deployment across screening and surveillance pathways. Market traction strengthens when products reduce procedure friction and align with provider priorities such as speed, consistency, and ease of use. Strong commercialization execution across regions can further improve adoption depth in high-volume GI environments.
The industry research and growth report includes detailed analyses of the competitive landscape of the market and information about key companies, including:
- Cosmo Pharmaceuticals N.V.
- American Regent, Inc.
- Provepharm Life Solutions
- Daiichi Sankyo Co., Ltd.
- Macsen Laboratories
- Bracco Diagnostics Inc.
- FUJIFILM Wako Pure Chemical Corporation
- Thermo Fisher Scientific Inc.
- Merck KGaA
- BD (Becton, Dickinson and Company)
- C2 Pharma
- Otsuka Pharmaceutical Co., Ltd.
Qualitative and quantitative analysis of companies has been conducted to help clients understand the wider business environment as well as the strengths and weaknesses of key industry players. Data is qualitatively analyzed to categorize companies as pure play, category-focused, industry-focused, and diversified; it is quantitatively analyzed to categorize companies as dominant, leading, strong, tentative, and weak.
Recent Developments
- In May 2025, Cosmo announced that Endovision Limited received EU MDR certification for Cerebro, a real-time AI-powered guide for esophagogastroduodenoscopy, and Cosmo described the move as part of its advanced real-time AI ecosystem in endoscopy.
- In February 2025, FUJIFILM Healthcare Americas partnered with EndoSim to expand access to EndoGel, an endoscopy training model used for advanced procedures such as ESD and POEM, with Fujifilm transferring its exclusive U.S. distributorship of the product to EndoSim.
Report Scope
| Report Attribute | Details |
| Market size value in 2025 | USD 459.03 million |
| Revenue forecast in 2032 | USD 737 million |
| Growth rate (CAGR) | 7% (2025–2032) |
| Base year | 2025 |
| Forecast period | 2026-2032 |
| Quantitative units | USD million |
| Segments covered | By Type Outlook; By Formulation Outlook; By Application Outlook; By End User Outlook |
| Regional scope | North America, Europe, Asia Pacific, Latin America, Middle East & Africa |
| Key companies profiled | Cosmo Pharmaceuticals N.V.; American Regent, Inc.; Provepharm Life Solutions; Daiichi Sankyo Co., Ltd.; Macsen Laboratories; Bracco Diagnostics Inc.; FUJIFILM Wako Pure Chemical Corporation; Thermo Fisher Scientific Inc.; Merck KGaA; BD (Becton, Dickinson and Company); C2 Pharma; Otsuka Pharmaceutical Co., Ltd. |
| No. of Pages | 328 |
Segmentation
BY TYPE
- Reactive Agents
- Contrast Agents
- Absorptive Agents
BY FORMULATION
- Liquid / Solution
- Powder Concentrate
- Oral Tablet / Capsule
- Ready-to-spray Device Cartridges
BY APPLICATION
- Colonoscopy
- Gastroscopy
- Esophagogastroduodenoscopy (EGD)
- Barrett’s Esophagus Surveillance
- Inflammatory Bowel Disease Surveillance
- Others
BY END USER
- Hospitals
- Ambulatory Surgery Centers (ASCs)
- Specialty Gastroenterology Clinics
BY REGION
- North America
- U.S.
- Canada
- Mexico
- Europe
- Germany
- France
- U.K.
- Italy
- Spain
- Rest of Europe
- Asia Pacific
- China
- Japan
- India
- South Korea
- South-east Asia
- Rest of Asia Pacific
- Latin America
- Brazil
- Argentina
- Rest of Latin America
- Middle East & Africa
- GCC Countries
- South Africa
- Rest of the Middle East and Africa
Request a Free Sample
Fill in your details and we'll send you a free sample report.
- Sample data tables & charts
- Research methodology
Need a Custom Version of This Report?
Tailor the scope, geography, or segments to your exact requirements.
- Custom geography or segment scope
- Direct access to our analyst team
Frequently Asked Questions
What is the market size of the Chromoendoscopy Agents Market in 2025 and its forecast for 2032?
What is the CAGR of the Chromoendoscopy Agents Market during 2025–2032?
Which segment holds the largest share in 2025?
What factors are driving growth in the Chromoendoscopy Agents Market?
Who are the leading companies in the Chromoendoscopy Agents Market?
Which region leads the market in 2025?
Table of Content
Chapter 1. Report Introduction
- 1.1 Report Description & Purpose
- 1.1.1 Report Title & Market Definition
- 1.1.2 Unique Selling Propositions (USP) & Key Differentiators
- 1.1.3 Value Proposition for Stakeholders
- 1.2 Research Objectives
- 1.2.1 Market Sizing Objectives (Volume & Revenue)
- 1.2.2 Segmentation Objectives
- 1.2.3 Competitive Intelligence Objectives
- 1.2.4 Forecast & Scenario Objectives
- 1.3 Report Scope
- 1.3.1 Chromoendoscopy Agents Scope – Types & Subtypes Covered
- 1.3.2 Geographic Scope – Regions & Countries Covered
- 1.3.3 Historical Period, Base Year & Forecast Period (2025; forecast to 2032)
- 1.3.4 Inclusions & Exclusions
- 1.4 HS Code & Classification Framework
- 1.5 Currency, Units & Pricing Basis
- 1.6 Target Stakeholders
- 1.7 Limitations & Assumptions
Chapter 2. Executive Summary
- 2.1 Global Chromoendoscopy Agents Market Snapshot
- 2.1.1 Market Size – Historical (2025) & Forecast (2025-2032) (2025: USD 459.03 million → 2032: USD 737 million)
- 2.1.2 Volume & Revenue – Global Totals
- 2.1.3 Key Market Highlights – Top Five Facts
- 2.2 Chromoendoscopy Agents Market Segmentation Snapshot
- 2.2.1 Market Split by Region – 2025 vs. 2032
- 2.3 Competitive Snapshot
- 2.3.1 Top 10 Players by Revenue Share – 2025
- 2.3.2 Top 10 Players by Volume Share – 2025
- 2.3.3 Recent Strategic Developments (18-Month Summary)
- 2.4 Key Investment Highlights & Strategic Conclusions
Chapter 3. Chromoendoscopy Agents Market Dynamics & Industry Analysis
- 3.1 Market Overview & Context
- 3.1.1 Chromoendoscopy Agents Market Position in the Broader Automotive Value Chain
- 3.1.2 OEM vs. Replacement Market Dynamics
- 3.1.3 Market Maturity & Development Stage by Region
- 3.2 Chromoendoscopy Agents Market Drivers
- 3.3 Chromoendoscopy Agents Market Restraints & Challenges
- 3.4 Chromoendoscopy Agents Market Opportunities
- 3.5 Porter's Five Forces Analysis
- 3.5.1 Threat of New Entrants
- 3.5.2 Bargaining Power of Suppliers
- 3.5.3 Bargaining Power of Buyers
- 3.5.4 Threat of Substitutes
- 3.5.5 Competitive Rivalry – Intensity Assessment
- 3.6 Chromoendoscopy Agents Value Chain Analysis
- 3.6.1 Upstream – Raw Material/Input Suppliers
- 3.6.1.1 Raw Material/Input 1
- 3.6.1.2 Raw Material/Input 2
- 3.6.1.3 Raw Material/Input 3
- 3.6.2 Midstream – Production/Manufacturing/Service Delivery
- 3.6.2.1 Production/Process Overview
- 3.6.2.2 Key Facility Locations & Capacity by Manufacturer
- 3.6.3 Downstream – Distribution & End Consumer
- 3.6.3.1 Primary Channel – B2B/OEM
- 3.6.3.2 Secondary Channels – Dealer, Retail, Online, Direct
- 3.6.4 Value Chain Profitability Analysis
- 3.6.1 Upstream – Raw Material/Input Suppliers
- 3.7 PESTEL Analysis
- 3.7.1 Political Factors
- 3.7.2 Economic Factors
- 3.7.3 Social Factors
- 3.7.4 Technological Factors
- 3.7.5 Environmental Factors
- 3.7.6 Legal Factors
- 3.8 Chromoendoscopy Agents Supply Chain Analysis
- 3.8.1 Raw Material/Input Supply Risk Assessment
- 3.8.2 Manufacturing Concentration Risk (Geographic Exposure)
- 3.8.3 Trade Disruption Impact Analysis
- 3.9 Regulatory & Policy Landscape
Note: The regulatory and policy landscape section covers regulations based on their applicability to the market, Chromoendoscopy Agents category, geography, and scope of the study. Only regulatory frameworks with a material impact on operations, compliance, trade, sustainability, or market access are analyzed in detail.
Chapter 4. Key Investment Pockets & Opportunity Analysis
- 4.1 Chromoendoscopy Agents Market Attractiveness Analysis
- 4.1.1 By Region – Investment Attractiveness Matrix (Volume × CAGR)
- 4.2 Absolute Revenue Growth Opportunity
- 4.2.1 By Region – Absolute USD Growth Through 2032
- 4.3 Incremental Volume Opportunity
- 4.3.1 By Region – Incremental Volume Through 2032
- 4.3.2 Segment – Incremental Volume
- 4.4 Emerging Submarket Opportunity Deep Dive (Subject to Applicability)
- 4.5 Emerging Market Opportunity Scorecards
- 4.5.1 United States
- 4.5.2 Europe
- 4.5.3 Asia
- 4.5.4 Middle East & Africa
Note: Emerging Market Opportunity Scorecards will be included based on relevance and strategic importance. Regions listed are indicative and may vary depending on data availability and market dynamics.
Chapter 5. Chromoendoscopy Agents Import-Export Analysis & Trade Flows
- 5.1 Global Trade Overview
- 5.1.1 Global Export Value by Country (2025)
- 5.1.2 Global Export Volume by Country (2025)
- 5.1.3 Global Import Value by Country (2025)
- 5.1.4 Global Import Volume by Country (2025)
- 5.1.5 Net Trade Balance by Country (2025)
- 5.2 Export Analysis – Segment
- 5.2.1 Type 1 (HS Code)
- 5.2.2 Type 2 (HS Code)
- 5.2.3 Type 3 (HS Code)
- 5.2.4 Type 4 (HS Code)
- 5.2.5 Type 5 (HS Code)
- 5.3 Import Analysis – Segment
- 5.3.1 Type 1 (HS Code)
- 5.3.2 Type 2 (HS Code)
- 5.3.3 Type 3 (HS Code)
- 5.3.4 Type 4 (HS Code)
- 5.3.5 Type 5 (HS Code)
- 5.4 Average Unit Trade Prices
- 5.4.1 Average Export Price – Segment & Country
- 5.4.2 Average Import Price – Segment & Source Country
- 5.4.3 Price Trends (2025)
- 5.5 Key Trade Route Analysis
- 5.5.1 Trade Route 1
- 5.5.2 Trade Route 2
- 5.5.3 Trade Route 3
- 5.5.4 Trade Route 4
- 5.5.5 Trade Route 5
- 5.6 Trade Policy Impact Assessment
- 5.6.1 US Anti-Dumping & Section 301 Tariffs
- 5.6.2 EU Customs Union Impact
- 5.6.3 Major Free Trade Agreements
- 5.6.4 USMCA Rules of Origin
Note: Trade policy analysis will be included only where relevant to the Chromoendoscopy Agents market.
Chapter 6. Competitive Landscape & Company Benchmarking
- 6.1 Chromoendoscopy Agents Market Concentration & Structure
- 6.1.1 Herfindahl-Hirschman Index (HHI) – vs. 2025
- 6.1.2 Tier 1, Tier 2 & Tier 3 Market Structure
- 6.1.3 Global, Regional & Local Player Dynamics
- 6.2 Chromoendoscopy Agents Market Share Analysis – 2025
- 6.2.1 Global Revenue Share by Company
- 6.2.2 Global Volume Share by Company
- 6.2.3 Regional Revenue Share
- 6.2.4 Market Share Evolution ( vs. 2025)
- 6.2.5 OEM Segment Share by Company
- 6.2.6 Replacement Segment Share by Company
- 6.3 Production/Delivery Capacity & Facility Analysis
- 6.3.1 Global Installed Capacity
- 6.3.2 Capacity Utilization Rates
- 6.3.3 Production/Output Volume
- 6.3.4 Facility Locations & Capacity Map
- 6.3.5 Planned Capacity Additions
- 6.4 Chromoendoscopy Agents Competitive Benchmarking Matrix
- 6.4.1 Revenue, Volume, CAGR & Profitability Comparison
- 6.4.2 Channel Revenue Mix
- 6.4.3 Geographic Revenue Exposure
- 6.4.4 R&D Intensity
- 6.4.5 Sustainability Maturity
- 6.5 Strategic Developments in Chromoendoscopy Agents (Last 24 Months)
- 6.5.1 Mergers, Acquisitions & Divestments
- 6.5.2 New Chromoendoscopy Agents Launches
- 6.5.3 Facility Expansions
- 6.5.4 Strategic Alliances, Joint Ventures & Partnerships
- 6.5.5 Distribution Expansion & Market Entry
- 6.5.6 Sustainability & ESG Initiatives
- 6.6 Competitive Strategy Mapping
- 6.6.1 Leader, Challenger, Follower & Niche Classification
- 6.6.2 Pricing Strategy Comparison
- 6.6.3 Channel Strategy Matrix
Note: Strategic developments are included based on their materiality and the availability of reliable information.
Chapter 7. Global Chromoendoscopy Agents Market – By Distribution Channel
- 7.1 Segment Overview
- 7.1.1 Volume & Revenue Split by Channel (2025 & 2032)
- 7.1.2 Channel Mix Evolution (2025-2032)
Chapter 8. Regional Market Analysis – Global Overview
- 8.1 Global Regional Overview
- 8.1.1 Regional Volume Share
- 8.1.2 Regional Revenue Share
- 8.1.3 Regional Volume by Region
- 8.1.4 Regional Revenue by Region
- 8.1.5 Regional Forecast Through 2032
- 8.2 Cross-Regional Segment Analysis
- 8.2.1 By Distribution Channel
- 8.2.2 By Brand/Price Tier
Chapter 9. North America Chromoendoscopy Agents Market
- 9.1 United States
- 9.2 Canada
- 9.3 Mexico
Chapter 10. Europe Chromoendoscopy Agents Market
- 10.1 Germany
- 10.2 France
- 10.3 Italy
- 10.4 United Kingdom
- 10.5 Spain
- 10.6 Poland
- 10.7 Russia
- 10.8 Netherlands
- 10.9 Belgium
- 10.10 Sweden
- 10.11 Denmark
- 10.12 Norway
- 10.13 Rest of Europe
Chapter 11. Asia Pacific Chromoendoscopy Agents Market
- 11.1 China
- 11.2 India
- 11.3 Japan
- 11.4 South Korea
- 11.5 Thailand
- 11.6 Indonesia
- 11.7 Vietnam
- 11.8 Malaysia
- 11.9 Australia
- 11.10 Rest of Asia Pacific
Chapter 12. Latin America Chromoendoscopy Agents Market
- 12.1 Brazil
- 12.2 Argentina
- 12.3 Colombia
- 12.4 Chile
- 12.5 Rest of Latin America
Chapter 13. Middle East Chromoendoscopy Agents Market
- 13.1 Saudi Arabia
- 13.2 United Arab Emirates
- 13.3 Turkey
- 13.4 Israel
- 13.5 Iran
- 13.6 Rest of the Middle East
Chapter 14. Africa Chromoendoscopy Agents Market
- 14.1 South Africa
- 14.2 Egypt
- 14.3 Nigeria
- 14.4 Morocco
- 14.5 Rest of Africa
Chapter 15. Chromoendoscopy Agents Company Profiles
- 15.1 [Company 01]
- 15.1.1 Company Overview
- 15.1.2 Key Management Personnel
- 15.1.3 Products & Services Portfolio
- 15.1.4 Financial Performance
- 15.1.5 Key Market Focus & Geographic Presence
- 15.1.6 Recent Developments & Strategic Initiatives
Note: The company profile list is preliminary and may change based on research findings, market developments, data availability, and client requirements.
Chapter 16. Appendices
- Appendix A – List of Abbreviations & Acronyms
- Appendix B – Industry Classification Code Reference – Full Series
- Appendix C – Production & Capacity Data Tables
- Appendix D – End-Use & Demand Base Tables
- Appendix E – Consumption & Replacement Rate Assumptions
- Appendix F – ASP Reference Tables
- Appendix G – Manufacturing & Facility Database
- Appendix H – Import-Export Data Tables
- Appendix I – Regulatory Summary Tables
- Appendix J – Primary Research Participant List (Anonymized)
- Appendix K – Primary Research Questionnaire Framework
- Appendix L – Data Sources & Bibliography
- Appendix M – Market Size Divergence & Source Comparison
Chapter 17. Research Methodology
- 17.1 Research Framework & Philosophy
- 17.2 Secondary Research – Sources, Hierarchy & Data Extraction
- 17.3 Data Modeling – Bottom-Up & Top-Down Market Sizing
- 17.4 Primary Research – Stakeholder Framework, LOI & Sample Sizes
- 17.5 Forecast Methodology – Regression, Scenario & Sensitivity Analysis
- 17.6 Quality Control – Four-Layer Validation Framework
- 17.7 Limitations & Standard Assumptions
- 17.8 Disclaimer
