
Commercial Charbroiler Market Overview:
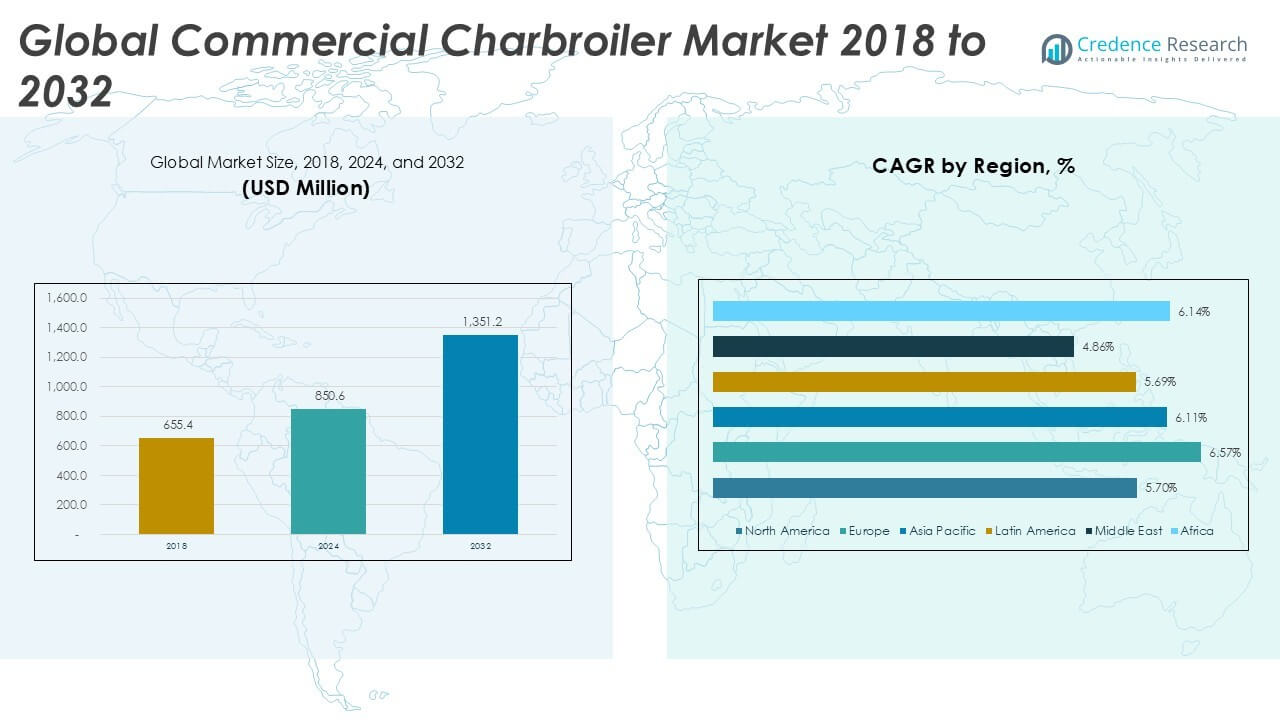
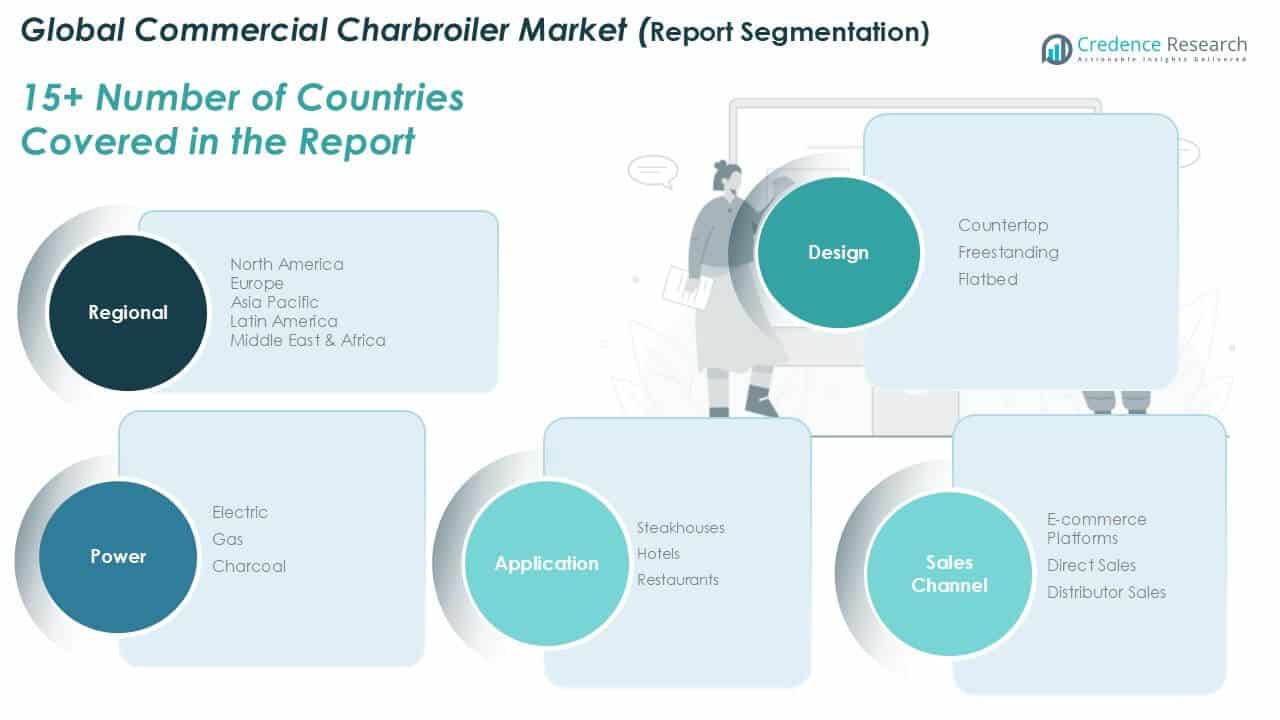
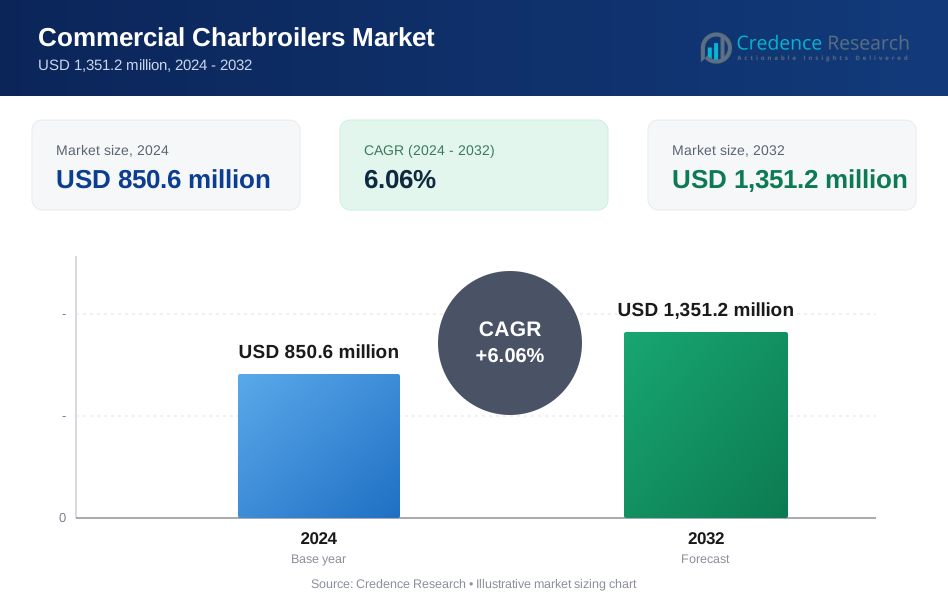
The Global Commercial Charbroiler Market size was valued at USD 655.4 million in 2018 to USD 850.6 million in 2024 and is anticipated to reach USD 1,351.2 million by 2032, at a CAGR of 6.06% during the forecast period.
| REPORT ATTRIBUTE | DETAILS |
|---|---|
| Historical Period | 2020-2023 |
| Base Year | 2024 |
| Forecast Period | 2025-2032 |
| Commercial Charbroiler Market Size 2024 | USD 850.6 million |
| Commercial Charbroiler Market, CAGR | 6.06% |
| Commercial Charbroiler Market Size 2032 | USD 1,351.2 million |
The global commercial charbroiler market is led by key players such as Avantco Equipment, Middleby, Garland Group Ltd, The Vollrath Company LLC, and Star Manufacturing. These companies dominate through extensive product lines, global distribution, and consistent innovation in energy efficiency and design flexibility. Avantco and Middleby are particularly strong in North America, which holds a 23.6% share of the global market in 2024. Garland and Vollrath maintain strong positions in both Europe and the U.S., while emerging brands like Dukers Appliance Co. expand across Asia Pacific. The competitive landscape is shaped by investments in smart cooking technologies and modular equipment solutions.
Commercial Charbroiler Market Insights
- The global commercial charbroiler market was valued at USD 850.6 million in 2024 and is projected to reach USD 1,351.2 million by 2032, growing at a CAGR of 6.06%.
- Demand from quick-service restaurants and casual dining chains is rising, driven by the need for fast, high-volume grilling solutions.
- Modular, energy-efficient, and ventless charbroilers are gaining popularity, especially in urban kitchens with space and ventilation limitations.
- Key players like Avantco Equipment, Middleby, and Garland Group Ltd dominate through broad portfolios and innovation, while regional players gain ground via cost-effective solutions.
- Asia Pacific leads with 34.1% market share in 2024, followed by Europe at 27.8% and North America at 23.6%; the Gas segment holds the largest power share, while Countertop models lead by design.
Commercial Charbroiler Market Segmentation Analysis:
By Design:
The Countertop segment holds the dominant share in the global commercial charbroiler market by design. Its compact structure, lower cost, and easy installation make it ideal for small and medium-sized kitchens. Quick-service restaurants and food trucks increasingly adopt countertop units to optimize space while maintaining high cooking efficiency. The growing demand for space-saving equipment in urban commercial kitchens further supports this segment’s lead. While Freestanding units offer higher cooking capacities suited for larger establishments, the Flatbed design sees moderate use in specialized applications with flat grilling preferences.
- For instance, MagiKitch'N CM‑RMB‑624CR 24″ Countertop Gas Radiant Charbroiler is a radiant gas countertop charbroiler designed for compact commercial kitchens, offering focused heating with a smaller footprint suited to QSRs and food trucks.
By Power Segment:
Gas-powered charbroilers lead the market in the power segment, accounting for the largest revenue share. Their faster heat-up time, cost-efficiency, and high temperature control make them preferred in high-volume operations like steakhouses and restaurants. Gas units are especially popular in regions with stable natural gas availability and infrastructure. The Electric segment is gaining traction in regions with strict emission norms and indoor ventilation restrictions, driven by safety and energy regulation compliance. Charcoal-based charbroilers appeal to niche operators seeking smoky flavors but are less favored due to cleanup challenges and inconsistent heat control.
- For instance, gas countertop charbroilers with multiple burners deliver intense heat for rapid searing and consistent cooking, as seen in commercial radiant models described in industry guides.
By Application Segment:
Restaurants dominate the commercial charbroiler market by application, holding the highest revenue share globally. Their diverse menus and high foot traffic demand fast, consistent, and high-volume grilling solutions, making charbroilers essential kitchen equipment. The rise of casual dining chains and foodservice expansion in emerging markets further fuels this demand. Steakhouses follow closely, leveraging charbroilers to deliver high-temperature searing and smoky flavor essential for premium meats. Hotels adopt these units primarily in large-scale food operations, but represent a smaller market share due to fewer installations per location compared to restaurants.
Commercial Charbroiler Market Key Growth Drivers
Rising Demand from Quick-Service Restaurants (QSRs)
The global surge in fast-food consumption has led to a growing number of quick-service restaurants worldwide, significantly driving demand for commercial charbroilers. QSRs prioritize high-efficiency cooking solutions to meet rapid service requirements and consistent food quality. Charbroilers support high-throughput operations, enabling fast grilling of meats and vegetables without compromising taste. Their compact variants, such as countertop models, suit urban locations with limited kitchen space. The increasing number of QSR chains across developing economies, such as India, Indonesia, and Brazil, further accelerates demand. Additionally, franchise models adopted by global chains like McDonald’s and Burger King ensure consistent kitchen equipment use, reinforcing charbroiler installations globally. The focus on operational speed, cost efficiency, and compact layouts makes charbroilers a preferred appliance across high-traffic food chains, ensuring long-term adoption.
- For instance, McDonald’s standardized kitchen setups include commercial clamshell grilling equipment designed for high-throughput cooking to serve hundreds of customers per hour.
Expanding Hospitality Sector Across Emerging Economies
Rising disposable incomes, tourism growth, and infrastructure development are fueling hospitality expansion across emerging regions like Southeast Asia, the Middle East, and Latin America. Hotels and resorts increasingly upgrade kitchen infrastructure to enhance service quality and menu variety, directly increasing charbroiler demand. Charbroilers are favored for their ability to impart grilled textures and flavors, aligning with growing consumer preference for grilled, smoked, and flame-cooked meals. Boutique hotels and premium resorts integrate versatile cooking appliances to meet evolving guest expectations. Government-led tourism promotion initiatives and foreign direct investments in hospitality infrastructure further support the sector’s growth. With the hospitality industry evolving beyond lodging into gourmet culinary experiences, demand for reliable and high-performance cooking equipment like commercial charbroilers continues to grow steadily in developing economies.
- For instance, luxury resorts in Dubai incorporate professional charbroilers in their outdoor and banquet kitchens to deliver grilled specialty menus tailored to international guests.
Shift Toward Energy-Efficient and Ventless Cooking Equipment
Energy efficiency and sustainability are becoming key decision factors for foodservice operators. Manufacturers are innovating charbroiler designs that reduce energy consumption while maintaining cooking performance. The introduction of electric charbroilers with precise temperature control and lower emissions meets the growing demand for environmentally responsible solutions. In regions with strict indoor air quality regulations, ventless charbroilers are gaining adoption due to their built-in filtration and emission control systems. Operators benefit from lower utility bills and reduced ventilation infrastructure costs. Government subsidies and green certification incentives are also encouraging commercial kitchens to adopt energy-efficient appliances. As businesses aim to reduce their carbon footprint while meeting consumer expectations for quality grilled food, energy-optimized charbroilers are emerging as a strategic investment across various commercial foodservice settings.
Commercial Charbroiler Market Key Trends & Opportunities
Integration of Smart Controls and Automation
Digital transformation in the foodservice industry is encouraging the integration of smart technologies into cooking equipment. Commercial charbroilers are increasingly being designed with digital interfaces, programmable settings, and temperature sensors to ensure consistent cooking performance. These smart controls reduce human error, improve food safety compliance, and enable precise cooking processes. Automation also supports staff training and operation consistency across multiple outlets. IoT-enabled charbroilers allow remote diagnostics, real-time monitoring, and preventive maintenance, reducing downtime. As restaurant operators seek to optimize kitchen workflows amid labor shortages, the demand for automated, intelligent cooking systems is rising. This trend opens opportunities for manufacturers to differentiate their offerings with technology-driven value, particularly among large chains and premium hospitality operators.
- For instance, IoT‑enabled kitchen platforms like Middleby’s Open Kitchen allow operators to monitor and control equipment remotely, including diagnostics and performance data, across multiple outlets.
Growing Preference for Modular and Space-Saving Designs
Urban kitchens are increasingly space-constrained, especially in metro areas where real estate costs are high. This has prompted a shift toward compact and modular charbroiler designs that offer flexibility without sacrificing performance. Countertop models and combination units that integrate charbroilers with fryers or griddles are becoming popular among small to mid-sized food businesses. Modular equipment allows chefs to customize their line setup based on menu needs and available space, improving workflow efficiency. This trend is particularly beneficial for food trucks, cloud kitchens, and small-format restaurants that require versatile cooking capabilities in compact footprints. As commercial kitchens adapt to limited space and evolving culinary demands, space-efficient charbroilers present a major growth opportunity.
Commercial Charbroiler Market Key Challenges
High Maintenance and Operational Costs
Despite their performance advantages, charbroilers often face criticism for high maintenance needs and operating costs. Gas and charcoal models, in particular, require frequent cleaning, grease management, and periodic part replacement due to exposure to high heat and residues. Downtime caused by clogged burners or broken components disrupts kitchen operations and increases servicing expenses. Additionally, units with higher BTUs consume more energy or fuel, raising utility bills. In regions with high energy tariffs or limited access to affordable gas, operational costs may deter adoption, especially for small restaurants. As cost-efficiency becomes a priority, buyers are increasingly evaluating total cost of ownership over upfront equipment prices, which may affect sales unless manufacturers offer durable, low-maintenance, and energy-efficient solutions.
Regulatory and Environmental Compliance
Compliance with fire safety, ventilation, and environmental emission regulations remains a challenge in the commercial charbroiler market. Gas and charcoal charbroilers generate smoke, grease-laden vapors, and particulates, necessitating advanced exhaust systems that meet local codes. In urban areas, especially in North America and parts of Europe, stringent emission control laws restrict the use of traditional charbroilers without costly ventilation upgrades. Non-compliance can lead to fines or forced equipment replacement. These regulatory burdens create entry barriers for new establishments and discourage small foodservice operators from investing in conventional models. To address this, manufacturers must adapt with certified ventless designs, grease management technologies, and cleaner-burning fuel systems, or risk losing competitiveness in tightly regulated markets.
Commercial Charbroiler Market Regional Analysis
North America
North America accounted for a significant share in the global commercial charbroiler market, reaching USD 201.03 million in 2024, up from USD 158.01 million in 2018, and is projected to hit USD 310.76 million by 2032 at a CAGR of 5.70%. The region holds approximately 23.6% of the global market in 2024, driven by the widespread presence of quick-service restaurants, steakhouses, and fast-casual dining formats. Strong consumer preference for grilled food and robust investment in foodservice infrastructure support steady adoption. Stringent safety and emission regulations have also encouraged upgrades to efficient and compliant charbroiler systems.
Europe
Europe holds a market share of around 27.8% in 2024, with the commercial charbroiler market expanding from USD 176.95 million in 2018 to USD 236.59 million in 2024, and projected to reach USD 390.48 million by 2032 at a CAGR of 6.57%. The region’s growth is driven by the increasing number of casual dining chains and rising investments in foodservice modernization across Germany, the UK, and France. The emphasis on energy efficiency, clean cooking technologies, and emission regulations is pushing demand for electric and ventless charbroiler models, especially in densely populated urban centers.
Asia Pacific
Asia Pacific leads the global commercial charbroiler market in revenue terms, accounting for the largest share of 34.1% in 2024. The market increased from USD 227.94 million in 2018 to USD 296.64 million in 2024, and is projected to reach USD 472.90 million by 2032, growing at a CAGR of 6.11%. Rapid urbanization, expanding foodservice chains, and rising disposable income fuel the region’s dominance. Countries like China, India, Japan, and Southeast Asian nations are seeing strong investments in commercial kitchens. The proliferation of western-style food outlets and domestic restaurant chains accelerates the deployment of charbroiler units in new establishments.
Latin America Latin America represents a growing market for commercial charbroilers, with a 2024 market share of 7.1%. The market rose from USD 48.83 million in 2018 to USD 62.09 million in 2024, and is expected to reach USD 95.93 million by 2032, expanding at a CAGR of 5.69%. Brazil and Mexico dominate regional demand, supported by a growing hospitality sector and increased dining-out trends. Rising adoption of Western cuisines and QSR formats further drives installations. While the market remains smaller than others, the rising number of international food chains and catering services offers strong future potential.
Middle East
The Middle East accounts for 4.5% of the global commercial charbroiler market in 2024. The market grew from USD 31.33 million in 2018 to USD 38.18 million in 2024, and is anticipated to reach USD 55.40 million by 2032, registering a CAGR of 4.86%. Countries like the UAE and Saudi Arabia are key contributors, driven by a growing restaurant sector and the development of luxury hotels and resorts. However, slower adoption rates in other Gulf and Levant regions temper overall growth. Stringent food safety and indoor ventilation regulations are influencing a shift toward electric and ventless models.
Africa
Africa, though the smallest in terms of market value, shows promising growth, with a CAGR of 6.14%, the highest among all regions. The market expanded from USD 12.32 million in 2018 to USD 16.06 million in 2024, and is projected to reach USD 25.67 million by 2032, capturing a 1.9% share in 2024. Growth is driven by expanding urban foodservice infrastructure, especially in Nigeria, South Africa, and Kenya. Increased investment in hospitality and food retail, along with rising urban middle-class populations, supports long-term potential. However, infrastructure limitations and high operating costs remain barriers in rural and low-income areas.
Commercial Charbroiler Market Segmentations:
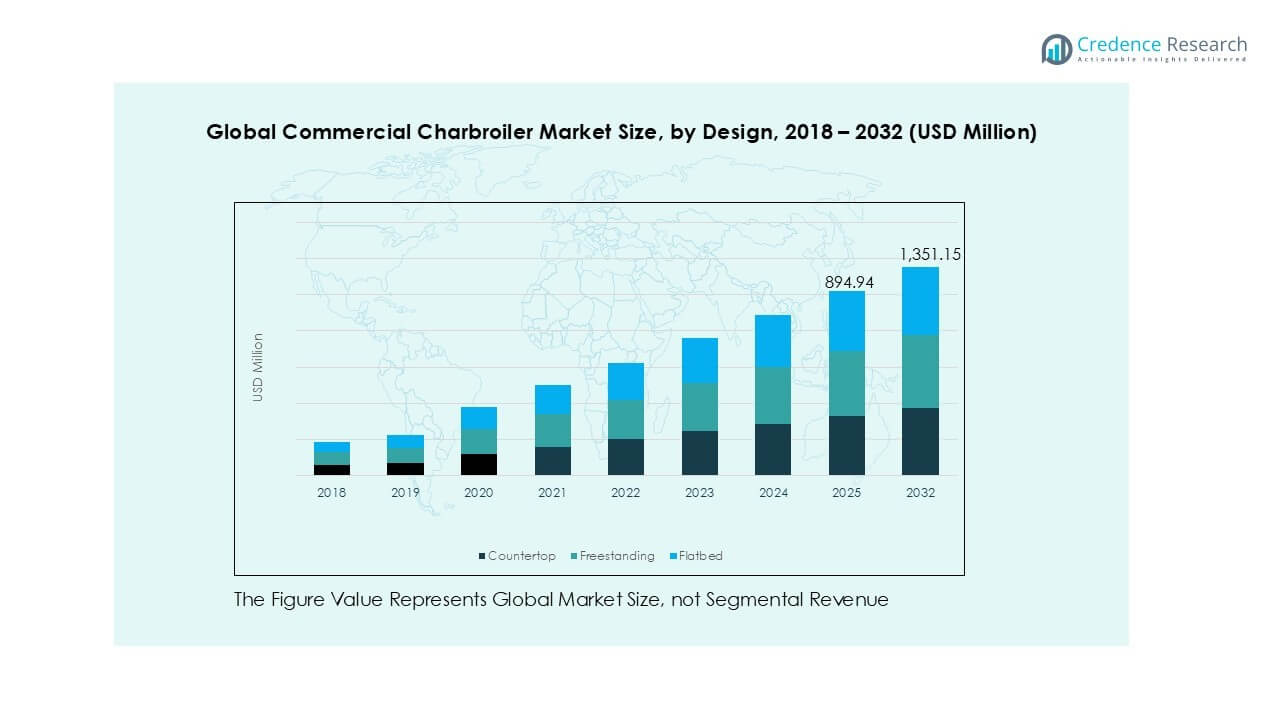
By Design:
- Countertop
- Freestanding
- Flatbed
By Power Segment:
- Electric
- Gas
- Charcoal
By Application Segment:
- Steakhouses
- Hotels
- Restaurants
By Sales Channel Segment:
- E-commerce Platforms
- Direct Sales
- Distributor Sales
By Geography:
- North America
- U.S.
- Canada
- Mexico
- Europe
- Germany
- France
- U.K.
- Italy
- Spain
- Rest of Europe
- Asia Pacific
- China
- Japan
- India
- South Korea
- South-east Asia
- Rest of Asia Pacific
- Latin America
- Brazil
- Argentina
- Rest of Latin America
- Middle East & Africa
- GCC Countries
- South Africa
- Rest of the Middle East and Africa
Commercial Charbroiler Market Competitive Landscape
The global commercial charbroiler market is moderately consolidated, with a mix of established players and emerging manufacturers competing on product innovation, performance, and pricing. Companies like Avantco Equipment, Middleby, Garland Group Ltd, and The Vollrath Company LLC hold significant market shares due to their expansive distribution networks, diverse product portfolios, and strong brand presence in North America and Europe. Manufacturers are focusing on energy efficiency, smart controls, and modular designs to differentiate their offerings. Strategic moves such as product launches, mergers, and distribution partnerships help leading players strengthen market positioning. For instance, Avantco has expanded its presence in e-commerce and small commercial kitchen segments. Meanwhile, companies like Dukers Appliance Co. and Star Manufacturing are gaining traction in Asia Pacific and Latin America through cost-competitive, space-saving units. As regulatory compliance and sustainability gain importance, innovation around ventless and electric models is shaping competition across all regions.
Key Player Analysis
- Avantco Equipment
- Champion Tuff Grills
- Comstock-Castle Stove Co Inc.
- Dukers Appliance Co.
- Garland Group Ltd
- The Vollrath Company LLC
- Wells Manufacturing Inc
- Wolf Equipment
- Middleby
- Star Manufacturing
- Other Key Players
Recent Developments
- In May 2022, Dover Corporation acquired Malema Engineering Corporation, a manufacturer of Flow-Measurement Devices for Bio-Pharma and semiconductor production applications.
- In April 2022, Avantco released the Chef Series CAG-36-RC 36" Gas Countertop Radiant Charbroiler with 90,000 BTU. Because each burner can be adjusted to a different temperature, it is great for cooking burgers, prawns, or veggie skewers. This charbroiler employs radiants to reflect heat onto the cooking surface, guaranteeing speedy recovery and convenient heat retention.
Report Coverage
The research report offers an in-depth analysis based on Design, Power Segment, Application Segment, Sales Channel Segment and Geography. It details leading market players, providing an overview of their business, product offerings, investments, revenue streams, and key applications. Additionally, the report includes insights into the competitive environment, SWOT analysis, current market trends, as well as the primary drivers and constraints. Furthermore, it discusses various factors that have driven market expansion in recent years. The report also explores market dynamics, regulatory scenarios, and technological advancements that are shaping the industry. It assesses the impact of external factors and global economic changes on market growth. Lastly, it provides strategic recommendations for new entrants and established companies to navigate the complexities of the market.
Future Outlook
- The market will grow steadily due to rising global foodservice expansion.
- Quick-service and casual dining chains will remain major drivers of unit demand.
- Gas-powered charbroilers will continue to dominate due to operational efficiency.
- Electric and ventless models will gain traction amid stricter emission regulations.
- Compact countertop designs will see high adoption in space-limited urban kitchens.
- Asia Pacific will maintain the lead, driven by rapid urbanization and hospitality growth.
- Europe will grow steadily, supported by sustainability regulations and modernized kitchens.
- Manufacturers will invest in smart controls and IoT-enabled charbroiler technologies.
- Demand for modular and multi-functional equipment will rise among small-scale operators.
- Competitive pressure will increase as regional players expand into emerging markets.
Request a Free Sample
Fill in your details and we'll send you a free sample report.
- Sample data tables & charts
- Research methodology
Need a Custom Version of This Report?
Tailor the scope, geography, or segments to your exact requirements.
- Custom geography or segment scope
- Direct access to our analyst team
Frequently Asked Questions
What is the current market size for Global Commercial Charbroiler market, and what is its projected size in 2032?
At what Compound Annual Growth Rate is the Global Commercial Charbroiler market projected to grow between 2024 and 2032?
Which Global Commercial Charbroiler market segment held the largest share in 2024?
What are the primary factors fueling the growth of the Global Commercial Charbroiler market?
Who are the leading companies in the Global Commercial Charbroiler market?
Which region commanded the largest share of the Global Commercial Charbroiler market in 2024?
Table of Content
Chapter 1. Report Introduction
- 1.1 Report Description & Purpose
- 1.1.1 Report Title & Market Definition
- 1.1.2 Unique Selling Propositions (USP) & Key Differentiators
- 1.1.3 Value Proposition for Stakeholders
- 1.2 Research Objectives
- 1.2.1 Market Sizing Objectives (Volume & Revenue)
- 1.2.2 Segmentation Objectives
- 1.2.3 Competitive Intelligence Objectives
- 1.2.4 Forecast & Scenario Objectives
- 1.3 Report Scope
- 1.3.1 Commercial Charbroilers Scope – Types & Subtypes Covered
- 1.3.2 Geographic Scope – Regions & Countries Covered
- 1.3.3 Historical Period, Base Year & Forecast Period (2024; forecast to 2032)
- 1.3.4 Inclusions & Exclusions
- 1.4 HS Code & Classification Framework
- 1.5 Currency, Units & Pricing Basis
- 1.6 Target Stakeholders
- 1.7 Limitations & Assumptions
Chapter 2. Executive Summary
- 2.1 Global Commercial Charbroilers Market Snapshot
- 2.1.1 Market Size – Historical (2024) & Forecast (2024-2032) (2024: USD 850.6 million → 2032: USD 1,351.2 million)
- 2.1.2 Volume & Revenue – Global Totals
- 2.1.3 Key Market Highlights – Top Five Facts
- 2.2 Commercial Charbroilers Market Segmentation Snapshot
- 2.2.1 Market Split by Region – 2024 vs. 2032
- 2.3 Competitive Snapshot
- 2.3.1 Top 10 Players by Revenue Share – 2024
- 2.3.2 Top 10 Players by Volume Share – 2024
- 2.3.3 Recent Strategic Developments (18-Month Summary)
- 2.4 Key Investment Highlights & Strategic Conclusions
Chapter 3. Commercial Charbroilers Market Dynamics & Industry Analysis
- 3.1 Market Overview & Context
- 3.1.1 Commercial Charbroilers Market Position in the Broader Automotive Value Chain
- 3.1.2 OEM vs. Replacement Market Dynamics
- 3.1.3 Market Maturity & Development Stage by Region
- 3.2 Commercial Charbroilers Market Drivers
- 3.3 Commercial Charbroilers Market Restraints & Challenges
- 3.4 Commercial Charbroilers Market Opportunities
- 3.5 Porter's Five Forces Analysis
- 3.5.1 Threat of New Entrants
- 3.5.2 Bargaining Power of Suppliers
- 3.5.3 Bargaining Power of Buyers
- 3.5.4 Threat of Substitutes
- 3.5.5 Competitive Rivalry – Intensity Assessment
- 3.6 Commercial Charbroilers Value Chain Analysis
- 3.6.1 Upstream – Raw Material/Input Suppliers
- 3.6.1.1 Raw Material/Input 1
- 3.6.1.2 Raw Material/Input 2
- 3.6.1.3 Raw Material/Input 3
- 3.6.2 Midstream – Production/Manufacturing/Service Delivery
- 3.6.2.1 Production/Process Overview
- 3.6.2.2 Key Facility Locations & Capacity by Manufacturer
- 3.6.3 Downstream – Distribution & End Consumer
- 3.6.3.1 Primary Channel – B2B/OEM
- 3.6.3.2 Secondary Channels – Dealer, Retail, Online, Direct
- 3.6.4 Value Chain Profitability Analysis
- 3.6.1 Upstream – Raw Material/Input Suppliers
- 3.7 PESTEL Analysis
- 3.7.1 Political Factors
- 3.7.2 Economic Factors
- 3.7.3 Social Factors
- 3.7.4 Technological Factors
- 3.7.5 Environmental Factors
- 3.7.6 Legal Factors
- 3.8 Commercial Charbroilers Supply Chain Analysis
- 3.8.1 Raw Material/Input Supply Risk Assessment
- 3.8.2 Manufacturing Concentration Risk (Geographic Exposure)
- 3.8.3 Trade Disruption Impact Analysis
- 3.9 Regulatory & Policy Landscape
Note: The regulatory and policy landscape section covers regulations based on their applicability to the market, Commercial Charbroilers category, geography, and scope of the study. Only regulatory frameworks with a material impact on operations, compliance, trade, sustainability, or market access are analyzed in detail.
Chapter 4. Key Investment Pockets & Opportunity Analysis
- 4.1 Commercial Charbroilers Market Attractiveness Analysis
- 4.1.1 By Region – Investment Attractiveness Matrix (Volume × CAGR)
- 4.2 Absolute Revenue Growth Opportunity
- 4.2.1 By Region – Absolute USD Growth Through 2032
- 4.3 Incremental Volume Opportunity
- 4.3.1 By Region – Incremental Volume Through 2032
- 4.3.2 Segment – Incremental Volume
- 4.4 Emerging Submarket Opportunity Deep Dive (Subject to Applicability)
- 4.5 Emerging Market Opportunity Scorecards
- 4.5.1 United States
- 4.5.2 Europe
- 4.5.3 Asia
- 4.5.4 Middle East & Africa
Note: Emerging Market Opportunity Scorecards will be included based on relevance and strategic importance. Regions listed are indicative and may vary depending on data availability and market dynamics.
Chapter 5. Commercial Charbroilers Import-Export Analysis & Trade Flows
- 5.1 Global Trade Overview
- 5.1.1 Global Export Value by Country (2024)
- 5.1.2 Global Export Volume by Country (2024)
- 5.1.3 Global Import Value by Country (2024)
- 5.1.4 Global Import Volume by Country (2024)
- 5.1.5 Net Trade Balance by Country (2024)
- 5.2 Export Analysis – Segment
- 5.2.1 Type 1 (HS Code)
- 5.2.2 Type 2 (HS Code)
- 5.2.3 Type 3 (HS Code)
- 5.2.4 Type 4 (HS Code)
- 5.2.5 Type 5 (HS Code)
- 5.3 Import Analysis – Segment
- 5.3.1 Type 1 (HS Code)
- 5.3.2 Type 2 (HS Code)
- 5.3.3 Type 3 (HS Code)
- 5.3.4 Type 4 (HS Code)
- 5.3.5 Type 5 (HS Code)
- 5.4 Average Unit Trade Prices
- 5.4.1 Average Export Price – Segment & Country
- 5.4.2 Average Import Price – Segment & Source Country
- 5.4.3 Price Trends (2024)
- 5.5 Key Trade Route Analysis
- 5.5.1 Trade Route 1
- 5.5.2 Trade Route 2
- 5.5.3 Trade Route 3
- 5.5.4 Trade Route 4
- 5.5.5 Trade Route 5
- 5.6 Trade Policy Impact Assessment
- 5.6.1 US Anti-Dumping & Section 301 Tariffs
- 5.6.2 EU Customs Union Impact
- 5.6.3 Major Free Trade Agreements
- 5.6.4 USMCA Rules of Origin
Note: Trade policy analysis will be included only where relevant to the Commercial Charbroilers market.
Chapter 6. Competitive Landscape & Company Benchmarking
- 6.1 Commercial Charbroilers Market Concentration & Structure
- 6.1.1 Herfindahl-Hirschman Index (HHI) – vs. 2024
- 6.1.2 Tier 1, Tier 2 & Tier 3 Market Structure
- 6.1.3 Global, Regional & Local Player Dynamics
- 6.2 Commercial Charbroilers Market Share Analysis – 2024
- 6.2.1 Global Revenue Share by Company
- 6.2.2 Global Volume Share by Company
- 6.2.3 Regional Revenue Share
- 6.2.4 Market Share Evolution ( vs. 2024)
- 6.2.5 OEM Segment Share by Company
- 6.2.6 Replacement Segment Share by Company
- 6.3 Production/Delivery Capacity & Facility Analysis
- 6.3.1 Global Installed Capacity
- 6.3.2 Capacity Utilization Rates
- 6.3.3 Production/Output Volume
- 6.3.4 Facility Locations & Capacity Map
- 6.3.5 Planned Capacity Additions
- 6.4 Commercial Charbroilers Competitive Benchmarking Matrix
- 6.4.1 Revenue, Volume, CAGR & Profitability Comparison
- 6.4.2 Channel Revenue Mix
- 6.4.3 Geographic Revenue Exposure
- 6.4.4 R&D Intensity
- 6.4.5 Sustainability Maturity
- 6.5 Strategic Developments in Commercial Charbroilers (Last 24 Months)
- 6.5.1 Mergers, Acquisitions & Divestments
- 6.5.2 New Commercial Charbroilers Launches
- 6.5.3 Facility Expansions
- 6.5.4 Strategic Alliances, Joint Ventures & Partnerships
- 6.5.5 Distribution Expansion & Market Entry
- 6.5.6 Sustainability & ESG Initiatives
- 6.6 Competitive Strategy Mapping
- 6.6.1 Leader, Challenger, Follower & Niche Classification
- 6.6.2 Pricing Strategy Comparison
- 6.6.3 Channel Strategy Matrix
Note: Strategic developments are included based on their materiality and the availability of reliable information.
Chapter 7. Global Commercial Charbroilers Market – By Distribution Channel
- 7.1 Segment Overview
- 7.1.1 Volume & Revenue Split by Channel (2024 & 2032)
- 7.1.2 Channel Mix Evolution (2024-2032)
Chapter 8. Regional Market Analysis – Global Overview
- 8.1 Global Regional Overview
- 8.1.1 Regional Volume Share
- 8.1.2 Regional Revenue Share
- 8.1.3 Regional Volume by Region
- 8.1.4 Regional Revenue by Region
- 8.1.5 Regional Forecast Through 2032
- 8.2 Cross-Regional Segment Analysis
- 8.2.1 By Distribution Channel
- 8.2.2 By Brand/Price Tier
Chapter 9. North America Commercial Charbroilers Market
- 9.1 United States
- 9.2 Canada
- 9.3 Mexico
Chapter 10. Europe Commercial Charbroilers Market
- 10.1 Germany
- 10.2 France
- 10.3 Italy
- 10.4 United Kingdom
- 10.5 Spain
- 10.6 Poland
- 10.7 Russia
- 10.8 Netherlands
- 10.9 Belgium
- 10.10 Sweden
- 10.11 Denmark
- 10.12 Norway
- 10.13 Rest of Europe
Chapter 11. Asia Pacific Commercial Charbroilers Market
- 11.1 China
- 11.2 India
- 11.3 Japan
- 11.4 South Korea
- 11.5 Thailand
- 11.6 Indonesia
- 11.7 Vietnam
- 11.8 Malaysia
- 11.9 Australia
- 11.10 Rest of Asia Pacific
Chapter 12. Latin America Commercial Charbroilers Market
- 12.1 Brazil
- 12.2 Argentina
- 12.3 Colombia
- 12.4 Chile
- 12.5 Rest of Latin America
Chapter 13. Middle East Commercial Charbroilers Market
- 13.1 Saudi Arabia
- 13.2 United Arab Emirates
- 13.3 Turkey
- 13.4 Israel
- 13.5 Iran
- 13.6 Rest of the Middle East
Chapter 14. Africa Commercial Charbroilers Market
- 14.1 South Africa
- 14.2 Egypt
- 14.3 Nigeria
- 14.4 Morocco
- 14.5 Rest of Africa
Chapter 15. Commercial Charbroilers Company Profiles
- 15.1 [Company 01]
- 15.1.1 Company Overview
- 15.1.2 Key Management Personnel
- 15.1.3 Products & Services Portfolio
- 15.1.4 Financial Performance
- 15.1.5 Key Market Focus & Geographic Presence
- 15.1.6 Recent Developments & Strategic Initiatives
Note: The company profile list is preliminary and may change based on research findings, market developments, data availability, and client requirements.
Chapter 16. Appendices
- Appendix A – List of Abbreviations & Acronyms
- Appendix B – Industry Classification Code Reference – Full Series
- Appendix C – Production & Capacity Data Tables
- Appendix D – End-Use & Demand Base Tables
- Appendix E – Consumption & Replacement Rate Assumptions
- Appendix F – ASP Reference Tables
- Appendix G – Manufacturing & Facility Database
- Appendix H – Import-Export Data Tables
- Appendix I – Regulatory Summary Tables
- Appendix J – Primary Research Participant List (Anonymized)
- Appendix K – Primary Research Questionnaire Framework
- Appendix L – Data Sources & Bibliography
- Appendix M – Market Size Divergence & Source Comparison
Chapter 17. Research Methodology
- 17.1 Research Framework & Philosophy
- 17.2 Secondary Research – Sources, Hierarchy & Data Extraction
- 17.3 Data Modeling – Bottom-Up & Top-Down Market Sizing
- 17.4 Primary Research – Stakeholder Framework, LOI & Sample Sizes
- 17.5 Forecast Methodology – Regression, Scenario & Sensitivity Analysis
- 17.6 Quality Control – Four-Layer Validation Framework
- 17.7 Limitations & Standard Assumptions
- 17.8 Disclaimer
