Market Overview
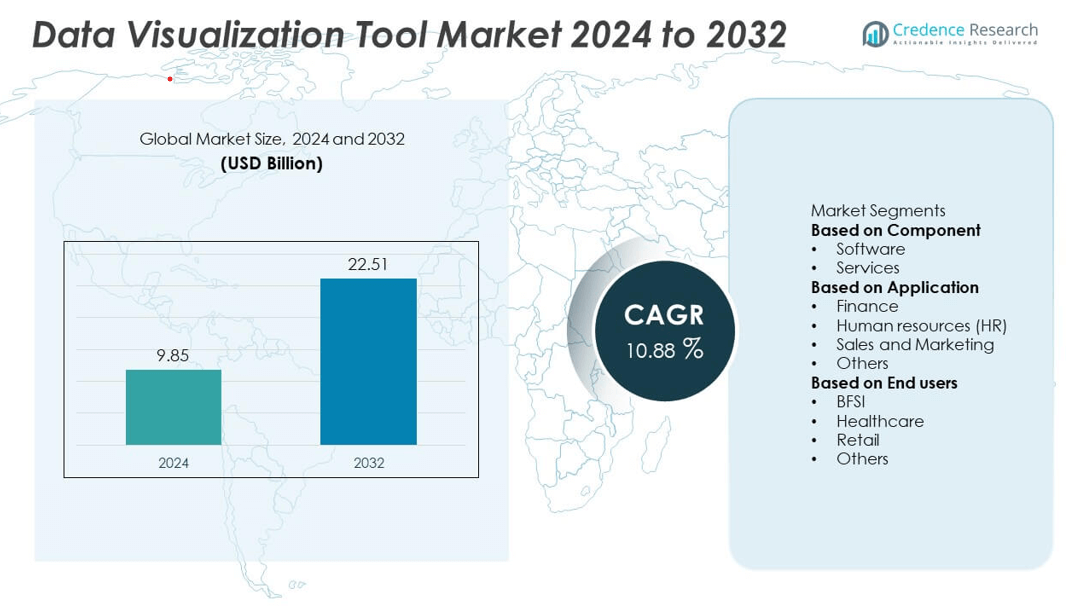
The Data Visualization Tool Market was valued at USD 9.85 billion in 2024 and is projected to reach USD 22.51 billion by 2032, growing at a CAGR of 10.88% during the forecast period.
| REPORT ATTRIBUTE |
DETAILS |
| Historical Period |
2020-2023 |
| Base Year |
2024 |
| Forecast Period |
2025-2032 |
| Data Visualization Tool Market Size 2024 |
USD 9.85 billion |
| Data Visualization Tool Market, CAGR |
5.31% |
| Data Visualization Tool Market Size 2032 |
USD 22.51 billion |
The data visualization tool market is led by major players such as Microsoft Corporation, Oracle, SAP, Salesforce, Qlik, SAS, Sisense Ltd., TIBCO Software Inc., Google, and Klipfolio. These companies drive innovation through AI-powered analytics, cloud-based visualization solutions, and user-friendly dashboard interfaces that simplify data interpretation. Continuous integration of predictive analytics and machine learning enhances decision-making across industries such as BFSI, healthcare, and retail. North America dominated the market in 2024 with a 39% share, supported by strong enterprise adoption of BI tools and digital transformation initiatives, followed by Europe with 28% and Asia-Pacific with 25%, driven by rapid cloud expansion and increasing data analytics investments.
Market Insights
- The data visualization tool market was valued at USD 9.85 billion in 2024 and is projected to reach USD 22.51 billion by 2032, growing at a CAGR of 10.88% during the forecast period.
- Growing demand for real-time data insights and data-driven decision-making is fueling adoption across industries such as BFSI, healthcare, and retail.
- Integration of AI, machine learning, and self-service analytics is transforming visualization platforms, enhancing user accessibility and performance.
- Leading players such as Microsoft Corporation, SAP, Salesforce, and Qlik are investing in AI-powered dashboards, embedded analytics, and strategic cloud partnerships to strengthen market presence.
- North America led with a 39% share in 2024, followed by Europe (28%) and Asia-Pacific (25%), while by component, the software segment dominated with a 73% share, supported by widespread deployment of cloud-based and interactive visualization tools.
Access crucial information at unmatched prices!
Request your sample report today & start making informed decisions powered by Credence Research Inc.!
Download Sample
Market Segmentation Analysis:
By Component
The software segment dominated the data visualization tool market in 2024 with a 73% share, driven by the increasing adoption of self-service analytics and AI-powered visualization platforms. Enterprises rely on advanced software tools for interactive dashboards, predictive analytics, and real-time data monitoring. Continuous innovations in cloud-based and embedded visualization solutions enhance scalability and accessibility. Vendors such as Tableau, Power BI, and Qlik are integrating AI-driven insights to automate visual reporting. The rising demand for intuitive, user-friendly visualization software across industries continues to support the segment’s strong market position.
- For instance, Microsoft expanded Power BI’s Copilot integration, enabling AI-driven report generation that supports natural language prompts and automated visualization formatting.
By Application
The sales and marketing segment held the largest share of 41% in 2024, owing to the growing use of visualization tools for campaign analysis, customer segmentation, and performance tracking. Organizations leverage real-time dashboards to monitor conversion rates, market trends, and customer engagement. The adoption of interactive visual analytics helps teams optimize marketing strategies and forecast demand more effectively. Increasing integration with CRM and social media analytics platforms further strengthens adoption. Businesses across sectors prioritize visualization tools to drive data-informed marketing decisions and enhance ROI.
- For instance, Salesforce has embedded Tableau’s capabilities directly into its Sales Cloud, allowing marketing and sales teams to visualize data to better understand campaign performance, lead activity, and forecast revenue.
By End User
The BFSI segment led the data visualization tool market in 2024 with a 34% share, fueled by the sector’s reliance on analytics for fraud detection, risk assessment, and financial forecasting. Banks and financial institutions use visualization tools to interpret complex datasets and improve regulatory reporting accuracy. Cloud-based and AI-enabled visualization platforms support real-time insights for investment and compliance management. Growing digital transformation initiatives in banking operations and fintech integration are accelerating adoption. The BFSI sector’s emphasis on transparency and data-driven decision-making continues to drive market growth globally.
Key Growth Drivers
Rising Demand for Data-Driven Decision Making
Enterprises across industries are increasingly adopting data visualization tools to convert complex data into actionable insights. Organizations rely on visual analytics to improve operational efficiency, identify market opportunities, and make strategic decisions faster. The shift toward data-driven management and real-time reporting fuels demand for advanced visualization software. Businesses in finance, healthcare, and retail use these tools to simplify analytics workflows and enhance collaboration between technical and non-technical teams, strengthening organizational agility and performance.
- For instance, Tableau reported more than 11 million interactive visualizations published on its Tableau Public platform, illustrating widespread adoption of visualization tools across skill levels.
Rapid Adoption of Cloud-Based Visualization Solutions
Cloud-based visualization platforms are gaining momentum due to their scalability, cost efficiency, and accessibility. Companies are integrating visualization tools with cloud storage and BI systems to enable real-time collaboration and global data access. SaaS-based models support remote data sharing and seamless integration with enterprise analytics systems. The flexibility of cloud deployment reduces infrastructure costs and enhances performance for large-scale analytics projects. This growing cloud adoption accelerates market expansion across small and large enterprises globally.
- For instance, Looker enables each user to run up to 15 concurrent queries per connection in a standard deployment, supporting real-time cloud-based analytics workloads at scale.
Integration of Artificial Intelligence and Machine Learning
AI and machine learning integration are transforming visualization tools by enabling predictive analytics and automated data interpretation. These technologies enhance pattern recognition, trend forecasting, and anomaly detection, providing users with deeper insights. AI-driven visualization also supports natural language processing, allowing users to generate charts and reports through voice or text queries. Enterprises are increasingly adopting AI-enabled visualization platforms to enhance decision accuracy and reduce manual data processing, driving innovation and competitiveness in the analytics ecosystem.
Key Trends & Opportunities
Expansion of Self-Service and Embedded Analytics
The market is witnessing growing demand for self-service visualization tools that empower non-technical users to create dashboards without IT assistance. Embedded analytics is also emerging as a key trend, allowing visualization capabilities to be integrated into existing enterprise applications. This shift toward democratized analytics enhances data accessibility and speeds up decision-making. Businesses across BFSI, retail, and manufacturing sectors are adopting such tools to promote data literacy and operational transparency at all organizational levels.
- For instance, Qlik offers its automated machine learning (now under Qlik Predict) and Insight Advisor, an AI assistant that facilitates advanced analytics and data exploration with natural language. The platform enables users, including citizen data scientists, to build predictive models and interactive dashboards with a low-code or no-code experience.
Growing Use of Real-Time and Interactive Dashboards
Organizations increasingly prefer real-time dashboards for monitoring performance metrics, sales trends, and customer behavior. Interactive visualization tools enable dynamic exploration of data, supporting faster insights and collaboration. Industries like logistics, e-commerce, and healthcare use these dashboards to optimize operations and respond to market changes instantly. The demand for interactive, mobile-compatible, and visually adaptive platforms continues to create significant growth opportunities for vendors in the visualization ecosystem.
- For instance, TIBCO Spotfire, through its integration with Apache Kafka, supports streaming analytics using its real-time data engine. The system enables continuous, live visualization of IoT and operational data, allowing industries like manufacturing and logistics to achieve faster decision cycles and greater operational efficiency.
Key Challenges
Data Security and Privacy Concerns
The growing use of cloud-based visualization tools raises concerns about data security, unauthorized access, and compliance. Sensitive business data, when visualized across networks, requires robust encryption and user authentication measures. In industries such as finance and healthcare, regulatory frameworks like GDPR and HIPAA demand strict data handling standards. Vendors must strengthen cybersecurity frameworks to ensure secure data visualization environments. Balancing convenience with compliance remains a persistent challenge for market participants.
Integration Complexity with Legacy Systems
Many organizations face challenges integrating modern visualization tools with outdated IT infrastructures. Compatibility issues between legacy databases, analytics systems, and visualization software can hinder seamless data flow. The complexity increases operational costs and limits real-time insights. Companies must invest in middleware solutions or platform modernization to overcome these constraints. Addressing integration challenges through flexible APIs and standardized architectures is crucial for ensuring consistent performance and maximizing tool adoption.
Regional Analysis
North America
North America dominated the data visualization tool market in 2024 with a 39% share, driven by the strong presence of technology companies and advanced analytics adoption across industries. The United States leads due to widespread integration of cloud-based BI solutions and the rapid shift toward AI-driven data platforms. Growing demand for self-service analytics in the BFSI, healthcare, and retail sectors further strengthens regional growth. Canada’s focus on digital transformation and government support for big data innovation also contribute to expanding the visualization tools market across the region.
Europe
Europe accounted for a 28% share in 2024, supported by increasing enterprise investments in data analytics and compliance-driven reporting tools. The U.K., Germany, and France are leading adopters of visualization software to improve business intelligence and regulatory transparency. Growing demand for real-time data dashboards in manufacturing, automotive, and financial sectors enhances market penetration. The region’s push toward digital transformation under the EU’s data strategy and high adoption of cloud infrastructure further accelerate the use of advanced visualization technologies across enterprises.
Asia-Pacific
Asia-Pacific held a 25% share in 2024, fueled by rapid digitalization, expanding IT infrastructure, and increased investment in analytics across enterprises. China, Japan, and India are major contributors, driven by strong government support for AI adoption and data integration initiatives. The region’s growing SME sector is embracing cost-effective cloud-based visualization tools for business optimization. Rising adoption of mobile and web-based dashboards among e-commerce and fintech companies further strengthens regional demand. Asia-Pacific is projected to be the fastest-growing market due to large-scale digital transformation efforts.
Latin America
Latin America represented a 5% share in 2024, supported by growing adoption of business intelligence and analytics tools among small and medium enterprises. Brazil and Mexico lead regional demand as organizations adopt visualization software to enhance decision-making and operational efficiency. Increasing use of cloud platforms and digital transformation programs by government and private sectors drive growth. However, budget constraints and limited awareness in smaller businesses hinder widespread adoption. Expanding IT investments and partnerships with global analytics vendors are expected to accelerate market expansion.
Middle East & Africa
The Middle East & Africa accounted for a 3% share in 2024, driven by rising demand for analytics tools in finance, energy, and public sectors. Gulf countries such as Saudi Arabia and the UAE are promoting digital economy initiatives under national visions, encouraging data-driven business models. Growing cloud adoption and AI-based analytics integration strengthen the regional market. In Africa, South Africa and Nigeria are emerging markets, investing in digital transformation and enterprise software modernization. The expanding focus on predictive analytics and performance monitoring will further boost market adoption.
Market Segmentations:
By Component
By Application
- Finance
- Human resources (HR)
- Sales and Marketing
- Others
By End users
- BFSI
- Healthcare
- Retail
- Others
By Geography
- North America
- Europe
- Germany
- France
- U.K.
- Italy
- Spain
- Rest of Europe
- Asia Pacific
- China
- Japan
- India
- South Korea
- South-east Asia
- Rest of Asia Pacific
- Latin America
- Brazil
- Argentina
- Rest of Latin America
- Middle East & Africa
- GCC Countries
- South Africa
- Rest of the Middle East and Africa
Competitive Landscape
The competitive landscape of the data visualization tool market includes key players such as Microsoft Corporation, Oracle, SAP, Salesforce, Qlik, SAS, Sisense Ltd., TIBCO Software Inc., Google, and Klipfolio. These companies dominate the market through innovation in AI-driven analytics, self-service BI, and cloud-based visualization platforms. Continuous development of interactive dashboards and embedded analytics capabilities enhances data accessibility and business performance across industries. Strategic partnerships and acquisitions strengthen product integration with existing enterprise ecosystems. Vendors are focusing on improving real-time data processing, scalability, and AI-assisted insights to meet evolving enterprise needs. Open-source visualization frameworks and API integrations are further expanding market competitiveness. The landscape remains moderately consolidated, with leading players differentiating through robust product portfolios, intuitive user interfaces, and strong customer support networks globally.
Shape Your Report to Specific Countries or Regions & Enjoy 30% Off!
Key Player Analysis
- SAS
- Oracle
- Microsoft Corporation
- Qlik
- Sisense Ltd.
- SAP
- TIBCO Software Inc.
- Google
- Salesforce
- Klipfolio
Recent Developments
- In October 2025, Qlik published its October release notes for Qlik Cloud, introducing automation connector APIs, enhanced dataset runtime monitoring for data-tasks, and migration tooling updates to support large-scale app usage.
- In October 2025, Microsoft Corporation released updates to Power BI including a migration of map-visuals from Bing Maps to Azure Maps, a new REST API for semantic-model connection binding, and enhanced Copilot features for report-creation.
- In May 2024, NASA’s Advanced Supercomputing (NAS) facility at the Ames Research Center introduced its latest generation hyperwall system, marking a significant advancement in data visualization capabilities.
Report Coverage
The research report offers an in-depth analysis based on Component, Application, End users and Geography. It details leading market players, providing an overview of their business, product offerings, investments, revenue streams, and key applications. Additionally, the report includes insights into the competitive environment, SWOT analysis, current market trends, as well as the primary drivers and constraints. Furthermore, it discusses various factors that have driven market expansion in recent years. The report also explores market dynamics, regulatory scenarios, and technological advancements that are shaping the industry. It assesses the impact of external factors and global economic changes on market growth. Lastly, it provides strategic recommendations for new entrants and established companies to navigate the complexities of the market.
Future Outlook
- Demand for real-time analytics and interactive dashboards will continue to increase across industries.
- Integration of AI and machine learning will enhance predictive visualization capabilities.
- Cloud-based visualization platforms will dominate due to scalability and cost efficiency.
- Self-service analytics tools will empower non-technical users to make data-driven decisions.
- Embedded visualization within enterprise software will become a standard feature.
- Data security and compliance solutions will gain importance with growing cloud adoption.
- Asia-Pacific will emerge as the fastest-growing region driven by digital transformation initiatives.
- Vendors will focus on automation and natural language processing to simplify data analysis.
- Partnerships between analytics providers and cloud platforms will strengthen global market presence.
- Continuous innovation in user interface design and data storytelling will enhance visualization experiences.


