Home » Information and Communications Technology » Technology & Media » Digital Precision Level Market

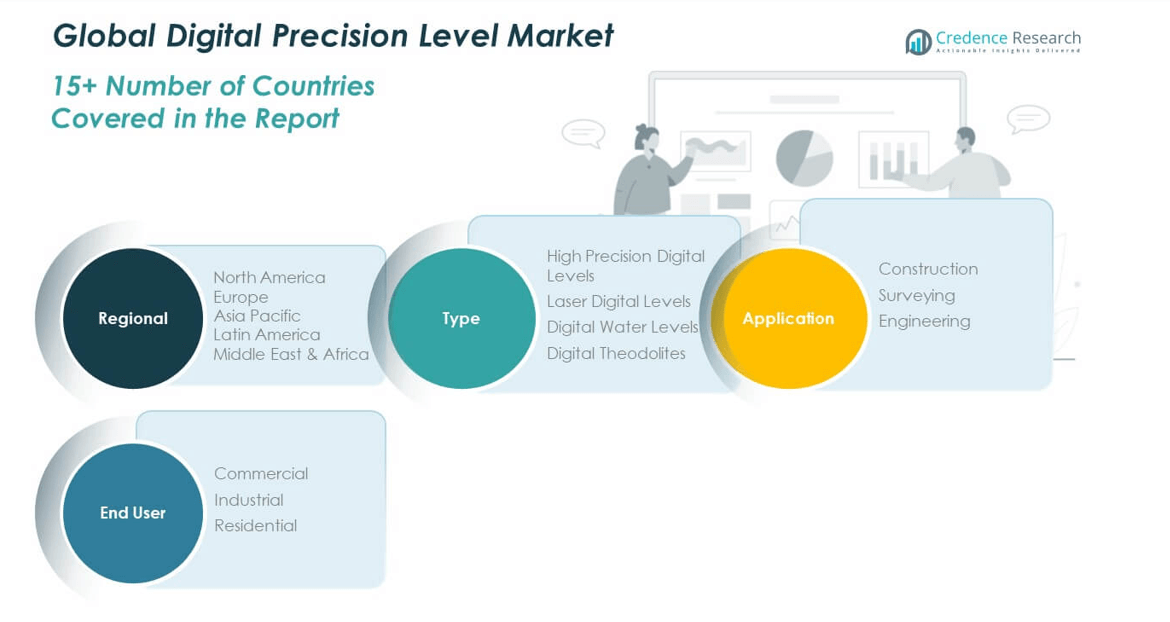
Digital Precision Level Market By Type (High Precision Digital Levels, Laser Digital Levels, Digital Water Levels, Digital Theodolites); By Application (Construction, Surveying, Engineering); By End User (Commercial, Industrial, Residential) – Growth, Share, Opportunities & Competitive Analysis, 2024 – 2032

Report ID: 135970 | Report Format : Excel, PDF

Market Overview:

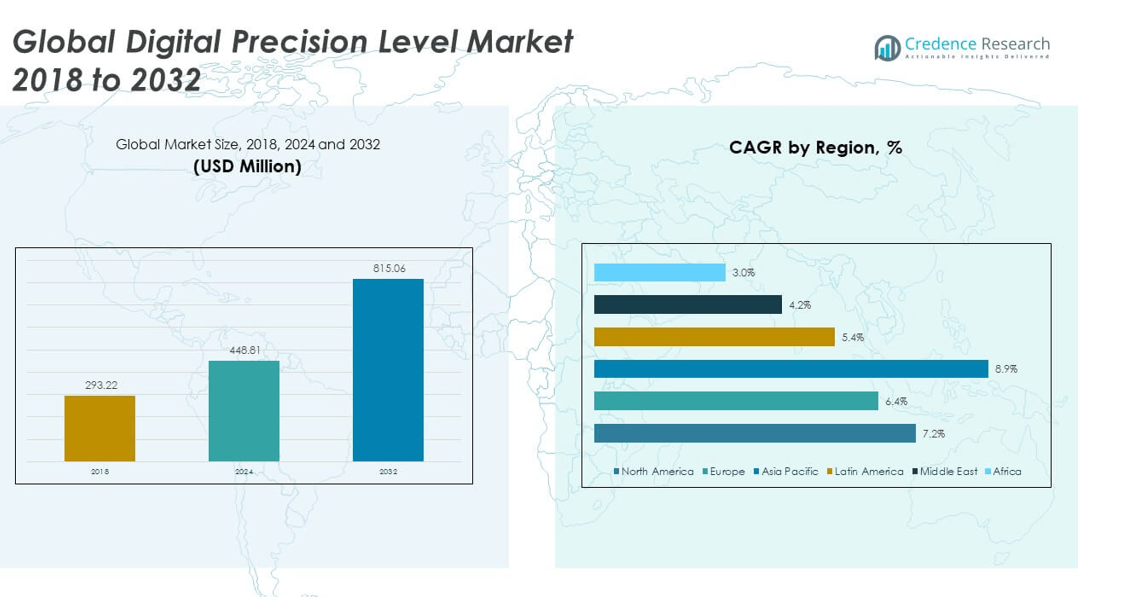
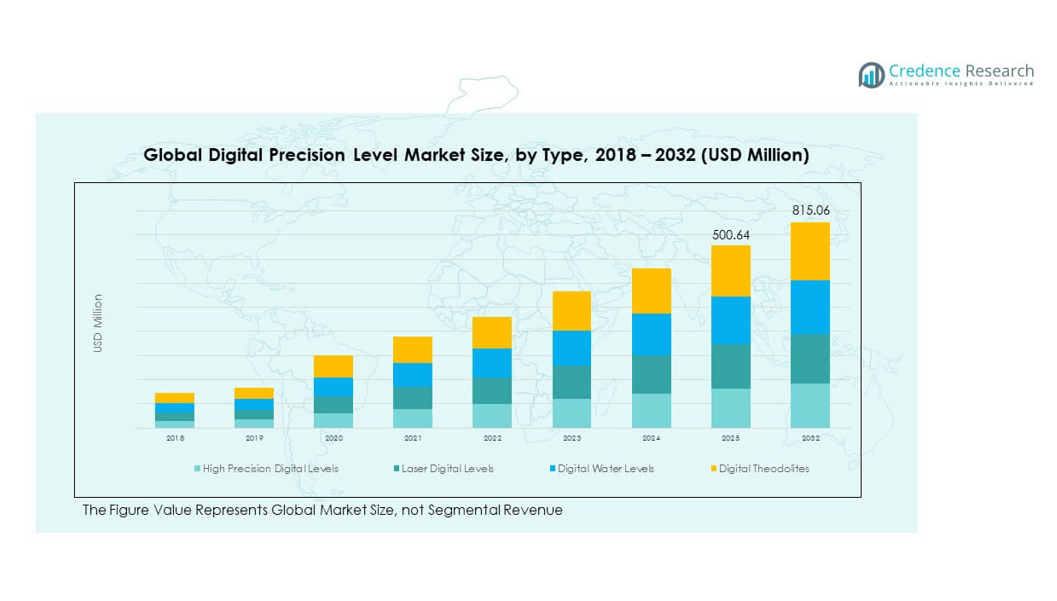
The Global Digital Precision Level Market size was valued at USD 293.22 million in 2018 to USD 448.81 million in 2024 and is anticipated to reach USD 815.06 million by 2032, at a CAGR of 7.21% during the forecast period.

REPORT ATTRIBUTE DETAILS
Historical Period 2020-2023
Base Year 2024
Forecast Period 2025-2032
Digital Precision Level Market Size 2024 USD 448.81 million
Digital Precision Level Market, CAGR 7.21%
Digital Precision Level Market Size 2032 USD 815.06 million


Growth in this market is driven by rising adoption of advanced measuring instruments across construction, aerospace, and manufacturing sectors. The shift toward precision engineering requires highly accurate leveling tools for quality assurance and safety compliance. Increasing automation in industrial operations further strengthens the demand for digital precision levels, while the integration of user-friendly features such as wireless connectivity, data logging, and compact design makes these instruments more appealing to professionals.

Regionally, North America leads due to strong adoption in construction and aerospace projects, supported by robust technological infrastructure. Europe follows closely, driven by strict quality standards in industrial applications. Meanwhile, Asia-Pacific is emerging as a high-growth region, fueled by rapid urbanization, infrastructure investments, and expanding manufacturing activity in countries such as China and India. Latin America and the Middle East are also gaining traction with rising industrial projects and construction developments.

Digital Precision Level Market size

Market Insights:

  • The Global Digital Precision Level Market was valued at USD 293.22 million in 2018, reached USD 448.81 million in 2024, and is projected to attain USD 815.06 million by 2032, growing at a CAGR of 7.21%.
  • North America leads with 44% share, supported by advanced construction, aerospace, and industrial adoption; Europe follows with 27%, driven by strict compliance standards; Asia Pacific holds 21%, reflecting strong infrastructure investments.
  • Asia Pacific is the fastest-growing region with an 8.9% CAGR, fueled by rapid urbanization, industrial modernization, and expansion of smart city projects across China, India, and Japan.
  • High Precision Digital Levels accounted for the largest share at 38% in 2024, supported by their accuracy and usage in aerospace and advanced engineering sectors.
  • Digital Theodolites contributed 25% share in 2024, with rising demand from surveying, construction, and infrastructure projects across both developed and emerging economies.

Access crucial information at unmatched prices!

Request your sample report today & start making informed decisions powered by Credence Research Inc.!

Download Sample

Market Drivers:

Rising Demand for Precision in Construction and Infrastructure Development:

Construction and infrastructure projects increasingly require accurate measurement tools to maintain safety and efficiency. Engineers and contractors prefer digital precision levels for their reliability over traditional instruments. The Global Digital Precision Level Market benefits from strict regulations that demand accurate alignment and leveling. It strengthens project timelines and reduces rework costs. Infrastructure expansion in both developed and emerging economies raises adoption rates. Governments invest in smart cities and transport projects, fueling product demand. Growing use of automation further integrates precision levels into daily construction tasks. It enhances performance consistency across large-scale projects.

  • For instance, Laserliner’s 3D laser levels provide 3×360° coverage with green diode lasers for higher visibility, enabling precise alignment across entire walls and ceilings in construction sites up to 165 feet, significantly improving installation accuracy.

Adoption of Advanced Technologies Across Manufacturing and Aerospace Sectors:

Manufacturers and aerospace companies use precision levels for alignment, assembly, and maintenance tasks. The Global Digital Precision Level Market supports production accuracy by offering advanced features. Integration of wireless connectivity and digital interfaces improves usability. Firms invest in these tools to meet strict industry standards. Precision in aerospace manufacturing reduces risk of errors in safety-critical systems. Automated manufacturing relies on accurate tools, enhancing output reliability. Rising global aerospace demand creates steady market growth. It ensures long-term adoption in industries where accuracy is mission critical.

  • For instance, Mitutoyo’s metrology tools maintain tolerances within ten-thousandths of an inch, integrating in-process inspection with coordinate measuring machines (CMMs) that perform rapid automated quality checks to reduce scrap and rework.

Growing Awareness of Quality Control and Safety Compliance Standards:

Industries worldwide emphasize adherence to safety standards and quality control systems. The Global Digital Precision Level Market benefits from mandatory compliance requirements. Industrial operators invest in digital levels to reduce defects and ensure alignment. Quality certifications increase the demand for precise tools in global trade. Growing enforcement of workplace safety boosts the importance of accurate leveling. Firms improve efficiency by adopting advanced instruments to meet international standards. Global competition also encourages stricter compliance frameworks. It drives consistent growth in industrial and commercial adoption.

User-Friendly Features and Integration of Smart Capabilities:

Manufacturers design digital precision levels with smart features to attract broader audiences. The Global Digital Precision Level Market sees rising interest in wireless connectivity and data logging. These tools simplify operations and reduce operator error. Professional users’ value compact, lightweight designs that improve portability. Integration with mobile applications improves real-time monitoring and reporting. Contractors and engineers prefer tools that align with digital project management systems. Ease of use strengthens adoption among both skilled and new users. It positions smart-enabled levels as essential for future market expansion.

Market Trends:

Integration of Artificial Intelligence and Automation in Measuring Tools:

Artificial intelligence and automation are shaping digital measurement solutions. The Global Digital Precision Level Market benefits from AI-driven calibration and error detection features. Automated systems allow tools to self-correct, improving accuracy. AI enhances predictive maintenance, reducing downtime. Automation supports faster operations on large-scale sites. Engineers adopt intelligent levels to align with smart manufacturing. Digital twins and automated quality checks improve efficiency. It drives innovation in product development for high-precision industries.

  • For instance, Hexagon’s Absolute Scanner AS1, when paired with the Absolute Positioner AP21 unit, enables automated, high-speed blue laser scanning with real-time data feedback. This combination facilitates precise measurements on complex aerospace parts, including within automated laser tracker systems, reducing the need for human intervention.

Sustainability-Oriented Product Development and Eco-Friendly Designs:

Environmental concerns shape the design of precision measurement devices. The Global Digital Precision Level Market is seeing a rise in eco-friendly materials and energy-efficient components. Manufacturers adopt recyclable housings and longer battery life designs. Green certifications add value to products in regulated markets. Firms focus on reducing carbon footprints in product life cycles. Customers increasingly prefer environmentally responsible equipment. Industry-wide sustainability initiatives push continuous innovation in this space. It fosters long-term demand for eco-friendly digital levels.

  • For instance, companies are leveraging trade-off analysis and carbon footprint digital factories to reduce product lifecycle emissions, with some manufacturers using automated geometry-driven analysis to pinpoint design changes reducing CO2 emissions early in development.

Customization and Application-Specific Product Variants:

Growing demand for application-specific solutions drives product diversification. The Global Digital Precision Level Market responds with customized instruments tailored to construction, aerospace, and manufacturing needs. Specialized designs meet niche requirements. Compact levels suit interior design, while heavy-duty models support large industrial projects. Customization strengthens brand differentiation among manufacturers. Users benefit from tools designed for precise functions. It ensures strong loyalty across customer groups. Continuous innovation sustains competitive advantage for leading suppliers.

Expansion of Distribution Networks Through E-Commerce and Global Partnerships:

Distribution channels are evolving to meet global demand. The Global Digital Precision Level Market is supported by online platforms and international partnerships. E-commerce platforms make products widely accessible. Global supply chains expand reach into emerging economies. Strategic alliances enhance brand presence across regions. Online sales improve visibility for small and mid-sized manufacturers. Retail growth complements traditional specialty stores. It strengthens product accessibility for diverse professional users worldwide.

Digital Precision Level Market share

Market Challenges Analysis:

High Product Costs and Intense Competition from Traditional Tools:

The Global Digital Precision Level Market faces barriers due to high costs compared to analog alternatives. Price-sensitive buyers hesitate to adopt advanced instruments. Many small contractors still rely on traditional tools. Affordability limits expansion in developing economies. Manufacturers face pressure to balance innovation and cost reduction. Competition from low-cost substitutes weakens adoption rates. Market penetration depends heavily on lowering production costs. It challenges consistent revenue growth in some regions.

Skill Gaps, Integration Issues, and Maintenance Concerns:

Adopting advanced digital tools requires skilled operators and training investments. The Global Digital Precision Level Market struggles in regions with limited technical expertise. Integration with digital platforms can create compatibility issues. Users often face learning curves in adapting to smart-enabled devices. Maintenance and calibration require specialized services, increasing costs. Industrial operators hesitate to adopt due to these challenges. Lack of awareness also slows adoption in certain sectors. It highlights the need for stronger support systems and training programs.

Market Opportunities:

Rising Infrastructure Investments and Industrial Modernization Across Economies:

Emerging economies invest heavily in infrastructure, boosting adoption of precision tools. The Global Digital Precision Level Market benefits from modernization efforts in railways, airports, and industrial plants. Governments allocate funds for smart city projects, creating demand. Private sector expansion in construction further strengthens usage. Technological upgrades encourage industries to shift to digital instruments. It positions manufacturers to capture growth opportunities. Expanding construction activity globally provides consistent market momentum. It aligns with industrial automation and global development trends.

Expansion of Smart Manufacturing and Digital Transformation Programs:

Industries adopt digital transformation programs to improve productivity and accuracy. The Global Digital Precision Level Market grows with integration into Industry 4.0 strategies. Smart factories require accurate tools for seamless operations. Manufacturers seek digital levels compatible with connected systems. Demand increases as companies invest in advanced measurement technologies. It supports predictive maintenance and real-time monitoring. Strong adoption among high-tech industries sustains growth potential. It creates long-term opportunities for suppliers worldwide.

Market Segmentation Analysis:

By Type

The Global Digital Precision Level Market is segmented into high precision digital levels, laser digital levels, digital water levels, and digital theodolites. High precision digital levels dominate due to their accuracy in demanding applications such as aerospace and advanced engineering. Laser digital levels gain traction in construction projects where fast alignment is required. Digital water levels serve specialized applications with ease of measurement in fluid-related tasks. Digital theodolites hold relevance in surveying and infrastructure projects, supported by their integration with geospatial technologies.

  • For instance, Digi-Pas Technologies offers dual-axis digital levels with accuracy better than 0.0001° (less than 1 arcsecond), periodically verified by internationally accredited bodies, meeting stringent precision demands for aerospace and advanced engineering projects.

By Application

Construction represents the leading application, supported by rising infrastructure projects and strict safety standards. Surveying uses digital precision levels to ensure accurate land assessment and mapping, strengthening demand from government and private projects. Engineering sectors adopt these tools for machine alignment, product assembly, and quality assurance. The market benefits from diverse adoption across all three applications, driven by a push for improved accuracy and compliance with industry standards.

  • For instance, in aerospace engineering, Mitutoyo instruments ensure component tolerances within 0.00001 inches, critical for safety-compliant assembly, while in surveying, digital theodolites enable automated stake-out and area calculations, reducing setup times by up to 30% compared to manual methods.

By End User

Commercial users employ digital precision levels in building projects, interior design, and renovation activities. Industrial users form a strong share due to reliance on accuracy for manufacturing, aerospace, and automotive sectors. Residential adoption, though smaller, is growing with DIY users and home contractors seeking reliable tools. The Global Digital Precision Level Market continues to expand across all end-user groups, supported by evolving designs that combine user-friendly features with professional-grade accuracy.

Digital Precision Level Market segmerntation

Segmentation:

By Type

  • High Precision Digital Levels
  • Laser Digital Levels
  • Digital Water Levels
  • Digital Theodolites

By Application

  • Construction
  • Surveying
  • Engineering

By End User

  • Commercial
  • Industrial
  • Residential

By Region

  • North America
    • U.S.
    • Canada
    • Mexico
  • Europe
    • UK
    • France
    • Germany
    • Italy
    • Spain
    • Russia
    • Belgium
    • Netherlands
    • Austria
    • Sweden
    • Poland
    • Denmark
    • Switzerland
    • Rest of Europe
  • Asia Pacific
    • China
    • Japan
    • South Korea
    • India
    • Australia
    • Thailand
    • Indonesia
    • Vietnam
    • Malaysia
    • Philippines
    • Taiwan
    • Rest of Asia Pacific
  • Latin America
    • Brazil
    • Argentina
    • Peru
    • Chile
    • Colombia
    • Rest of Latin America
  • Middle East
    • UAE
    • KSA
    • Israel
    • Turkey
    • Iran
    • Rest of Middle East
  • Africa
    • Egypt
    • Nigeria
    • Algeria
    • Morocco
    • Rest of Africa

Regional Analysis:

North America

The North America Digital Precision Level Market size was valued at USD 131.14 million in 2018 to USD 198.69 million in 2024 and is anticipated to reach USD 361.80 million by 2032, at a CAGR of 7.2% during the forecast period. North America accounts for the largest share of the Global Digital Precision Level Market at around 44%. The region benefits from strong adoption in construction, aerospace, and advanced manufacturing industries. Robust infrastructure spending in the U.S. and Canada drives steady demand. Aerospace applications strengthen growth, supported by leading global manufacturers headquartered in the region. High penetration of digital technologies enables integration of smart features into precision tools. Contractors and industrial users prioritize accurate measurement for compliance with safety and quality standards. Ongoing infrastructure upgrades and modernization programs sustain growth momentum. It remains a dominant hub for innovation and early adoption.

Europe

The Europe Digital Precision Level Market size was valued at USD 82.82 million in 2018 to USD 122.18 million in 2024 and is anticipated to reach USD 208.84 million by 2032, at a CAGR of 6.4% during the forecast period. Europe holds a 27% share of the Global Digital Precision Level Market. The region benefits from strong industrial standards and advanced engineering practices. Germany, France, and the UK lead in adoption, supported by strict quality compliance requirements. Demand is reinforced by automotive, aerospace, and construction sectors. European manufacturers invest in eco-friendly and energy-efficient designs to align with sustainability goals. The adoption of precision instruments in industrial automation supports broader market expansion. Countries in Eastern Europe are emerging with infrastructure modernization projects. It reflects steady growth driven by regulatory strength and technological innovation.

Asia Pacific

The Asia Pacific Digital Precision Level Market size was valued at USD 56.73 million in 2018 to USD 94.07 million in 2024 and is anticipated to reach USD 193.36 million by 2032, at a CAGR of 8.9% during the forecast period. Asia Pacific contributes 21% to the Global Digital Precision Level Market. The region shows the fastest growth, driven by urbanization and large-scale infrastructure projects. China, India, and Japan lead with construction and manufacturing adoption. Industrial modernization and smart city programs increase demand for advanced precision tools. Manufacturing hubs expand usage in automotive, aerospace, and electronics. Rising investment in construction safety standards boosts demand for reliable measuring devices. Local manufacturers also contribute with cost-effective innovations. It stands out as the most dynamic region with strong future growth potential.

Latin America

The Latin America Digital Precision Level Market size was valued at USD 12.68 million in 2018 to USD 19.14 million in 2024 and is anticipated to reach USD 30.39 million by 2032, at a CAGR of 5.4% during the forecast period. Latin America accounts for 4% of the Global Digital Precision Level Market. Brazil and Mexico drive regional growth through ongoing construction and industrial expansion. Infrastructure projects in transport and energy sectors strengthen adoption. Industrial use is supported by emerging manufacturing clusters. Market penetration faces challenges from limited affordability of advanced tools. Contractors increasingly adopt digital levels to improve accuracy and reduce project delays. Growing partnerships with global suppliers enhance product availability. It shows gradual but stable growth prospects across industries.

Middle East

The Middle East Digital Precision Level Market size was valued at USD 6.58 million in 2018 to USD 9.00 million in 2024 and is anticipated to reach USD 13.08 million by 2032, at a CAGR of 4.2% during the forecast period. The Middle East represents 2% of the Global Digital Precision Level Market. Growth is supported by large-scale infrastructure and smart city projects in GCC countries. Construction of high-rise buildings and industrial facilities drives adoption. Oil and gas projects also create opportunities for specialized precision tools. The region benefits from government-led diversification plans. Affordability constraints limit wider adoption outside major urban hubs. Demand is concentrated in UAE, Saudi Arabia, and Qatar. It presents selective growth prospects in high-investment sectors.

Africa

The Africa Digital Precision Level Market size was valued at USD 3.27 million in 2018 to USD 5.74 million in 2024 and is anticipated to reach USD 7.58 million by 2032, at a CAGR of 3.0% during the forecast period. Africa holds a 1% share of the Global Digital Precision Level Market. Growth remains modest due to low penetration and affordability challenges. South Africa and Egypt lead adoption with infrastructure modernization projects. Usage is concentrated in urban construction and industrial hubs. Limited access to advanced technologies slows broader uptake. However, gradual improvements in urban development create demand opportunities. International partnerships improve supply availability in selected regions. It reflects a developing market with long-term growth prospects tied to infrastructure expansion.

Shape Your Report to Specific Countries or Regions & Enjoy 30% Off!

Key Player Analysis:

  • Status Pro
  • Digi-Pas Technologies
  • Mitutoyo
  • Microplan Italia
  • WYLER AG
  • ULTRA PRÄZISION MESSZEUGE
  • RÖCKLE
  • Laserliner
  • GemRed
  • Fred V. Fowler

Competitive Analysis:

The Global Digital Precision Level Market is highly competitive, shaped by established players and emerging innovators. Companies focus on precision, durability, and smart integration to secure market presence. Leading firms invest in R&D to deliver advanced products with wireless connectivity and digital interfaces. Partnerships and distribution expansions strengthen global reach and brand positioning. Industrial users demand accuracy and compliance, driving innovation across all segments. Competitive intensity is strong in North America and Europe, while Asia Pacific players gain momentum with cost-effective solutions. It remains a market where continuous innovation and differentiation define long-term leadership.

Recent Developments:

  • In Status Pro, the company confirmed the 2025 edition of its NFL PRO ERA VR sports game with a live-service model update that enhances defensive gameplay, adds features like immersive huddles, player situational awareness, and customization options. This update was announced and detailed on the official Status Pro website and blog during 2024, with continuous support into 2025.
  • Digi-Pas Technologies officially showcased the DWL1900XY two-axis vertical precision digital level product in 2024 and participated in industry trade shows such as IMTS and EMO in 2024-2025 with its precision alignment tools, as stated on their official company website.

Report Coverage:

The research report offers an in-depth analysis based on type, application, and end user. It details leading market players, providing an overview of their business, product offerings, investments, revenue streams, and key applications. Additionally, the report includes insights into the competitive environment, SWOT analysis, current market trends, as well as the primary drivers and constraints. Furthermore, it discusses various factors that have driven market expansion in recent years. The report also explores market dynamics, regulatory scenarios, and technological advancements that are shaping the industry. It assesses the impact of external factors and global economic changes on market growth. Lastly, it provides strategic recommendations for new entrants and established companies to navigate the complexities of the market.

Future Outlook:

  • Demand will grow with rising construction and infrastructure modernization worldwide.
  • Industrial automation will create steady adoption across high-precision applications.
  • Aerospace and automotive sectors will drive demand for accuracy and reliability.
  • Smart-enabled tools with connectivity features will dominate product development.
  • Asia Pacific will continue as the fastest-growing region due to urban expansion.
  • Sustainability trends will influence material selection and product design.
  • Partnerships and acquisitions will expand global distribution networks.
  • Emerging economies will see higher adoption with affordable product variants.
  • Regulatory standards will encourage broader use across safety-driven industries.
  • Ongoing R&D will strengthen innovation pipelines and competitive differentiation.

CHAPTER NO. 1: GENESIS OF THE MARKET

1.1 Market Prelude – Introduction & Scope

1.2 The Big Picture – Objectives & Vision

1.3 Strategic Edge – Unique Value Proposition

1.4 Stakeholder Compass – Key Beneficiaries

CHAPTER NO. 2: EXECUTIVE LENS

2.1 Pulse of the Industry – Market Snapshot

2.2 Growth Arc – Revenue Projections (USD Million)

2.3. Premium Insights – Based on Primary Interviews

CHAPTER NO. 3: DIGITAL PRECISION LEVEL MARKET FORCES & INDUSTRY PULSE

3.1 Foundations of Change – Market Overview
3.2 Catalysts of Expansion – Key Market Drivers
3.2.1 Momentum Boosters – Growth Triggers
3.2.2 Innovation Fuel – Disruptive Technologies
3.3 Headwinds & Crosswinds – Market Restraints
3.3.1 Regulatory Tides – Compliance Challenges
3.3.2 Economic Frictions – Inflationary Pressures
3.4 Untapped Horizons – Growth Potential & Opportunities
3.5 Strategic Navigation – Industry Frameworks
3.5.1 Market Equilibrium – Porter’s Five Forces
3.5.2 Ecosystem Dynamics – Value Chain Analysis
3.5.3 Macro Forces – PESTEL Breakdown

3.6 Price Trend Analysis

    3.6.1 Regional Price Trend
3.6.2 Price Trend by Product

CHAPTER NO. 4: KEY INVESTMENT EPICENTER  

4.1 Regional Goldmines – High-Growth Geographies

4.2 Product Frontiers – Lucrative Product Categories

4.3 Application Sweet Spots – Emerging Demand Segments

CHAPTER NO. 5: REVENUE TRAJECTORY & WEALTH MAPPING

5.1 Momentum Metrics – Forecast & Growth Curves

5.2 Regional Revenue Footprint – Market Share Insights

5.3 Segmental Wealth Flow – Type & End User Revenue

CHAPTER NO. 6: TRADE & COMMERCE ANALYSIS            

6.1.        Import Analysis by Region

6.1.1.     Global Digital Precision Level Import Revenue By Region

6.2.        Export Analysis by Region

6.2.1.     Global Digital Precision Level Export Revenue By Region

CHAPTER NO. 7: COMPETITION ANALYSIS           

7.1.        Company Market Share Analysis

7.1.1.     Global Digital Precision Level: Company Market Share

7.2.        Global Digital Precision Level Company Revenue Market Share

7.3.        Strategic Developments

7.3.1.     Acquisitions & Mergers

7.3.2.     New Product Launch

7.3.3.     Regional Expansion

7.4.    Competitive Dashboard

7.5.    Company Assessment Metrics, 2024

CHAPTER NO. 8: DIGITAL PRECISION LEVEL MARKET – BY TYPE SEGMENT ANALYSIS

8.1.        Digital Precision Level Overview by Type Segment

8.1.1.     Digital Precision Level Revenue Share By Type

8.2.        High Precision Digital Levels

8.3.        Laser Digital Levels

8.4.        Digital Water Levels

8.5.        Digital Theodolites

CHAPTER NO. 9: DIGITAL PRECISION LEVEL MARKET – BY APPLICATION SEGMENT ANALYSIS

9.1.        Digital Precision Level Overview by Application Segment

9.1.1.     Digital Precision Level Revenue Share By Application

9.2.        Construction

9.3.        Surveying

9.4.        Engineering

CHAPTER NO. 10: DIGITAL PRECISION LEVEL MARKET – BY END USER SEGMENT ANALYSIS

10.1.      Digital Precision Level Overview by End User Segment

10.1.1.  Digital Precision Level Revenue Share By End User

10.2.      Commercial

10.3.      Industrial

10.4.      Residential

CHAPTER NO. 11: DIGITAL PRECISION LEVEL MARKET – REGIONAL ANALYSIS

11.1.      Digital Precision Level Overview by Region Segment

11.1.1.  Global Digital Precision Level Revenue Share By Region

11.1.2.  Regions

11.1.3.  Global Digital Precision Level Revenue By Region

11.1.4. Type

11.1.5.  Global Digital Precision Level Revenue By Type

11.1.6.  Application

11.1.7. Global Digital Precision Level Revenue By Application

11.1.8. End User

11.1.9. Global Digital Precision Level Revenue By End User

CHAPTER NO. 12: NORTH AMERICA DIGITAL PRECISION LEVEL MARKET – COUNTRY ANALYSIS

12.1.      North America Digital Precision Level Overview by Country Segment

12.1.1.  North America Digital Precision Level Revenue Share By Region

12.2.      North America

12.2.1.  North America Digital Precision Level Revenue By Country

12.2.2.  Type

12.2.3.  North America Digital Precision Level Revenue By Type

12.2.4.  Application

12.2.5.  North America Digital Precision Level Revenue By Application

12.2.6.  End User

12.2.7.  North America Digital Precision Level Revenue By End User

2.3.        U.S.

12.4.      Canada

12.5.      Mexico

CHAPTER NO. 13: EUROPE DIGITAL PRECISION LEVEL MARKET – COUNTRY ANALYSIS

13.1.      Europe Digital Precision Level Overview by Country Segment

13.1.1.  Europe Digital Precision Level Revenue Share By Region

13.2.      Europe

13.2.1.  Europe Digital Precision Level Revenue By Country

13.2.2.  Type

13.2.3.  Europe Digital Precision Level Revenue By Type

13.2.4.  Application

13.2.5.  Europe Digital Precision Level Revenue By Application

13.2.6.  End User

13.2.7.  Europe Digital Precision Level Revenue By End User

13.3.      UK

13.4.      France

13.5.      Germany

13.6.      Italy

13.7.      Spain

13.8.      Russia

13.9.   Rest of Europe

CHAPTER NO. 14: ASIA PACIFIC DIGITAL PRECISION LEVEL MARKET – COUNTRY ANALYSIS

14.1.      Asia Pacific Digital Precision Level Overview by Country Segment

14.1.1.  Asia Pacific Digital Precision Level Revenue Share By Region

14.2.      Asia Pacific

14.2.1.  Asia Pacific Digital Precision Level Revenue By Country

14.2.2.  Type

14.2.3.  Asia Pacific Digital Precision Level Revenue By Type

14.2.4.  Application

14.2.5.  Asia Pacific Digital Precision Level Revenue By Application

14.2.5.  End User

14.2.7.  Asia Pacific Digital Precision Level Revenue By End User

14.3.      China

14.4.      Japan

14.5.      South Korea

14.6.      India

14.7.      Australia

14.8.      Southeast Asia

14.9.      Rest of Asia Pacific

CHAPTER NO. 15: LATIN AMERICA DIGITAL PRECISION LEVEL MARKET – COUNTRY ANALYSIS

15.1.      Latin America Digital Precision Level Overview by Country Segment

15.1.1.  Latin America Digital Precision Level Revenue Share By Region

15.2.      Latin America

15.2.1.  Latin America Digital Precision Level Revenue By Country

15.2.2.  Type

15.2.3.  Latin America Digital Precision Level Revenue By Type

15.2.4.  Application

15.2.5.  Latin America Digital Precision Level Revenue By Application

15.2.6.  End User

15.2.7.  Latin America Digital Precision Level Revenue By End User

15.3.      Brazil

15.4.      Argentina

15.5.      Rest of Latin America

CHAPTER NO. 16: MIDDLE EAST DIGITAL PRECISION LEVEL MARKET – COUNTRY ANALYSIS

16.1.      Middle East Digital Precision Level Overview by Country Segment

16.1.1.  Middle East Digital Precision Level Revenue Share By Region

16.2.      Middle East

16.2.1.  Middle East Digital Precision Level Revenue By Country

16.2.2.  Type

16.2.3.  Middle East Digital Precision Level Revenue By Type

16.2.4.  Application

16.2.5.  Middle East Digital Precision Level Revenue By Application

16.2.6.  End User

16.2.7.  Middle East Digital Precision Level Revenue By End User

16.3.      GCC Countries

16.4.      Israel

16.5.      Turkey

16.6.      Rest of Middle East

CHAPTER NO. 17: AFRICA DIGITAL PRECISION LEVEL MARKET – COUNTRY ANALYSIS

17.1.      Africa Digital Precision Level Overview by Country Segment

17.1.1.  Africa Digital Precision Level Revenue Share By Region

17.2.      Africa

17.2.1.  Africa Digital Precision Level Revenue By Country

17.2.2.  Type

17.2.3.  Africa Digital Precision Level Revenue By Type

17.2.4.  Application

17.2.5.  Africa Digital Precision Level Revenue By Application

17.2.6.  End User

17.2.7.  Africa Digital Precision Level Revenue By End User

17.3.      South Africa

17.4.      Egypt

17.5.      Rest of Africa

CHAPTER NO. 18: COMPANY PROFILES 

18.1.      Status Pro

18.1.1.  Company Overview

18.1.2.  Product Portfolio

18.1.3.  Financial Overview

18.1.4.  Recent Developments

18.1.5.  Growth Strategy

18.1.6.  SWOT Analysis

18.2.      Digi-Pas Technologies

18.3.      Mitutoyo

18.4.      Microplan Italia

18.5.      WYLER AG

18.6.      ULTRA PRÄZISION MESSZEUGE

18.7.      RÖCKLE

18.8.      Laserliner

18.9.      GemRed

18.10.    Fred V. Fowler

Request Free Sample

We prioritize the confidentiality and security of your data. Our promise: your information remains private.

Ready to Transform Data into Decisions?

Request Your Sample Report and Start Your Journey of Informed Choices


Providing the strategic compass for industry titans.

cr-clients-logos

Frequently Asked Questions

What is the current market size for Global Digital Precision Level Market, and what is its projected size in 2032?

The Global Digital Precision Level Market size was valued at USD 293.22 million in 2018, reaching USD 448.81 million in 2024, and is anticipated to grow to USD 815.06 million by 2032. It reflects strong and steady expansion across industries.

At what Compound Annual Growth Rate is the Global Digital Precision Level Market projected to grow between 2025 and 2032?

The Global Digital Precision Level Market is projected to grow at a CAGR of 7.21% during the forecast period. It highlights consistent momentum supported by adoption in construction, industrial, and aerospace applications.

What are the primary factors fueling the growth of the Global Digital Precision Level Market?

Key factors include rising infrastructure investments, growth in manufacturing and aerospace, and demand for quality compliance. Integration of smart features and adoption across commercial and industrial sectors further strengthen growth.

Who are the leading companies in the Global Digital Precision Level Market?

Major players include Status Pro, Digi-Pas Technologies, Mitutoyo, Microplan Italia, WYLER AG, and Laserliner. These companies focus on innovation, global distribution, and industry-specific product offerings.

Which region commanded the largest share of the Global Digital Precision Level Market in 2024?

North America commanded the largest share in 2024, supported by advanced construction, aerospace, and industrial adoption. Strong technology infrastructure and high safety compliance drive continued dominance in the region.

About Author

Sushant Phapale

Sushant Phapale

ICT & Automation Expert

Sushant is an expert in ICT, automation, and electronics with a passion for innovation and market trends.

View Profile

Related Reports

Digital Coupon Product Market

The Global Digital Coupon Product Market size was valued at USD 2,138.25 million in 2018 to USD 4,283.28 million in 2024 and is anticipated to reach USD 12,742.34 million by 2032, at a CAGR of 13.61% during the forecast period.

Digital Musculoskeletal (MSK) Care Market

The Global Digital Musculoskeletal (MSK) Care Market size was valued at USD 1,849.57 million in 2018, grew to USD 3,675.00 million in 2024, and is anticipated to reach USD 11,873.21 million by 2032, at a CAGR of 14.72% during the forecast period

Digital Media Adapters Market

The Global Digital Media Adapters Market size was valued at USD 3,843.62 million in 2018 to USD 6,230.28 million in 2024 and is anticipated to reach USD 12,498.61 million by 2032, at a CAGR of 8.47% during the forecast period.

Digital Learning Tools Market

The Global Digital Learning Tools Market size was valued at USD 20.71 million in 2018 to USD 39.12 million in 2024 and is anticipated to reach USD 100.80 million by 2032, at a CAGR of 11.70% during the forecast period.

Driving School Software Market

Driving School Software Market size was valued at USD 58.38 million in 2018 to USD 99.66 million in 2024 and is anticipated to reach USD 184.40 million by 2032, at a CAGR of 7.45% during the forecast period.

Digital Slide Scanner Market

The Global Digital Slide Scanners Market size was valued at USD 78.11 million in 2018 to USD 140.43 million in 2024 and is anticipated to reach USD 363.83 million by 2032, at a CAGR of 11.77% during the forecast period.

Digital TV SoC Market

The digital TV SoC market size was valued at USD 13.02 billion in 2024 and is anticipated to reach USD 33.17 billion by 2030, growing at a CAGR of 12.4% during the forecast period.

Gaming NFT Market

The Gaming NFT Market size was valued at USD 4.79 billion in 2024 and is anticipated to reach USD 27.83 billion by 2032, at a CAGR of 24.6% during the forecast period (2024-2032).

Furniture Manufacturing Software Market

The furniture manufacturing software market size was valued at USD 13.55 billion in 2024 and is expected to reach USD 20.33 billion by 2030, growing at a CAGR of 5.2% during the forecast period.

Document Capture Software Market

Document Capture Software Market size was valued at USD 16,300.00 million in 2018 to USD 22,191.04 million in 2024 and is anticipated to reach USD 43,330.09 million by 2032, at a CAGR of 8.78% during the forecast period.

System Integration Market

The System Integration Market is projected to grow from USD 368.07 million in 2024 to an estimated USD 940.03 million by 2032, with a compound annual growth rate (CAGR) of 11.59% from 2024 to 2032.

Optical Network Equipment Market

The optical network equipment market size was valued at USD 16062.5 million in 2024 and is anticipated to reach USD 41212.9 million by 2032, at a CAGR of 12.5 % during the forecast period (2024-2032).

Licence Option

The report comes as a view-only PDF document, optimized for individual clients. This version is recommended for personal digital use and does not allow printing. Use restricted to one purchaser only.
$4999

To meet the needs of modern corporate teams, our report comes in two formats: a printable PDF and a data-rich Excel sheet. This package is optimized for internal analysis. Unlimited users allowed within one corporate location (e.g., regional office).
$6999

The report will be delivered in printable PDF format along with the report’s data Excel sheet. This license offers 100 Free Analyst hours where the client can utilize Credence Research Inc. research team. Permitted for unlimited global use by all users within the purchasing corporation, such as all employees of a single company.
$12999

Report delivery within 24 to 48 hours

Credence Staff 3

WILLIAM, North America

Support Staff at Credence Research

KEITH PHILLIPS, Europe

Lee - CR Sales Staff

LEE VALLANCE, Asia Pacific

Kieran Jameson

KIERAN JAMESON, Australia

Smallform of Sample request
User Review

Thank you for the data! The numbers are exactly what we asked for and what we need to build our business case.

Materials Scientist
(privacy requested)

User Review

The report was an excellent overview of the Industrial Burners market. This report does a great job of breaking everything down into manageable chunks.

Imre Hof
Management Assistant, Bekaert

cr-clients-logos

Request Sample