Market Overview:
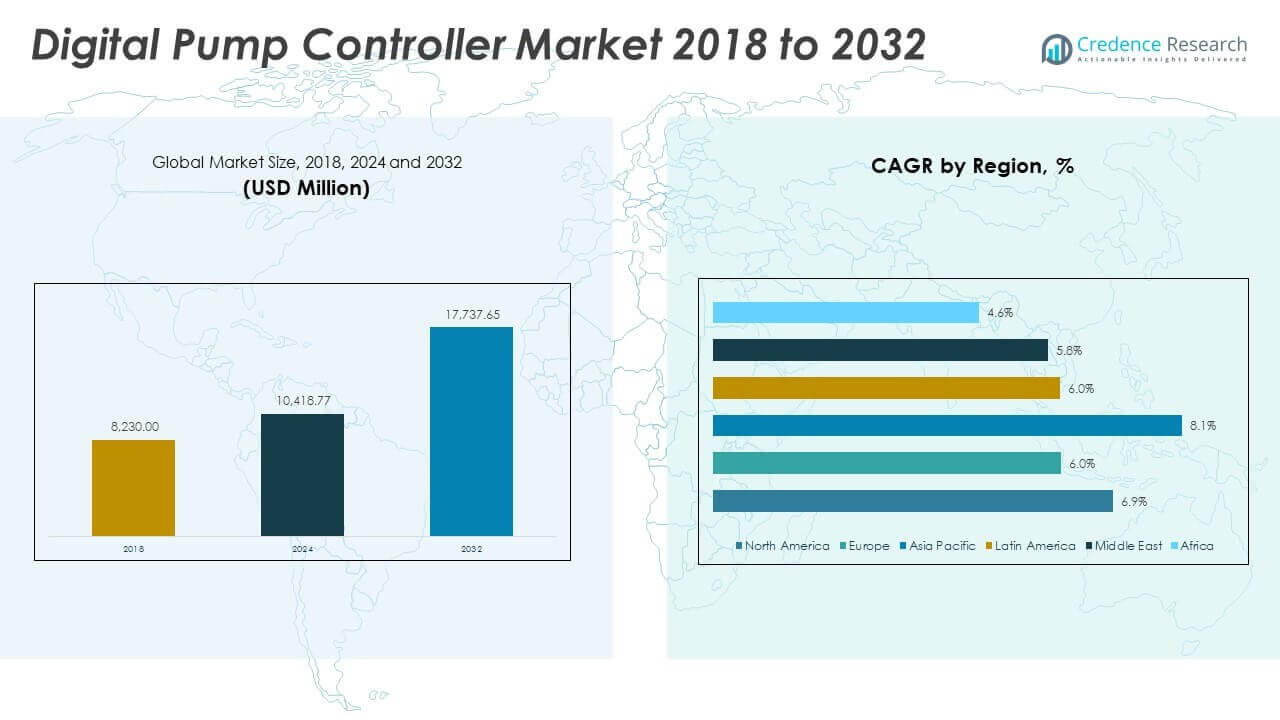
The Digital Pump Controller Market size was valued at USD 8,230.00 million in 2018 to USD 10,418.77 million in 2024 and is anticipated to reach USD 17,737.65 million by 2032, at a CAGR of 6.91% during the forecast period.
| REPORT ATTRIBUTE |
DETAILS |
| Historical Period |
2020-2023 |
| Base Year |
2024 |
| Forecast Period |
2025-2032 |
| Digital Pump Controller Market Size 2024 |
USD 10,418.77 Million |
| Digital Pump Controller Market, CAGR |
6.91% |
| Digital Pump Controller Market Size 2032 |
USD 17,737.65 Million |
Market growth is driven by rising demand for automation in water and fluid management across industrial, agricultural, and residential applications. Growing emphasis on energy efficiency and cost savings encourages adoption of digital controllers that reduce wastage and enhance performance. Increased investment in smart infrastructure projects, coupled with advancements in IoT-enabled pump systems, also supports demand. Furthermore, government initiatives promoting sustainable water usage and the need for precise pump monitoring strengthen the market outlook.
Regionally, Asia-Pacific leads the market due to rapid urbanization, industrial expansion, and strong agricultural demand for efficient water systems. North America shows significant growth, supported by technological innovation and the modernization of industrial facilities. Europe maintains steady progress with strict energy regulations and sustainability policies driving adoption. Emerging markets in Latin America and the Middle East are experiencing rising demand as water scarcity and infrastructure development projects accelerate the uptake of advanced pump controllers.
Market Insights:
- The Digital Pump Controller Market was valued at USD 8,230.00 million in 2018, reached USD 10,418.77 million in 2024, and is expected to achieve USD 17,737.65 million by 2032, growing at a CAGR of 6.91%.
- North America led with 36.7% share in 2024, supported by advanced infrastructure and strong regulatory focus, followed by Asia Pacific at 28.0% due to industrialization and irrigation demand, and Europe at 21.4% with strict efficiency regulations.
- Asia Pacific is the fastest-growing region with an 8.1% CAGR and 28.0% share in 2024, driven by industrial expansion, agricultural modernization, and rapid urbanization.
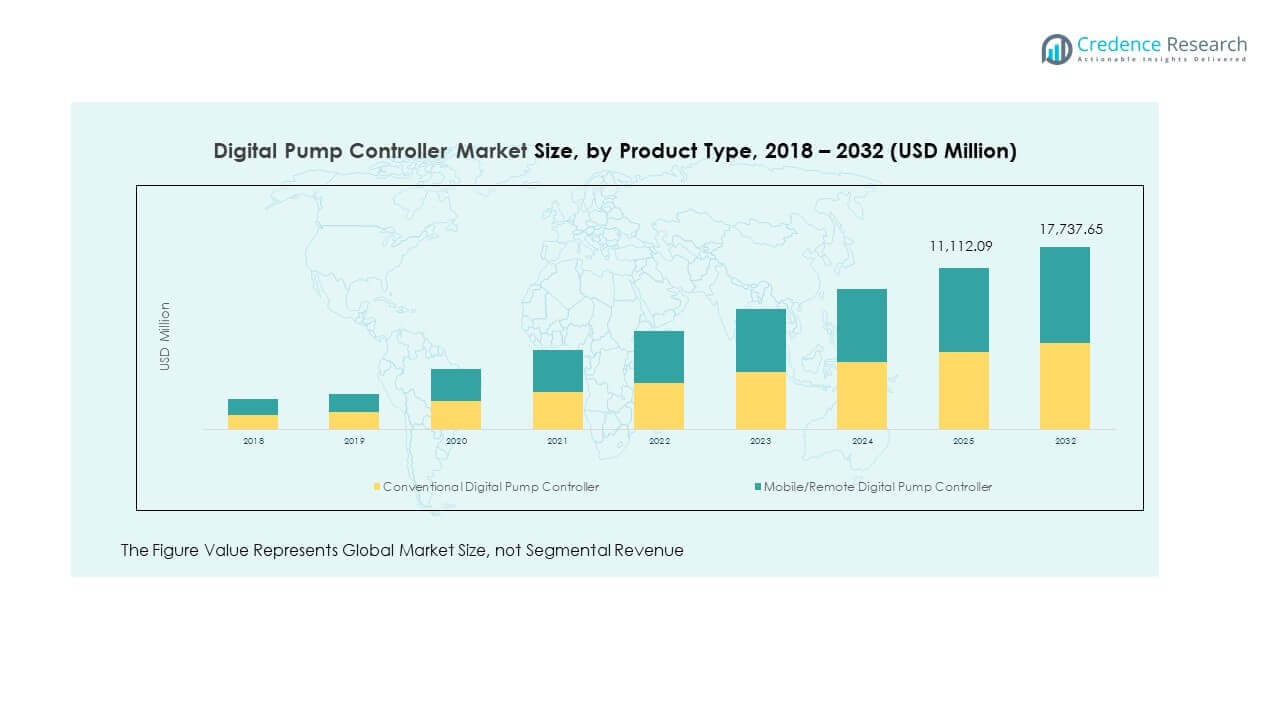
- In 2024, conventional digital pump controllers represented 40.2% of market revenue, reflecting their cost-effectiveness and ease of integration across industries.
- Mobile/remote digital pump controllers accounted for 59.8% of revenue in 2024, highlighting growing demand for smart monitoring, IoT connectivity, and remote operations.
Access crucial information at unmatched prices!
Request your sample report today & start making informed decisions powered by Credence Research Inc.!
Download Sample
Market Drivers:
Growing Automation and Energy Efficiency Focus Across Industries
The Digital Pump Controller Market is expanding rapidly due to increasing automation across industries. Manufacturers and end-users demand precise control over fluid management, leading to higher adoption of digital solutions. It ensures reduced wastage, lower energy bills, and improved equipment life, which drives investment. Industries such as manufacturing, power generation, and chemicals require efficient pump systems for uninterrupted operations. Agricultural applications also create demand, with farmers opting for smart pump controllers to manage irrigation efficiently. Government initiatives supporting energy conservation strengthen the adoption of digital controllers in critical sectors. Rising awareness of operational efficiency and smart water management continues to boost market penetration. Strong demand from multiple end-use industries positions the market for sustained growth.
Expansion of Smart Infrastructure and IoT Integration Across Applications
The growing development of smart infrastructure supports the strong adoption of advanced pump controllers. The Digital Pump Controller Market benefits from IoT-enabled monitoring and data-driven insights that improve productivity. It helps operators detect failures early, predict maintenance, and ensure continuous flow management. Rapid integration with SCADA and advanced automation platforms drives real-time visibility and control. The shift toward connected devices in industrial and residential setups pushes adoption further. Governments and private players invest heavily in smart city projects, reinforcing the demand for smart pumping solutions. It improves overall water management efficiency, aligning with sustainability goals in both developed and emerging markets. Enhanced control features and connectivity continue to expand the application scope across industries.
- For example, Siemens deployed SIMOCODE pro for intelligent motor management of boiler soot blowers used by Clyde Bergemann. The system enables active I/O monitoring, internal fault detection, and automatic disabling of faulty equipment, enhancing plant safety and minimizing downtime—without relying on complex hardwired circuits or the PLC for protection logic. It also supports integrated protection features and local diagnostics, improving reliability in harsh environments.
Rising Demand for Water Conservation and Sustainable Solutions
Sustainable practices are now essential, and industries seek technologies that save energy and conserve water. The Digital Pump Controller Market benefits from its role in enabling better water management. It reduces excessive pumping, prevents leakages, and optimizes operations for long-term efficiency. Growing water scarcity in multiple regions compels industries and municipalities to deploy smart controllers. Environmental regulations further mandate the adoption of systems that limit waste. These controllers help industries align operations with global sustainability targets. It supports both urban water supply networks and agricultural irrigation systems that face rising pressure. Widespread use in sustainable infrastructure projects strengthens long-term demand for digital pump controllers.
Industrial Modernization and Increasing Demand in Agriculture Sector
The ongoing modernization of industrial plants fuels the market, as advanced pumps ensure higher productivity. The Digital Pump Controller Market gains traction due to the agriculture sector’s rising dependence on automated irrigation. It provides farmers with reliable, cost-effective tools to optimize resource usage. The demand grows stronger with rural electrification programs and government support for modern irrigation. Industrial users adopt smart pump controllers to reduce downtime and improve safety standards. Energy-saving designs and predictive features enhance operational reliability across sectors. It allows businesses to reduce labor costs and adopt digital control systems with confidence. Market adoption continues to expand with advancements in control algorithms and industrial standards.
- For instance, Jain Irrigation Systems, in partnership with the International Finance Corporation (IFC), conducted a field case study in Maharashtra, India, which demonstrated that drip irrigation reduced the water footprint by 42% compared to flood irrigation, while the grey water footprint declined by nearly 90%, as validated through project reporting.
Market Trends:
Adoption of Cloud-Based Monitoring Platforms for Pumping Systems
The increasing use of cloud-based monitoring is shaping new applications for digital pump controllers. The Digital Pump Controller Market witnesses rising demand for real-time remote data access. It allows operators to manage pumps across multiple locations without physical presence. This reduces travel, improves safety, and enhances response to critical alerts. Cloud-based solutions support predictive maintenance by analyzing system behavior over time. Remote configuration options allow users to optimize operations without halting processes. It also offers scalability, making cloud platforms viable for small and large facilities. This trend ensures continued innovation in the connectivity of pump controllers.
- For example, Grundfos’ iSOLUTIONS Suite is an IIoT platform that connects pumps to the cloud for remote monitoring, diagnostics, and data access. It includes modules such as GiS-Monitor and GiS-Diagnostor and has earned international recognition, including the Red Dot Award, for its innovative design in digital pump management.
Integration of Artificial Intelligence and Advanced Analytics Tools
The integration of AI and analytics tools is driving transformation in pumping systems. The Digital Pump Controller Market benefits as AI enhances predictive maintenance and fault detection. It allows for real-time diagnostics, minimizing operational risks and improving safety. Machine learning models help in adjusting pump performance for maximum efficiency. Industries leverage analytics dashboards for decision-making and cost control. It creates opportunities for advanced optimization, especially in energy-intensive operations. The combination of AI with IoT strengthens monitoring and control capabilities. This trend pushes manufacturers to embed intelligent features for competitive advantage.
Customization of Pump Controllers for Industry-Specific Applications
The demand for specialized pump controllers is rising across industries with unique requirements. The Digital Pump Controller Market adapts with customized solutions for agriculture, oil and gas, and manufacturing. It enables industries to implement controllers aligned with their operational needs. Manufacturers design systems that handle variable fluid types and pressure conditions. Industry-specific programming enhances efficiency and minimizes downtime during operations. It creates opportunities for partnerships between equipment manufacturers and solution providers. The focus on tailored solutions ensures better user adoption across industries. This trend strengthens the role of customization in expanding application scope.
Growing Role of Wireless Communication and Mobile Accessibility
The adoption of wireless communication technologies is reshaping pump controller design. The Digital Pump Controller Market benefits as users demand mobile-based accessibility. It allows operators to control pumps remotely using smartphones or tablets. This ensures higher flexibility and responsiveness in critical applications. Wireless technologies eliminate extensive wiring, reducing installation time and costs. It also supports integration with smart home and industrial automation platforms. Mobile-based control offers end-users a simple interface for monitoring and adjustments. The growing emphasis on wireless access strengthens adoption in both developed and emerging regions.
- For example, Schneider Electric’s EcoStruxure Power Device app, officially listed in the company’s mobile platform directory, enables wireless (Wi-Fi, Bluetooth, NFC) monitoring and control of its MV/LV protection relays and circuit breakers. The app delivers real-time notifications, operational data, and mobile-based configuration capabilities. It supports multiple languages and remains up-to-date as of 2025.
Market Challenges Analysis:
High Initial Costs and Complex Integration Barriers
The adoption of advanced controllers faces challenges linked to high upfront costs and complex integration. The Digital Pump Controller Market is affected by budget constraints in small and medium enterprises. It creates barriers to entry, particularly in emerging economies with limited infrastructure. Complex integration with legacy systems also slows down adoption rates. Training requirements add to the operational cost burden, reducing short-term feasibility. It impacts industries that prioritize cost savings over advanced efficiency. Manufacturers address these challenges by offering scalable models and financing options. Despite these measures, cost-sensitive markets continue to hesitate in upgrading systems.
Technical Limitations and Lack of Awareness Among End-Users
Limited awareness of advanced pump technologies reduces adoption in underdeveloped and rural markets. The Digital Pump Controller Market is constrained by users who lack knowledge of long-term benefits. It affects agricultural sectors where traditional pumps remain dominant. Technical limitations, such as compatibility issues and connectivity failures, also create barriers. Poor access to skilled maintenance services slows widespread adoption. It hinders confidence among first-time users of advanced control systems. Educational campaigns and awareness programs help but need broader coverage. Overcoming these limitations remains a significant challenge for market expansion.
Market Opportunities:
Expansion in Emerging Economies with Strong Agricultural Growth
Emerging economies provide strong growth potential as industries and agriculture modernize. The Digital Pump Controller Market benefits from rising irrigation needs and growing investments in infrastructure. It creates opportunities for local and global players to expand operations. Rising government support for smart farming further accelerates adoption rates. The presence of water scarcity challenges drives attention toward advanced control solutions. It allows cost-effective deployment of digital controllers across large agricultural bases. Strong demand in Asia-Pacific, Latin America, and Africa supports long-term opportunities. These regions remain critical to the future trajectory of the market.
Advancements in Connectivity and Integration with Smart Systems
Technological advancements create opportunities for advanced pump controller adoption across sectors. The Digital Pump Controller Market gains from integration with IoT, AI, and smart automation. It allows real-time visibility and stronger control over complex pumping operations. Continuous development in wireless connectivity ensures broader access and scalability. Industries demand smart solutions for efficiency, safety, and compliance with sustainability goals. It creates scope for partnerships between digital solution providers and pump manufacturers. These opportunities ensure steady growth in demand for advanced pumping technologies. Expanding integration capabilities keep the market highly attractive for innovation-driven companies.
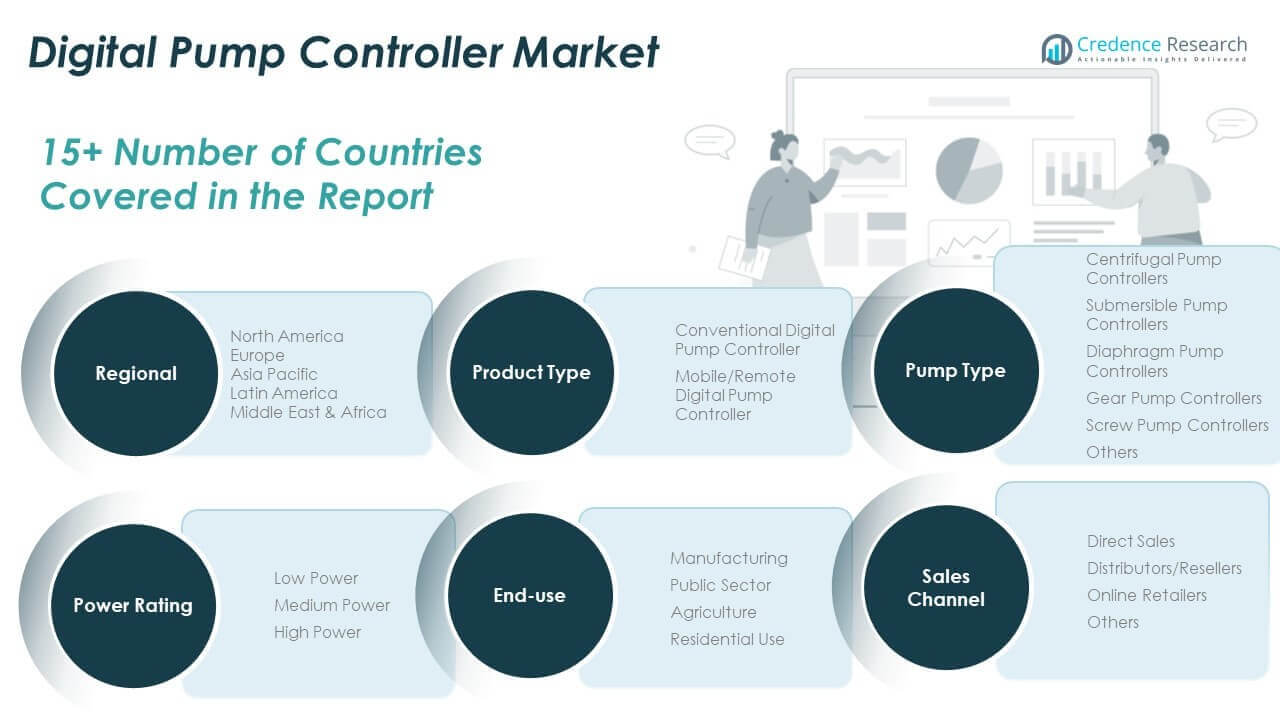
Market Segmentation Analysis:
The Digital Pump Controller Market demonstrates strong segmentation across product type, pump type, end-use, power rating, and sales channels.
By product type, conventional controllers remain widely used due to cost-effectiveness and simple integration, while mobile and remote controllers gain traction with the rise of smart monitoring and IoT connectivity.
- For instance, Pepperl+Fuchs offers a HART Loop Converter and HART Multiplexer (e.g., the HiDMux2700) that enable integration of conventional pump control instruments with distributed control systems. These devices allow seamless connection of HART-enabled field equipment to host systems over RS-485, ensuring cost-efficient signal transmission and compatibility in process environments.
By pump type, centrifugal and submersible pump controllers dominate demand, supported by their extensive use in industrial and agricultural applications, whereas diaphragm, gear, and screw pump controllers serve niche requirements in chemical, oil, and precision-driven operations.
By end-use, manufacturing leads adoption due to the need for efficiency and reduced downtime, while agriculture contributes significantly with demand for smart irrigation solutions. Public sector projects, including water supply and wastewater management, expand the adoption of advanced controllers, and residential use is growing steadily with rising awareness of automated water systems.
By power rating, medium-power controllers hold significant share due to balanced efficiency and capacity, low-power units cater to household and small-scale operations, and high-power controllers find applications in large-scale industrial facilities.
- For instance, ABB’s ACQ580 drive series serves medium-power water and wastewater applications in municipal and industrial environments. It delivers built-in pump features such as anti-cavitation, multipump control, sensorless flow calculation, dry-run and level protection. These functions support reliable, energy-efficient operation, enhanced safety, and reduced downtime, as showcased in ABB technical overviews.
By sales channel, direct sales maintain strong penetration through established industrial contracts, while distributors and resellers extend market reach across regional and rural areas. Online retail is witnessing growth, driven by accessibility and rising consumer preference for remote-enabled solutions. Others, including system integrators, support customized installations in specialized sectors. The diversity across these segments positions the Digital Pump Controller Market for long-term expansion across industries and geographies.
Segmentation:
By Product Type
- Conventional Digital Pump Controller
- Mobile/Remote Digital Pump Controller
By Pump Type
- Centrifugal Pump Controllers
- Submersible Pump Controllers
- Diaphragm Pump Controllers
- Gear Pump Controllers
- Screw Pump Controllers
- Others
By End-use
- Manufacturing
- Public Sector
- Agriculture
- Residential Use
By Power Rating
- Low Power
- Medium Power
- High Power
By Sales Channel
- Direct Sales
- Distributors/Resellers
- Online Retailers
- Others
By Region
- North America (U.S., Canada, Mexico)
- Europe (UK, France, Germany, Italy, Spain, Russia, Rest of Europe)
- Asia Pacific (China, Japan, South Korea, India, Australia, Southeast Asia, Rest of Asia Pacific)
- Latin America (Brazil, Argentina, Rest of Latin America)
- Middle East (GCC Countries, Israel, Turkey, Rest of Middle East)
- Africa (South Africa, Egypt, Rest of Africa)
Regional Analysis:
North America
The North America Digital Pump Controller Market size was valued at USD 3,061.56 million in 2018 to USD 3,829.88 million in 2024 and is anticipated to reach USD 6,511.52 million by 2032, at a CAGR of 6.9% during the forecast period. North America holds 36.7% share of the global market in 2024, reflecting its strong adoption across industries. The region benefits from advanced industrial infrastructure and early adoption of automation technologies. The Digital Pump Controller Market in this region is supported by demand in manufacturing, water treatment, and residential automation. It is driven by regulatory focus on energy efficiency and sustainable water management. Agricultural modernization in the U.S. also supports expansion of smart irrigation controllers. Canada contributes with rising adoption of remote monitoring systems, while Mexico strengthens growth through public infrastructure projects. Strong presence of key global manufacturers ensures innovation and competitive offerings in this region.
Europe
The Europe Digital Pump Controller Market size was valued at USD 1,843.52 million in 2018 to USD 2,227.25 million in 2024 and is anticipated to reach USD 3,543.14 million by 2032, at a CAGR of 6.0% during the forecast period. Europe accounts for 21.4% share of the global market in 2024, supported by strict energy-efficiency policies. The Digital Pump Controller Market here benefits from regulatory compliance and investment in smart water systems. It is driven by strong demand in Germany, the UK, and France, with industries focusing on automation and predictive maintenance. Water scarcity challenges in Southern Europe encourage adoption of advanced pumping technologies. Industrial modernization across the region further drives installation of efficient controllers. The residential segment sees steady growth through smart home integration. Eastern Europe emerges as a growth frontier with increasing infrastructure investment. Strong sustainability policies continue to shape long-term adoption trends across industries.
Asia Pacific
The Asia Pacific Digital Pump Controller Market size was valued at USD 2,213.05 million in 2018 to USD 2,914.61 million in 2024 and is anticipated to reach USD 5,431.28 million by 2032, at a CAGR of 8.1% during the forecast period. Asia Pacific contributes 28.0% share of the global market in 2024, reflecting its dynamic expansion across sectors. The Digital Pump Controller Market in this region benefits from rapid industrialization, urbanization, and government investments in smart infrastructure. It is driven strongly by agriculture in India and China, where irrigation modernization is a priority. Japan and South Korea support growth through high adoption of automation in manufacturing facilities. Southeast Asia contributes with rising residential demand for water efficiency solutions. The region also sees investment in renewable energy projects, supporting industrial pump requirements. Growing focus on sustainability aligns with adoption of advanced controllers. Strong local manufacturing presence ensures competitive pricing and wider accessibility.
Latin America
The Latin America Digital Pump Controller Market size was valued at USD 554.70 million in 2018 to USD 695.87 million in 2024 and is anticipated to reach USD 1,104.52 million by 2032, at a CAGR of 6.0% during the forecast period. Latin America represents 6.7% share of the global market in 2024, supported by steady infrastructure development. The Digital Pump Controller Market in this region is influenced by Brazil’s strong agricultural base, where smart irrigation solutions drive demand. It is also supported by rising investments in public sector water supply and wastewater projects. Mexico and Argentina expand adoption through government-backed modernization initiatives. Residential applications gain traction as awareness of water conservation grows. Industrial users in oil, gas, and mining show increasing interest in automation. The lack of advanced distribution channels slightly restrains rapid penetration. Long-term opportunities exist through targeted investment in digital infrastructure.
Middle East
The Middle East Digital Pump Controller Market size was valued at USD 370.35 million in 2018 to USD 443.77 million in 2024 and is anticipated to reach USD 693.64 million by 2032, at a CAGR of 5.8% during the forecast period. The Middle East holds 4.3% share of the global market in 2024, influenced by large-scale water infrastructure needs. The Digital Pump Controller Market benefits from high demand for smart water management in arid regions. It is driven by GCC countries investing heavily in desalination and wastewater treatment facilities. Public sector projects dominate adoption, supported by strong government spending. Industrial applications, especially oil and gas, also contribute to demand for high-power controllers. Israel supports adoption with a focus on advanced irrigation solutions. Turkey contributes with industrial modernization and infrastructure expansion. Growing population and urbanization continue to support long-term demand across the region.
Africa
The Africa Digital Pump Controller Market size was valued at USD 186.82 million in 2018 to USD 307.40 million in 2024 and is anticipated to reach USD 453.54 million by 2032, at a CAGR of 4.6% during the forecast period. Africa accounts for 2.9% share of the global market in 2024, representing a smaller but emerging segment. The Digital Pump Controller Market in this region is driven mainly by public water supply projects and agriculture. It is supported by government-led rural electrification and irrigation schemes. South Africa leads adoption due to higher industrial development and infrastructure modernization. Egypt also shows potential with large-scale agricultural projects. Limited awareness and high cost remain barriers to widespread adoption. The residential segment grows gradually as urbanization expands. Long-term opportunities exist through international partnerships and investments in water conservation technologies.
Shape Your Report to Specific Countries or Regions & Enjoy 30% Off!
Key Player Analysis:
- Grundfos Holding A/S
- Xylem Inc.
- ABB Ltd.
- Emerson Electric Co.
- Schneider Electric SE
- Siemens AG
- Honeywell International Inc.
- Rockwell Automation, Inc.
- Johnson Controls International
- Wilo SE
Competitive Analysis:
The Digital Pump Controller Market features strong competition among global and regional players focusing on innovation, product reliability, and smart integration. Leading companies such as Grundfos, Xylem, ABB, Siemens, Schneider Electric, and Emerson dominate through extensive product portfolios and established distribution networks. It is shaped by continuous investment in IoT-enabled solutions, predictive maintenance features, and energy-efficient designs. Smaller firms and regional players strengthen competition by offering cost-effective solutions tailored to local markets. Partnerships, acquisitions, and geographic expansion remain common strategies for maintaining market share. The competitive landscape reflects a shift toward advanced connectivity, mobile accessibility, and customized solutions across industries. It continues to evolve as manufacturers prioritize digitalization and sustainable water management technologies to secure long-term growth and customer loyalty.
Recent Developments:
- In August 2025, Grundfos entered into an agreement to acquire Newterra, a Pittsburgh-based company specializing in water and wastewater treatment solutions. This acquisition aims to strengthen Grundfos’ water treatment offering, particularly in North America, and supports the company’s objective to double its US business by 2030.
- In August 2025, ABB announced a new partnership with Hargrove Controls & Automation, making Hargrove a channel partner for ABB’s process automation solutions. This partnership will facilitate the deployment of ABB’s digital industrial automation technologies and expand resource-efficient solutions in the market.
- In January 2025, Xylem established two significant strategic distribution agreements with Pump Supplies and PDAS in the UK. These partnerships are designed to enhance the availability of Xylem’s advanced pump products and packaged pumping stations, further reinforcing its presence and after-sales service in Europe’s digital water and pumping solutions market.
Report Coverage:
The research report offers an in-depth analysis based on product type, pump type, end-use, power rating, and sales channels. It details leading market players, providing an overview of their business, product offerings, investments, revenue streams, and key applications. Additionally, the report includes insights into the competitive environment, SWOT analysis, current market trends, as well as the primary drivers and constraints. Furthermore, it discusses various factors that have driven market expansion in recent years. The report also explores market dynamics, regulatory scenarios, and technological advancements that are shaping the industry. It assesses the impact of external factors and global economic changes on market growth. Lastly, it provides strategic recommendations for new entrants and established companies to navigate the complexities of the market.
Future Outlook:
- The Digital Pump Controller Market will expand with rising adoption of automation across industries.
- Growing focus on energy efficiency will drive investments in advanced pump control systems.
- Integration of IoT and AI will create demand for real-time monitoring and predictive maintenance.
- Expansion of smart infrastructure projects will strengthen adoption in urban and industrial applications.
- Agricultural modernization will sustain growth as farmers adopt digital irrigation controllers.
- Rising demand for mobile and remote controllers will support adoption in residential and commercial sectors.
- Strong government initiatives for water conservation will accelerate deployment of efficient pump systems.
- Emerging economies will provide growth opportunities with rising industrial and agricultural investments.
- Product innovation will remain central as companies develop customized and connected solutions.
- Competitive intensity will increase with global players focusing on regional expansion and partnerships.


