
Market Overview:
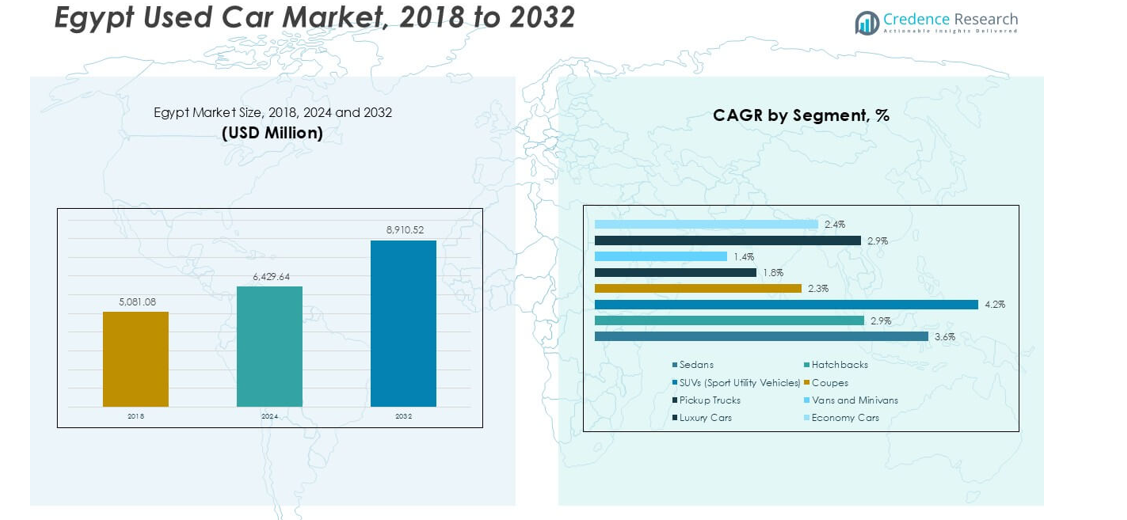
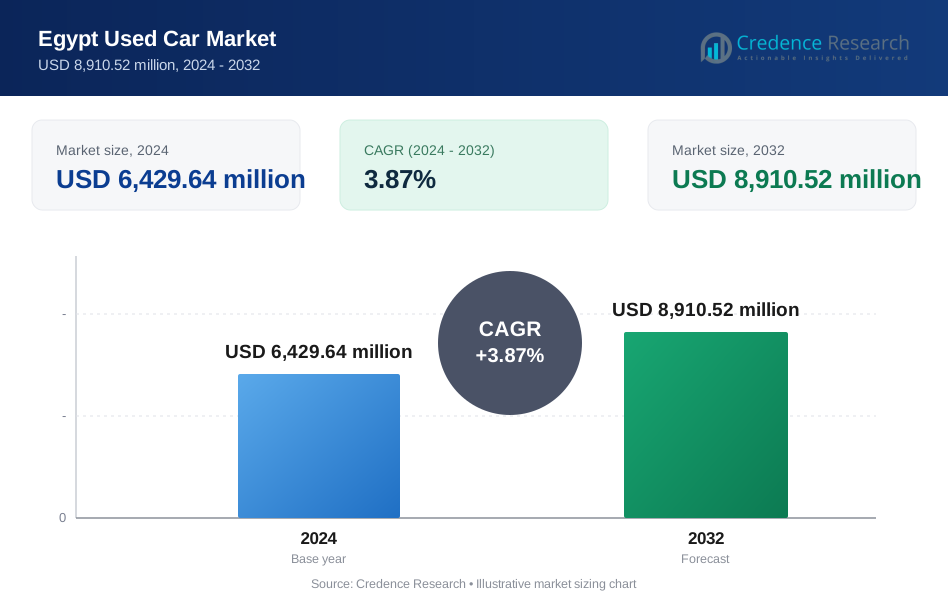
The Egypt used car market size was valued at USD 5,081.08 million in 2018, reaching USD 6,429.64 million in 2024, and is anticipated to reach USD 8,910.52 million by 2032, at a CAGR of 3.87% during the forecast period.
| REPORT ATTRIBUTE | DETAILS |
|---|---|
| Historical Period | 2020-2023 |
| Base Year | 2024 |
| Forecast Period | 2025-2032 |
| Egypt Used Car Market Size 2024 | USD 6,429.64 million |
| Egypt Used Car Market, CAGR | 3.87% |
| Egypt Used Car Market Size 2032 | USD 8,910.52 million |
The Egypt used car market is shaped by prominent players including Carswitch, OLX Egypt, Bey2ollak, Carmudi Egypt, Edfaraz Trading, Garagly, and Haraj Egypt, each competing through digital platforms, dealer networks, and value-added services. Carswitch and OLX Egypt lead in online reach, offering transparent listings and financing support, while Bey2ollak and Carmudi Egypt cater to niche buyer segments with localized offerings. Edfaraz Trading and Garagly maintain strong offline distribution networks, appealing to price-sensitive customers, while Haraj Egypt leverages regional presence to expand sales. Regionally, Cairo accounted for the largest share at 38% in 2024, supported by dense population, higher income levels, and advanced dealership infrastructure, followed by Alexandria with 22% share, reflecting strong port-linked supply and urban demand.
Market Insights
- The Egypt used car market was valued at USD 6,429.64 million in 2024 and is projected to reach USD 8,910.52 million by 2032, growing at a CAGR of 3.87%.
- Demand is driven by affordability, rising middle-class adoption, and digital platforms that provide financing, transparency, and easy access to vehicle listings.
- Key trends include growing interest in SUVs and mid-range models, expansion of certified pre-owned programs, and emerging demand for hybrid and electric vehicles as sustainability awareness increases.
- Competition is fragmented with leading players such as Carswitch, OLX Egypt, Bey2ollak, Carmudi Egypt, Edfaraz Trading, Garagly, and Haraj Egypt, focusing on pricing, quality assurance, and digital services to capture share.
- Regionally, Cairo leads with 38% share, followed by Alexandria at 22%, Delta and Canal Cities at 18%, Upper Egypt with 12%, and the Suez and Red Sea region accounting for 10%, reflecting strong urban concentration and trade-linked supply advantages.
Market Segmentation Analysis:
By Vehicle Types
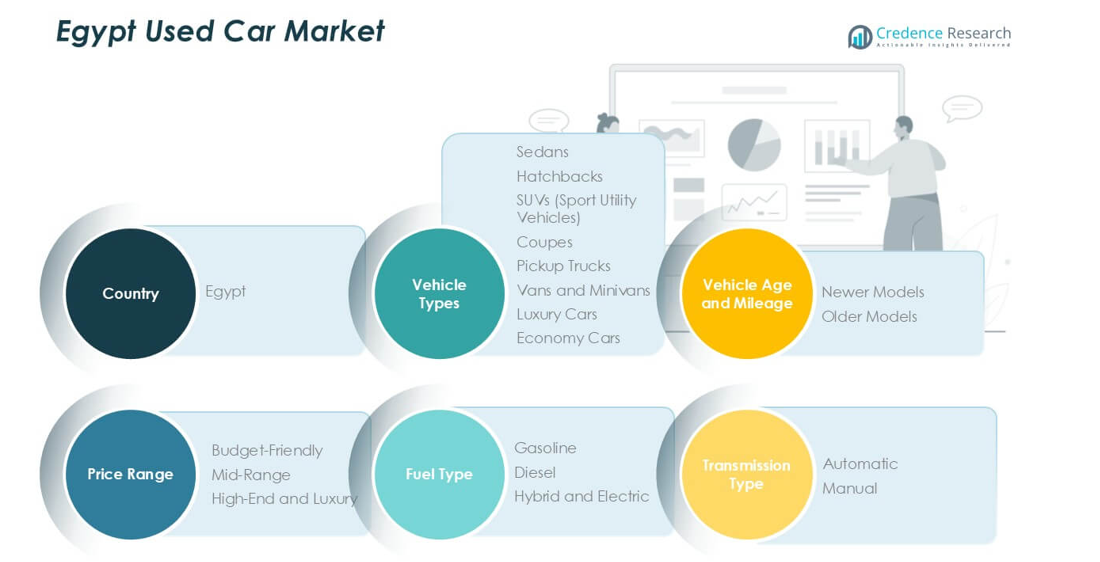
Sedans dominated the Egypt used car market in 2024, accounting for the largest share due to their affordability, fuel efficiency, and suitability for urban commuting. Hatchbacks followed closely, favored by budget-conscious buyers seeking compact and low-maintenance options. SUVs gained traction as rising demand for family vehicles and road adaptability increased their appeal, particularly among middle-class households. Coupes and pickup trucks captured niche demand, mainly among younger drivers and businesses requiring cargo space. Vans and minivans served multi-passenger needs, while luxury cars attracted a small but growing affluent segment. Economy cars sustained consistent demand owing to their practicality and lower ownership costs.
- For instance, during 2024, the Egyptian used car market saw significant activity among urban buyers in cities like Cairo and Alexandria. In this environment, popular subcompact models like the Hyundai i10 and Kia Picanto were in high demand.
By Vehicle Age and Mileage
Newer models held a higher revenue share in the Egypt used car market as buyers preferred vehicles with lower mileage and advanced safety and comfort features. Consumers increasingly valued reliability, better resale potential, and warranty benefits associated with these models. However, older models continued to find traction among price-sensitive buyers, particularly in rural and semi-urban areas where affordability outweighed modern features. The balance between affordability and quality positioned newer vehicles as the leading segment, supported by improved access to financing options and digital platforms that offer transparency in mileage and condition.
- For instance, in 2024, the Indian used car market was significantly larger than the market for new cars, with millions of total resale transactions. Vehicles between 3 and 5 years old accounted for nearly half of these transactions. Maruti Suzuki dominated the market with over a third of the total share, followed by Hyundai.
By Price Range
Budget-friendly vehicles dominated the market share in 2024, supported by Egypt’s growing middle- and lower-income population prioritizing cost-effective mobility. This segment thrived on affordability, wide availability, and low maintenance requirements. Mid-range vehicles gained ground as financing schemes and trade-in programs enabled upward mobility for urban buyers. High-end and luxury cars, though limited in demand, expanded steadily with rising disposable income and the presence of wealthy expatriates and professionals. Increasing imports of certified premium brands also contributed to this segment’s growth, while economic conditions ensured the budget-friendly segment remained the clear leader.
Key Growth Drivers
Rising Affordability and Consumer Demand
The Egypt used car market is witnessing strong growth due to rising affordability compared to new vehicles. With limited disposable income and high inflationary pressures, buyers increasingly opt for used cars as a cost-effective mobility solution. Flexible financing options and the expansion of online classified platforms make ownership more accessible, further fueling demand. Additionally, rising fuel costs and economic uncertainty push consumers toward pre-owned models that combine lower upfront costs with reduced depreciation. This price advantage strengthens consumer preference, positioning used vehicles as the practical choice for Egypt’s growing middle-class population.
- For instance, ContactCars, an Egypt-based auto marketplace, saw its paid dealer subscriptions more than double in the first quarter of 2024, attracting millions of unique monthly users. The company, which is a subsidiary of Contact Financial Holding, offers auto financing services.
Expansion of Digital and Online Sales Channels
The rapid digitalization of Egypt’s automotive sector has become a major growth driver. Online platforms and mobile applications now offer vehicle listings, transparent price comparisons, and integrated financing services, enhancing buyer confidence and convenience. The ability to check vehicle history and condition reports online reduces the risk of fraud and increases trust in transactions. Dealerships are also adapting by offering virtual showrooms, digital payment options, and doorstep delivery. This digital ecosystem attracts young, tech-savvy buyers, streamlining the sales process while boosting transaction volumes. As connectivity expands nationwide, digital channels are expected to reshape the competitive dynamics of the used car market.
- For instance, Sylndr, a used-car platform in Egypt, uses an AI-powered inspection process for quality verification. The system helps ensure the condition of vehicles before they are sold.
Growing Acceptance of Certified Pre-Owned (CPO) Programs
Certified pre-owned vehicles are gaining traction as consumers increasingly seek reliability and assurance. CPO cars undergo rigorous inspection and often come with extended warranties, offering a balance between affordability and quality. This appeals particularly to urban professionals and families who value peace of mind when purchasing used cars. Leading dealerships and global automakers have expanded their CPO programs in Egypt, making them a trusted alternative to “as-is” cars. The structured nature of CPO programs also supports financing options and insurance packages, strengthening consumer confidence. This segment’s rising popularity enhances overall market credibility and drives long-term growth.
Key Trends and Opportunities
Increasing Demand for SUVs and Mid-Range Cars
A key trend shaping Egypt’s used car market is the growing demand for SUVs and mid-range vehicles. SUVs appeal to families and individuals looking for greater comfort, safety, and adaptability to road conditions. Mid-range models benefit from affordability, better features, and financing schemes that attract upwardly mobile buyers. This shift creates opportunities for dealers to target middle-class consumers with attractive trade-in programs and value-added services. As urbanization rises and consumer aspirations grow, SUVs and mid-range vehicles are positioned as high-potential growth segments in the Egyptian used car ecosystem.
- For instance, used SUV sales saw significant growth in 2024, reflecting a broader consumer shift toward family-oriented vehicles. For example, market data from CARS24 shows that SUV sales increased their market share within the Indian used-car market from 12.6% in 2022 to 16.7% in 2024.
Rising Opportunity in Hybrid and Electric Used Cars
Hybrid and electric vehicles represent an emerging opportunity in Egypt’s used car market. While adoption is still at a nascent stage, rising awareness of fuel efficiency and government initiatives supporting electrification encourage demand. Used hybrid models offer a more affordable entry point into sustainable mobility compared to new electric cars. As charging infrastructure develops and fuel prices rise, consumer interest in pre-owned eco-friendly models is expected to grow. This trend positions hybrid and electric used vehicles as a promising niche for forward-looking dealers and investors seeking to align with sustainability goals.
Key Challenges
Lack of Market Regulation and Transparency
One of the main challenges in Egypt’s used car market is the absence of strong regulatory oversight. Buyers often face risks such as inaccurate mileage reporting, hidden accident history, or manipulated documents. This lack of transparency undermines consumer trust and restricts growth. While digital platforms and CPO programs are addressing these issues, the market remains highly fragmented and informal. Establishing regulatory frameworks for vehicle inspections, standardized certification, and documentation could improve confidence and drive formalization of the sector, but until then, transparency challenges persist.
Currency Fluctuations and Import Dependence
Egypt’s used car market is heavily influenced by currency fluctuations and import dependency. The reliance on imported vehicles makes pricing vulnerable to exchange rate volatility, impacting affordability for buyers. Import restrictions and rising tariffs also add to supply constraints, limiting inventory and pushing prices upward. These factors create uncertainty for dealers and consumers, often slowing market momentum. Until local sourcing or assembly expands, currency instability and import dependence will remain structural challenges that restrict the long-term scalability of Egypt’s used car market.
Regional Analysis
Cairo Region
Cairo accounted for the largest share of the Egypt used car market in 2024, commanding nearly 38% of total revenue. The capital’s dense urban population, rising middle-class demand, and higher concentration of dealerships drive this dominance. Consumers in Cairo prefer sedans and compact vehicles for daily commuting, with strong growth also visible in mid-range SUVs. Online platforms and certified pre-owned programs are expanding rapidly in this region, supported by better digital access and financing availability. The city’s role as the automotive hub makes Cairo the most influential market, driving overall nationwide trends.
Alexandria Region
Alexandria held approximately 22% of the used car market share in 2024, making it the second-largest regional contributor. The port city benefits from strong trade activity and easier vehicle imports, ensuring steady supply. Demand is largely driven by hatchbacks, sedans, and budget-friendly models preferred by cost-conscious urban families. Increasing adoption of digital platforms and financing schemes has boosted transaction volumes. Alexandria’s proximity to trade routes and relatively stable purchasing power among residents continues to strengthen its role in shaping the supply-demand dynamics of Egypt’s used car sector.
Delta and Canal Cities
The Delta and Canal Cities region represented about 18% of the market share in 2024, fueled by growing urbanization and expanding commuter networks. Consumers in these areas show strong preference for economy cars and hatchbacks due to affordability and lower running costs. Rising demand for family vehicles, especially SUVs, has also been recorded. The expansion of online marketplaces and the availability of certified pre-owned programs are slowly enhancing transparency in transactions. This region is expected to witness sustained growth as infrastructure development and population density increase, supporting wider used car adoption.
Upper Egypt
Upper Egypt contributed close to 12% of the used car market share in 2024, reflecting rising adoption among rural and semi-urban households. Price sensitivity is the dominant factor here, with older models and budget-friendly vehicles leading demand. Limited access to financing and certified programs restricts the growth pace compared to urban regions. However, rising migration of used cars from Cairo and Alexandria into Upper Egypt has expanded availability. As infrastructure improves and awareness of online platforms spreads, this region presents a growing opportunity for budget-driven used car sales.
Suez and Red Sea Region
The Suez and Red Sea region captured nearly 10% of the used car market share in 2024. Its strategic importance as a trade hub supports strong import activity, making vehicles more accessible to buyers. Demand is led by SUVs and mid-range cars, catering to both residents and business needs in coastal areas. The presence of expatriates and tourism-related activities further boosts interest in reliable and well-maintained vehicles. Although smaller in size compared to Cairo or Alexandria, the region’s role as a logistics and trade gateway ensures steady demand for used vehicles.
Market Segmentations:
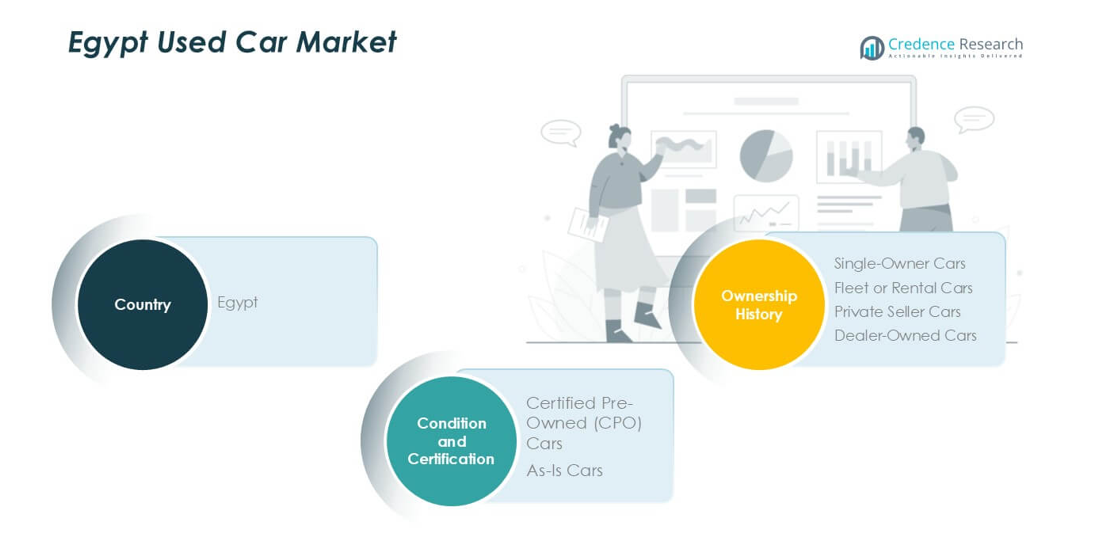
By Vehicle Types
- Sedans
- Hatchbacks
- SUVs (Sport Utility Vehicles)
- Coupes
- Pickup Trucks
- Vans and Minivans
- Luxury Cars
- Economy Cars
By Vehicle Age and Mileage
- Newer Models
- Older Models
By Price Range
- Budget-Friendly
- Mid-Range
- High-End and Luxury
By Fuel Type
- Gasoline
- Diesel
- Hybrid and Electric
By Transmission Type
- Automatic
- Manual
By Condition and Certification
- Certified Pre-Owned (CPO) Cars
- As-Is Cars
By Ownership History
- Single-Owner Cars
- Fleet or Rental Cars
- Private Seller Cars
- Dealer-Owned Cars
By Geography
- Cairo Region
- Alexandria Region
- Delta and Canal Cities
- Upper Egypt
- Suez and Red Sea Region
Competitive Landscape
The Egypt used car market is highly fragmented, with a mix of digital platforms, dealerships, and informal sellers shaping competition. Leading online platforms such as Carswitch, OLX Egypt, Bey2ollak, and Carmudi Egypt dominate by offering wide inventories, transparent pricing, and digital transaction tools. These platforms benefit from growing consumer trust in online channels, especially among younger buyers. Traditional players like Edfaraz Trading, Garagly, and Haraj Egypt maintain strong regional presence through offline networks and personalized services. Certified pre-owned (CPO) programs launched by global automakers are gaining traction, strengthening credibility and targeting higher-value customers. Price competitiveness, vehicle quality, financing options, and aftersales services are key differentiators in this market. The shift toward structured sales channels and digital adoption is intensifying competition, pushing both online platforms and dealerships to enhance offerings. As consumer demand for reliability, transparency, and affordability grows, companies that integrate technology with customer-focused services are best positioned to gain market share.
Key Player Analysis
Recent Developments
- In January 2025, CarTrade Tech reported its third consecutive quarterly profit, with a net profit of INR 45.33 crore in Q3FY25, demonstrating the viability of asset-light digital platform models in the used car market.
- In December 2024, The GST Council increased tax rates on used vehicle sales from 12% to 18% for registered dealers, creating potential cost pressures that may accelerate organized player consolidation.
- In December 2024, Cars24 announced INR 5 billion investment in technology infrastructure and plans to hire over 100 tech experts to develop real-time car valuation and maintenance tracking capabilities.
- In August 2024, MOTORS collaborated with Parkers, a U.K. platform for used car buyers, to expand the reach of its multisite advertising service. This collaboration aims to give dealers more visibility and offer consumers a broader selection of used cars on one of the U.K.'s most trusted automotive platforms.
- In October 2023, TrueCar, Inc. collaborated with Car and Driver to enhance the online car shopping experience for Car and Driver's 15 million users by integrating TrueCar's platform into their model review pages. This collaboration aims to provide a seamless process for consumers while expanding visibility for TrueCar dealers and utilizing Car and Driver's comprehensive automotive content and insights.
- In January 2023, CarMax Enterprise Services, LLC collaborated with UVeye Inc., an automatic vehicle inspection provider, to implement automated vehicle assessment technology, enhancing AI-driven condition reports for wholesale vehicle buyers at auctions. This collaboration aims to improve transparency and efficiency in the wholesale auction process by providing detailed imagery and automated inspections of vehicles
Report Coverage
The research report offers an in-depth analysis based on Vehicle Types, Vehicle Age, Price Range, Fuel Type and Mileage, Transmission Type, Condition and Certification, Ownership History and Geography. It details leading market players, providing an overview of their business, product offerings, investments, revenue streams, and key applications. Additionally, the report includes insights into the competitive environment, SWOT analysis, current market trends, as well as the primary drivers and constraints. Furthermore, it discusses various factors that have driven market expansion in recent years. The report also explores market dynamics, regulatory scenarios, and technological advancements that are shaping the industry. It assesses the impact of external factors and global economic changes on market growth. Lastly, it provides strategic recommendations for new entrants and established companies to navigate the complexities of the market.
Future Outlook
- The Egypt used car market will continue steady growth supported by rising affordability.
- Digital platforms will expand further, driving transparency and buyer confidence.
- Certified pre-owned programs will gain stronger acceptance among urban customers.
- SUVs and mid-range vehicles will see rising demand from families and professionals.
- Hybrid and electric used cars will gradually emerge as a niche growth area.
- Financing and leasing options will play a larger role in boosting accessibility.
- Competition between online platforms and offline dealers will intensify.
- Cairo will remain the dominant market, with Alexandria and Delta cities expanding steadily.
- Rural and semi-urban regions will adopt more budget-friendly and older models.
- Improved regulations and standardization will enhance trust and support long-term market stability.
Request a Free Sample
Fill in your details and we'll send you a free sample report.
- Sample data tables & charts
- Research methodology
Need a Custom Version of This Report?
Tailor the scope, geography, or segments to your exact requirements.
- Custom geography or segment scope
- Direct access to our analyst team
Frequently Asked Questions
What is the current size of the used car market in Egypt?
At what Compound Annual Growth Rate is the Egypt Used Car market projected to grow between 2025 and 2032?
Which Egypt Used Car market segment held the largest share in 2024?
What are the primary factors fueling the growth of the Egypt Used Car market?
Who are the major players in the Egyptian used car market?
Table of Content
Chapter 1. Report Introduction
- 1.1 Report Description & Purpose
- 1.1.1 Report Title & Market Definition
- 1.1.2 Unique Selling Propositions (USP) & Key Differentiators
- 1.1.3 Value Proposition for Stakeholders
- 1.2 Research Objectives
- 1.2.1 Market Sizing Objectives (Volume & Revenue) (Volume Where Applicable)
- 1.2.2 Segmentation Objectives
- 1.2.3 Competitive Intelligence Objectives
- 1.2.4 Forecast & Scenario Objectives
- 1.3 Report Scope
- 1.3.1 Egypt Used Car Scope – Segments & Subsegments Covered
- 1.3.2 Geographic Scope – Selected Country & Subnational Markets Covered
- 1.3.3 Historical Period, Base Year & Forecast Period (2024; forecast to 2032)
- 1.3.4 Inclusions & Exclusions
- 1.4 Industry Classification & Applicable Codes
- 1.5 Currency, Measurement Units & Valuation Basis
- 1.6 Target Stakeholders
- 1.7 Limitations & Assumptions
Chapter 2. Executive Summary
- 2.1 Egypt Used Car Snapshot
- 2.1.1 Market Size – Historical (2024) & Forecast (2024-2032) (2024: USD 6,429.64 million → 2032: USD 8,910.52 million)
- 2.1.2 Volume & Revenue – National Totals (Volume Where Applicable)
- 2.1.3 Key Market Highlights – Top Five Facts
- 2.2 Egypt Used Car Segmentation Snapshot
- 2.2.1 Market Split by Subnational Area – 2024 vs. 2032
- 2.3 Competitive Snapshot
- 2.3.1 Top 10 Players by Revenue Share – 2024
- 2.3.2 Top 10 Players by Volume Share – 2024 (Volume Where Applicable)
- 2.3.3 Recent Strategic Developments (18-Month Summary)
- 2.4 Key Investment Highlights & Strategic Conclusions
Chapter 3. Egypt Used Car Dynamics & Industry Analysis
- 3.1 Market Overview & Context
- 3.1.1 Egypt Used Car Position in the Broader Industry Value Chain
- 3.1.2 Demand Structure & Purchasing Dynamics
- 3.1.3 Market Maturity & Development Stage Across Domestic Markets
- 3.2 Egypt Used Car Drivers
- 3.3 Egypt Used Car Restraints & Challenges
- 3.4 Egypt Used Car Opportunities
- 3.5 Porter's Five Forces Analysis
- 3.5.1 Threat of New Entrants
- 3.5.2 Bargaining Power of Suppliers
- 3.5.3 Bargaining Power of Buyers
- 3.5.4 Threat of Substitutes
- 3.5.5 Competitive Rivalry – Intensity Assessment
- 3.6 Egypt Used Car Value Chain Analysis
- 3.6.1 Upstream – Key Inputs, Resources & Suppliers
- 3.6.1.1 Key Input/Resource 1
- 3.6.1.2 Key Input/Resource 2
- 3.6.1.3 Key Input/Resource 3
- 3.6.2 Midstream – Core Operations & Value Creation
- 3.6.2.1 Operating Model & Process Overview
- 3.6.2.2 Key Operating Locations & Capabilities by Company
- 3.6.3 Downstream – Market Channels & End Users
- 3.6.3.1 Direct Sales & Customer Engagement Channels
- 3.6.3.2 Indirect Sales, Intermediaries & Partner Channels
- 3.6.4 Value Chain Profitability Analysis
- 3.6.1 Upstream – Key Inputs, Resources & Suppliers
- 3.7 PESTEL Analysis
- 3.7.1 Political Factors
- 3.7.2 Economic Factors
- 3.7.3 Social Factors
- 3.7.4 Technological Factors
- 3.7.5 Environmental Factors
- 3.7.6 Legal Factors
- 3.8 Egypt Used Car Supply Chain Analysis
- 3.8.1 Critical Input & Resource Availability Risk Assessment
- 3.8.2 Supplier & Operational Concentration Risk (Geographic Exposure)
- 3.8.3 Supply & Service Disruption Impact Analysis
- 3.9 National & Subnational Regulatory Landscape
Note: The regulatory and policy landscape section covers regulations based on their applicability to the market, Egypt Used Car category, geography, and scope of the study. Only regulatory frameworks with a material impact on operations, compliance, trade, sustainability, or market access are analyzed in detail.
Chapter 4. Key Investment Pockets & Opportunity Analysis
- 4.1 Egypt Used Car Attractiveness Analysis
- 4.1.1 By Subnational Area – Investment Attractiveness Matrix (Market Size × CAGR)
- 4.2 Absolute Revenue Growth Opportunity
- 4.2.1 By Subnational Area – Absolute Revenue Growth Through 2032
- 4.3 Incremental Demand Opportunity
- 4.3.1 By Subnational Area – Incremental Demand Through 2032
- 4.3.2 Segment – Incremental Demand
- 4.4 Emerging Submarket Opportunity Deep Dive (Subject to Applicability)
- 4.5 Priority Domestic Market Opportunity Scorecards
- 4.5.1 Priority Domestic Market 1
- 4.5.2 Priority Domestic Market 2
- 4.5.3 Priority Domestic Market 3
- 4.5.4 Priority Domestic Market 4
Note: Domestic market scorecards cover relevant states, provinces, territories, cities, or economic zones within the selected country. Numbered entries are populated with market names suited to the national administrative structure and research scope. Geographic share tables use one consistent, nonoverlapping set of areas.
Chapter 5. Egypt Used Car Cross-Border Trade & Market Access Analysis
- 5.1 National Trade & International Partner Overview
- 5.1.1 Export Value by Destination Country (2024)
- 5.1.2 Export Volume by Destination Country (2024) (Where Applicable)
- 5.1.3 Import Value by Source Country (2024)
- 5.1.4 Import Volume by Source Country (2024) (Where Applicable)
- 5.1.5 National & Partner-Country Trade Balances (2024)
- 5.2 Export Analysis – Segment
- 5.2.1 Category 1 (Applicable Classification Code)
- 5.2.2 Category 2 (Applicable Classification Code)
- 5.2.3 Category 3 (Applicable Classification Code)
- 5.2.4 Category 4 (Applicable Classification Code)
- 5.2.5 Category 5 (Applicable Classification Code)
- 5.3 Import Analysis – Segment
- 5.3.1 Category 1 (Applicable Classification Code)
- 5.3.2 Category 2 (Applicable Classification Code)
- 5.3.3 Category 3 (Applicable Classification Code)
- 5.3.4 Category 4 (Applicable Classification Code)
- 5.3.5 Category 5 (Applicable Classification Code)
- 5.4 Cross-Border Pricing & Transaction Benchmarks
- 5.4.1 Export Pricing – Segment & Destination Country
- 5.4.2 Import Pricing – Segment & Source Country
- 5.4.3 Price Trends (2024)
- 5.5 Key Cross-Border Trade & Delivery Routes
- 5.5.1 Cross-Border Trade/Delivery Route 1
- 5.5.2 Cross-Border Trade/Delivery Route 2
- 5.5.3 Cross-Border Trade/Delivery Route 3
- 5.5.4 Cross-Border Trade/Delivery Route 4
- 5.5.5 Cross-Border Trade/Delivery Route 5
- 5.6 Trade Policy & Market Access Impact Assessment
- 5.6.1 Tariff & Non-Tariff Barriers
- 5.6.2 National Participation in Regional Trade & Economic Frameworks
- 5.6.3 Bilateral & Multilateral Trade Agreements
- 5.6.4 Cross-Border Operating, Licensing & Localization Requirements
Note: This chapter covers international trade relevant to Egypt Used Car in the selected country. Exports are analyzed by destination and imports by source. Domestic interregional flows are excluded from international trade totals. Goods, services, and digital offerings use applicable classifications; volume and route analyses apply only where meaningful.
Chapter 6. Competitive Landscape & Company Benchmarking
- 6.1 Egypt Used Car Concentration & Structure
- 6.1.1 Herfindahl-Hirschman Index (HHI) – the historical period vs. 2024
- 6.1.2 Leading, Mid-Sized & Emerging Player Structure
- 6.1.3 Multinational, National & Local Player Dynamics
- 6.2 Egypt Used Car Share Analysis – 2024
- 6.2.1 National Revenue Share by Company
- 6.2.2 National Volume Share by Company (Volume Where Applicable)
- 6.2.3 Company Revenue Share by Subnational Area
- 6.2.4 Market Share Evolution (the historical period vs. 2024)
- 6.2.5 Company Market Share by Key Segment
- 6.2.6 Company Market Share by Customer Group
- 6.3 Operating Scale, Capacity & Infrastructure Analysis
- 6.3.1 National Operating Scale & Supply Capacity
- 6.3.2 Resource Utilization & Operating Efficiency
- 6.3.3 Output, Service Delivery & Activity Metrics
- 6.3.4 Operating Footprint & Infrastructure Map
- 6.3.5 Planned Operational & Capacity Expansion
- 6.4 Egypt Used Car Competitive Benchmarking Matrix
- 6.4.1 Revenue, Growth, Profitability & Operating Metric Comparison
- 6.4.2 Channel Revenue Mix
- 6.4.3 Revenue Exposure Across Domestic Markets
- 6.4.4 R&D Intensity
- 6.4.5 Sustainability Maturity
- 6.5 Strategic Developments in Egypt Used Car (Last 24 Months)
- 6.5.1 Mergers, Acquisitions & Divestments
- 6.5.2 New Products, Services & Solutions in Egypt Used Car
- 6.5.3 Operational & Infrastructure Expansions
- 6.5.4 Strategic Alliances, Joint Ventures & Partnerships
- 6.5.5 Distribution Expansion & Market Entry
- 6.5.6 Sustainability & ESG Initiatives
- 6.6 Competitive Strategy Mapping
- 6.6.1 Leader, Challenger, Follower & Niche Classification
- 6.6.2 Pricing Strategy Comparison
- 6.6.3 Channel Strategy Matrix
Note: Strategic developments are included based on their materiality and the availability of reliable information.
Chapter 7. Egypt Used Car – By Sales & Delivery Channel
- 7.1 Segment Overview
- 7.1.1 Volume & Revenue Split by Channel (2024 & 2032) (Volume Where Applicable)
- 7.1.2 Channel Mix Evolution (2024-2032)
Chapter 8. Subnational Market Analysis – Country Overview
- 8.1 Domestic Geographic Market Overview
- 8.1.1 Subnational Volume Share (Where Applicable)
- 8.1.2 Subnational Revenue Share
- 8.1.3 Market Volume by Subnational Area (Where Applicable)
- 8.1.4 Market Revenue by Subnational Area
- 8.1.5 Subnational Forecasts Through 2032
- 8.2 Cross-Area Segment Analysis Within the Country
- 8.2.1 By Sales & Delivery Channel
- 8.2.2 By Competitive Positioning & Price Tier
Chapter 9. Egypt Used Car – Priority Domestic Market 1
Chapter 10. Egypt Used Car – Priority Domestic Market 2
Chapter 11. Egypt Used Car – Priority Domestic Market 3
Chapter 12. Egypt Used Car – Priority Domestic Market 4
Chapter 13. Egypt Used Car Company Profiles
- 13.1 [Company 01]
- 13.1.1 Company Overview
- 13.1.2 Key Management Personnel
- 13.1.3 Products & Services Portfolio
- 13.1.4 Financial Performance
- 13.1.5 Domestic Market Focus & Local Operating Presence
- 13.1.6 Recent Developments & Strategic Initiatives
Note: The company profile list is preliminary and may change based on research findings, market developments, data availability, and client requirements.
Chapter 14. Appendices
- Appendix A – List of Abbreviations & Acronyms
- Appendix B – Industry Classification Code Reference – Full Series
- Appendix C – Supply, Output & Operating Capacity Data Tables
- Appendix D – End-Use & Demand Base Tables
- Appendix E – Demand, Adoption & Usage Assumptions
- Appendix F – Pricing & Revenue Metric Reference Tables
- Appendix G – Company Operations & Infrastructure Database
- Appendix H – Cross-Border Trade & Activity Data Tables (Where Applicable)
- Appendix I – Regulatory Summary Tables
- Appendix J – Primary Research Participant List (Anonymized)
- Appendix K – Primary Research Questionnaire Framework
- Appendix L – Data Sources & Bibliography
- Appendix M – Market Size Divergence & Source Comparison
Chapter 15. Research Methodology
- 15.1 Research Framework & Philosophy
- 15.2 Secondary Research – Sources, Hierarchy & Data Extraction
- 15.3 Data Modeling – National Market Sizing & Subnational Allocation
- 15.4 Primary Research – Stakeholder Framework, LOI & Sample Sizes
- 15.5 Forecast Methodology – Regression, Scenario & Sensitivity Analysis
- 15.6 Quality Control – Four-Layer Validation Framework
- 15.7 Limitations & Standard Assumptions
- 15.8 Disclaimer
