Market Overview
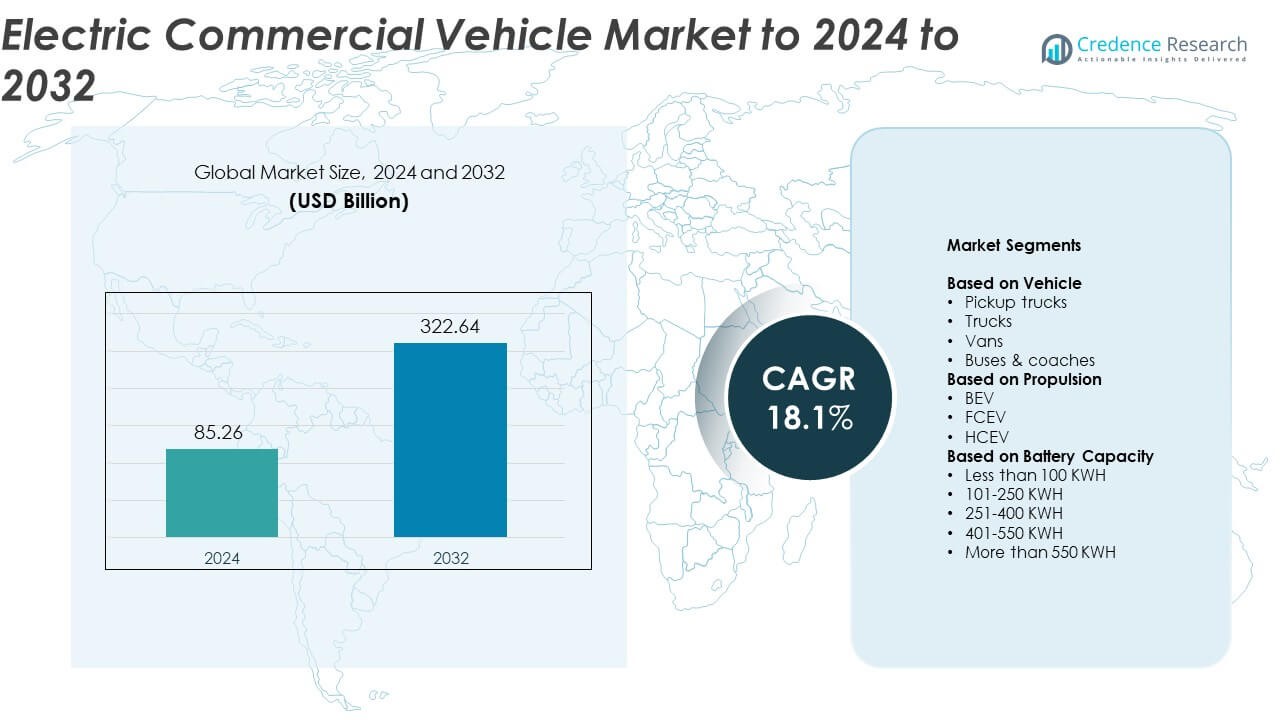
Electric Commercial Vehicle Market size was valued USD 85.26 Billion in 2024 and is anticipated to reach USD 322.64 Billion by 2032, at a CAGR of 18.1% during the forecast period.
| REPORT ATTRIBUTE |
DETAILS |
| Historical Period |
2020-2023 |
| Base Year |
2024 |
| Forecast Period |
2025-2032 |
| Electric Commercial Vehicle Market Size 2024 |
USD 85.26 Billion |
| Electric Commercial Vehicle Market , CAGR |
18.1% |
| Electric Commercial Vehicle Market Size 2032 |
USD 322.64 Billion |
Tesla, AB Volvo, BYD, Ford Motor, Mercedes-Benz, Scania, Tata Motors, Rivian, Paccar, and Yutong are the leading players in the electric commercial vehicle market, collectively driving technological advancement and global adoption. These companies focus on developing energy-efficient drivetrains, modular vehicle platforms, and digital fleet management solutions. Their strong R&D investment supports expanding vehicle range and performance. Asia-Pacific leads the global market with a 31% share in 2024, driven by large-scale fleet electrification and robust manufacturing capacity. North America follows with 34% share, supported by government incentives and growing logistics electrification, while Europe holds 29% due to stringent emission regulations.
Access crucial information at unmatched prices!
Request your sample report today & start making informed decisions powered by Credence Research Inc.!
Download Sample
Market Insights
- The electric commercial vehicle market was valued at USD 85.26 billion in 2024 and is projected to reach USD 322.64 billion by 2032, registering a CAGR of 18.1%.
- Rising government incentives, emission reduction targets, and fleet electrification are key factors boosting market growth across logistics, construction, and public transport.
- Growing demand for battery electric vehicles, improved battery density, and expansion of charging networks are driving major technological trends.
- The market remains competitive with strong participation from global and regional manufacturers focusing on cost efficiency, range improvement, and advanced connectivity.
- North America holds 34% share, followed by Asia-Pacific at 31% and Europe at 29%, while the trucks segment dominates with about 43% share due to rising logistics electrification.
Market Segmentation Analysis:
By Vehicle
Trucks dominate the electric commercial vehicle market with about 43% share in 2024. Their leadership comes from high adoption in logistics and freight transport as companies target zero-emission fleets. Rising government incentives for fleet electrification and expansion of charging networks accelerate growth. Pickup trucks and vans are gaining steady demand from last-mile delivery and small business operations. The increasing availability of long-range models supports broader deployment across regional transport networks.
- For instance, Schneider National logged 6,000,000 zero-emission miles with Freightliner eCascadia trucks.
By Propulsion
Battery Electric Vehicles (BEVs) hold the largest share of nearly 79% in 2024. Their dominance is driven by advancements in battery efficiency, lower maintenance costs, and strong policy support. Fleet operators favor BEVs for urban operations where charging infrastructure is concentrated. Fuel Cell Electric Vehicles (FCEVs) and Hybrid Commercial Electric Vehicles (HCEVs) are emerging in long-haul and high-load applications. The push for decarbonized logistics and urban emission-free zones continues to strengthen BEV adoption worldwide.
- For instance, Daimler Truck sold 4,035 battery-electric trucks and buses in 2024.
By Battery Capacity
The 101–250 kWh segment leads the market with around 38% share in 2024. This capacity range suits medium-duty trucks, vans, and buses that require balanced range and weight efficiency. Manufacturers are optimizing battery packs to enhance charging speed and durability. Larger capacities above 400 kWh are gaining traction for long-distance freight and intercity transport. Technological progress in energy density and fast-charging systems continues to improve operational flexibility and reduce downtime for fleet operators.
Key Growth Drivers
Rising Government Incentives and Emission Regulations
Governments worldwide are enforcing strict emission norms and offering subsidies to encourage electric commercial vehicle adoption. Incentive programs, tax credits, and purchase rebates are reducing ownership costs for fleets. Countries in Europe, North America, and Asia-Pacific are investing heavily in EV infrastructure to meet carbon neutrality targets. These supportive measures accelerate the shift from diesel to electric fleets, improving fleet efficiency and sustainability while boosting demand across logistics, construction, and public transport sectors.
- For instance, Volvo Trucks registered 1,970 heavy electric trucks in Europe in 2024 under tighter CO₂ rules.
Advancements in Battery Technology
Continuous improvements in battery chemistry and energy density are enhancing the range and performance of electric commercial vehicles. Falling battery costs make EVs more affordable for fleet operators, improving total cost of ownership. Enhanced fast-charging capabilities and extended battery lifespans enable longer duty cycles for trucks and buses. The development of solid-state and lithium-iron-phosphate (LFP) batteries further supports safety, efficiency, and energy sustainability in heavy-duty applications, accelerating overall market penetration.
- For instance, Freightliner eCascadia lists 438 kWh usable capacity and ~90-minute 80% fast-charge.
Fleet Electrification by Logistics and E-commerce Companies
The rapid growth of e-commerce and logistics operations is driving high demand for electric delivery fleets. Companies are adopting EVs to reduce fuel expenses and align with corporate sustainability goals. Expanding urban delivery zones and low-emission regulations favor electric vans and light trucks. Fleet operators benefit from improved operational efficiency and predictive maintenance enabled by connected EV systems. This strategic electrification trend strengthens adoption among major logistics and last-mile delivery providers.
Key Trends & Opportunities
Expansion of Charging Infrastructure Networks
The development of high-speed charging networks is creating new opportunities for market expansion. Public and private partnerships are focusing on highway fast chargers and depot-based charging systems. Smart grid integration and renewable-powered stations improve charging convenience for fleet operators. The rise of wireless and ultra-fast charging solutions further enhances vehicle uptime. The growth of infrastructure coverage across cities and logistics hubs remains a crucial enabler for widespread EV adoption.
- For instance, Milence targets 1,700 public heavy-truck charging points across Europe by 2027.
Integration of Telematics and Digital Fleet Management
Electric commercial vehicles are increasingly integrated with telematics, IoT, and AI-driven fleet management tools. These technologies enable real-time monitoring, route optimization, and energy usage tracking. Fleet operators can improve asset utilization and reduce downtime through predictive maintenance. The integration of software analytics supports energy efficiency, battery health management, and overall fleet productivity. Growing adoption of connected vehicle technologies is transforming fleet operations and creating a competitive advantage for early adopters.
- For instance, Samsara processed approximately 14 trillion data points annually across its cloud platform during its reporting period covering fiscal year 2025.
Key Challenges
High Initial Vehicle and Infrastructure Costs
Despite declining battery prices, the upfront cost of electric commercial vehicles remains higher than conventional models. Fleet operators face significant investment needs for charging infrastructure, especially for long-haul operations. Limited access to affordable financing options also slows adoption among small and medium businesses. Manufacturers continue to work on reducing costs through economies of scale and modular battery designs. The transition requires strong policy and financial support to remain economically viable.
Limited Range and Charging Availability for Heavy-Duty Operations
Range anxiety continues to challenge long-distance and heavy-duty vehicle operations. Charging infrastructure coverage across remote and highway routes remains uneven, leading to operational constraints. Prolonged charging times limit vehicle availability during high-demand periods. Advances in ultra-fast charging and higher-capacity batteries are addressing these concerns, but adoption remains slow in developing markets. Expanding charging accessibility and standardization is vital to ensure reliability and scalability for heavy commercial fleets.
Regional Analysis
North America
North America accounts for about 34% share of the electric commercial vehicle market in 2024. Growth is supported by strong policy incentives, expanding charging infrastructure, and fleet electrification by logistics and delivery companies. The United States leads adoption due to active investments from major OEMs and fleet operators. Canada’s focus on carbon reduction and zero-emission transportation also drives demand for electric buses and trucks. Government funding programs and private-sector partnerships continue to enhance market growth across regional and intercity transport segments.
Europe
Europe holds around 29% share of the electric commercial vehicle market in 2024. Stringent emission regulations, urban low-emission zones, and strong government support accelerate adoption across fleets. Countries such as Germany, France, and the United Kingdom lead demand for electric trucks and buses. Public transport electrification and expansion of fast-charging corridors enhance operational flexibility. Increasing collaboration between automotive manufacturers and energy providers is improving infrastructure development, ensuring a robust shift toward zero-emission mobility across commercial transportation networks.
Asia-Pacific
Asia-Pacific dominates the global market with about 31% share in 2024. China remains the largest contributor due to strong government policies, large-scale manufacturing, and rapid fleet electrification. Japan, India, and South Korea are expanding electric bus and van fleets to reduce urban pollution. Significant investment in local battery production and charging infrastructure supports large-scale adoption. The rise of domestic EV makers and partnerships with global players continue to boost regional competitiveness and long-term growth momentum.
Latin America
Latin America represents roughly 4% share of the electric commercial vehicle market in 2024. Adoption is growing steadily as countries such as Brazil, Chile, and Mexico invest in clean public transport and sustainable freight systems. Regional governments are implementing tax incentives and pilot programs for electric buses and delivery fleets. Infrastructure development and cost barriers still limit mass deployment. However, partnerships with global EV manufacturers and renewable energy integration are gradually improving accessibility and accelerating adoption across key cities.
Middle East & Africa
The Middle East & Africa region accounts for nearly 2% share in 2024. Growth is emerging as governments promote diversification from oil dependency and invest in smart mobility. The United Arab Emirates and Saudi Arabia are leading with electric bus projects and urban fleet trials. Africa’s adoption remains in early stages due to infrastructure constraints and affordability challenges. Increasing renewable energy capacity and electric mobility initiatives are expected to support gradual expansion in the coming years.
Market Segmentations:
By Vehicle
- Pickup trucks
- Trucks
- Vans
- Buses & coaches
By Propulsion
By Battery Capacity
- Less than 100 KWH
- 101-250 KWH
- 251-400 KWH
- 401-550 KWH
- More than 550 KWH
By Geography
- North America
- Europe
- Germany
- France
- U.K.
- Italy
- Spain
- Rest of Europe
- Asia Pacific
- China
- Japan
- India
- South Korea
- South-east Asia
- Rest of Asia Pacific
- Latin America
- Brazil
- Argentina
- Rest of Latin America
- Middle East & Africa
- GCC Countries
- South Africa
- Rest of the Middle East and Africa
Competitive Landscape
Tesla, AB Volvo, BYD, Ford Motor, Mercedes-Benz, Scania, Tata Motors, Rivian, Paccar, and Yutong are among the major participants shaping the electric commercial vehicle market. The competitive landscape is defined by continuous innovation in battery technology, advanced powertrains, and intelligent fleet management systems. Leading manufacturers are expanding their product portfolios across light, medium, and heavy-duty categories to meet evolving logistics and public transport demands. Strategic collaborations with charging infrastructure providers and component suppliers enhance operational efficiency and regional accessibility. Companies are increasingly focusing on sustainability targets, digital connectivity, and modular vehicle architectures to strengthen market presence. Intense competition drives rapid product launches, with growing emphasis on extended range, low maintenance, and total cost optimization for fleet operators worldwide.
Shape Your Report to Specific Countries or Regions & Enjoy 30% Off!
Key Player Analysis
Recent Developments
- In 2025, Volvo Trucks unveiled its new battery electric long-haul truck, the Volvo FH Aero Electric, with a range of up to 600 km.
- In 2025, Ford continues to expand its EV lineup including the Mustang Mach-E, F-150 Lightning, Explorer EV, and E-Transit commercial van, planning enhancements in range, charging, and features.
- In 2024, BYD unveiled the E-VALI, a pure-electric light commercial vehicle (LCV) for the European market, and the EYT 2.0, a pure-electric yard tractor, at the IAA Transportation event.
Report Coverage
The research report offers an in-depth analysis based on Vehicle, Propulsion, Battery Capacity and Geography. It details leading market players, providing an overview of their business, product offerings, investments, revenue streams, and key applications. Additionally, the report includes insights into the competitive environment, SWOT analysis, current market trends, as well as the primary drivers and constraints. Furthermore, it discusses various factors that have driven market expansion in recent years. The report also explores market dynamics, regulatory scenarios, and technological advancements that are shaping the industry. It assesses the impact of external factors and global economic changes on market growth. Lastly, it provides strategic recommendations for new entrants and established companies to navigate the complexities of the market.
Future Outlook
- The market will experience strong growth driven by rapid fleet electrification and logistics modernization.
- Advancements in battery chemistry will enhance vehicle range, safety, and charging efficiency.
- Governments will expand subsidy programs and carbon reduction policies to accelerate adoption.
- Urban low-emission zones will encourage greater use of electric vans and buses.
- Expansion of high-speed charging networks will support long-haul electric truck operations.
- Integration of AI and telematics will optimize fleet performance and energy use.
- Partnerships between OEMs and energy firms will drive infrastructure and innovation investments.
- The falling total cost of ownership will make electric vehicles more attractive to small fleets.
- Regional manufacturing expansion will reduce dependency on imported components and batteries.
- Sustainability goals and green logistics initiatives will keep electric commercial vehicles a key focus for global transport transformation.


