| REPORT ATTRIBUTE |
DETAILS |
| Historical Period |
2020-2023 |
| Base Year |
2024 |
| Forecast Period |
2025-2032 |
| Enterprise Governance, Risk and Compliance (EGRC) Market Size 2023 |
USD 63,230.46 Million |
| Enterprise Governance, Risk and Compliance (EGRC) Market, CAGR |
12.91% |
| Enterprise Governance, Risk and Compliance (EGRC) Market Size 2032 |
USD 1,66,030.68 Million |
Market Overview:
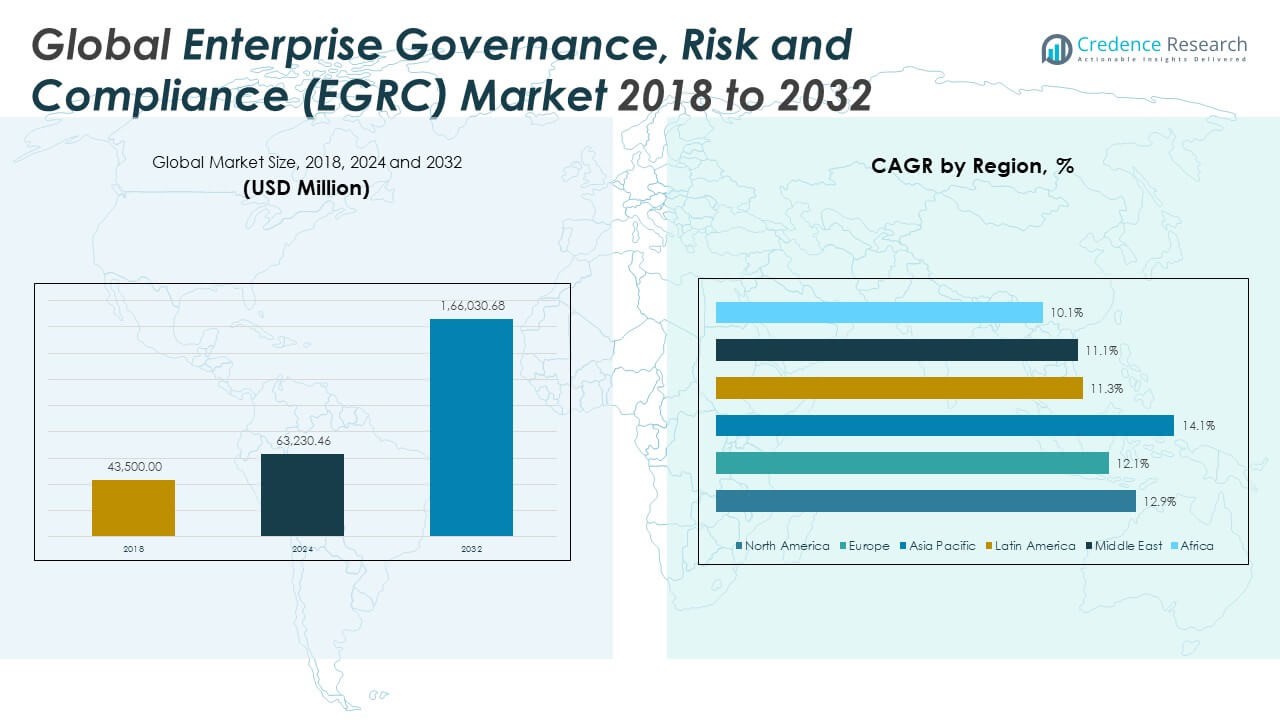
The Global Enterprise Governance, Risk and Compliance (EGRC) Market size was valued at USD 43,500.00 million in 2018 to USD 63,230.46 million in 2024 and is anticipated to reach USD 1,66,030.68 million by 2032, at a CAGR of 12.91% during the forecast period.
One of the primary drivers propelling the EGRC market is the rising complexity of regulatory environments globally. Organizations must navigate an expanding landscape of compliance requirements such as GDPR in Europe, SOX in the United States, and data protection laws in Asia-Pacific and Latin America. To manage these effectively, companies are investing in unified platforms that automate risk assessments, compliance tracking, and policy enforcement. The increasing frequency and sophistication of cyberattacks are also pushing businesses to adopt EGRC systems that integrate real-time monitoring, vulnerability assessments, and incident response strategies. Additionally, the shift toward digital transformation, fueled by the adoption of cloud technologies, AI, and machine learning, is driving the development of next-generation EGRC tools that offer predictive analytics and dynamic risk modeling. These technological enhancements enable organizations to move from reactive to proactive risk management approaches, improving decision-making and business continuity.
Regionally, North America holds the largest share of the global EGRC market, driven by stringent regulatory compliance requirements and early adoption of advanced technologies. The presence of major players and a mature risk management culture further supports market expansion in this region. Europe follows closely, with growing emphasis on data protection and risk transparency, especially under the influence of GDPR and upcoming frameworks like DORA (Digital Operational Resilience Act). The Asia-Pacific region is expected to register the fastest growth rate during the forecast period due to rising digital adoption, increasing cybersecurity concerns, and evolving regulatory landscapes in emerging economies such as China, India, and Southeast Asia. Countries in Latin America and the Middle East & Africa are also showing increasing adoption of EGRC solutions, although growth in these regions is relatively slower due to limited technological infrastructure and varying regulatory maturity. Overall, the global EGRC market is poised for sustained growth, driven by regulatory pressure, risk complexity, and the strategic need for enterprise-wide compliance management.
Access crucial information at unmatched prices!
Request your sample report today & start making informed decisions powered by Credence Research Inc.!
Download Sample
Market Insights:
- The Global Enterprise Governance, Risk and Compliance (EGRC) Market was valued at USD 43,500.00 million in 2018, reached USD 63,230.46 million in 2024, and is expected to reach USD 166,030.68 million by 2032, growing at a CAGR of 12.91%.
- Rising regulatory complexities such as GDPR, SOX, and regional data protection laws are compelling organizations to invest in unified EGRC platforms to ensure compliance and risk alignment.
- The growing threat landscape, including ransomware and data breaches, is driving enterprises to adopt EGRC systems with embedded security features and real-time monitoring capabilities.
- Business expansion across global markets is increasing operational complexity, prompting demand for centralized governance and risk transparency across diverse business functions.
- Automation of compliance processes and audit trails is enabling organizations to improve efficiency, control costs, and support faster, informed decision-making at leadership levels.
- The EGRC market faces adoption barriers due to integration complexity, high implementation costs, and lack of standardization, particularly for SMEs with legacy IT infrastructure.
- North America leads the market due to early technology adoption and strict regulatory mandates, while Asia-Pacific is experiencing the fastest growth due to rapid digitalization and evolving compliance environments.
Market Drivers:
Heightened Regulatory Pressure Prompting EGRC Adoption Across Industries:
Government bodies across the globe are imposing stringent regulatory requirements on industries including banking, healthcare, telecommunications, and manufacturing. The Global Enterprise Governance, Risk and Compliance (EGRC) Market benefits significantly from these mandates, as enterprises require structured systems to meet compliance obligations. It enables organizations to manage cross-border regulations, streamline audit trails, and ensure operational consistency. Growing global concern over data privacy, financial fraud, and unethical practices is reinforcing the demand for advanced compliance management frameworks. Organizations need to demonstrate accountability in their governance structures, driving investments in EGRC platforms. Regulatory alignment has become a strategic priority across enterprise boards and leadership teams.
- For instance, IBM OpenPages with Watson provides automated regulatory mapping and compliance management across over 720 global regulations, with configurable controls covering 35+ languages. In 2023, OpenPages processed more than 60 million compliance test records for its enterprise clients, automating 80% of their routine audit trail documentation.
Increased Complexity of Business Operations Demanding Risk Transparency:
Enterprises are expanding their operations across diverse geographies, supply chains, and digital ecosystems. This growth creates operational complexity and increases exposure to internal and external risks. The Global Enterprise Governance, Risk and Compliance (EGRC) Market addresses this challenge by offering risk identification, tracking, and mitigation tools across functional departments. It provides comprehensive visibility into operational, financial, legal, and reputational risks. Businesses can adopt a unified risk management approach to improve response time and reduce the impact of disruptions. The complexity of modern business processes necessitates a centralized governance structure, driving demand for scalable EGRC solutions.
- For instance, MetricStream’s GRC Cloud Platform is trusted by 15 of the top 20 global banks—each managing over 100,000 risk assessments per year on the platform—with real-time dashboards that aggregate risk exposure data across 90 countries and 40+ regulatory frameworks.
Rising Cybersecurity Threat Landscape Supporting EGRC Integration:
Cyberattacks, data breaches, ransomware, and phishing campaigns are now considered board-level concerns for global organizations. The Global Enterprise Governance, Risk and Compliance (EGRC) Market plays a key role in integrating cybersecurity protocols with governance structures. It allows enterprises to track cybersecurity metrics, enforce internal security controls, and respond to incidents with agility. Increasing digitization and cloud migration have elevated the risk of data exposure, prompting enterprises to adopt EGRC platforms with embedded security compliance tools. These systems support regulatory standards such as ISO 27001, NIST, and PCI DSS. Companies use EGRC tools to identify vulnerabilities and enforce continuous monitoring.
Strategic Shift Toward Operational Efficiency and Cost Control:
Organizations are under pressure to improve productivity while reducing overhead costs. The Global Enterprise Governance, Risk and Compliance (EGRC) Market supports this goal by automating compliance workflows, reducing manual errors, and eliminating redundant controls. It enables better resource allocation, faster decision-making, and improved regulatory response time. EGRC tools provide centralized dashboards and customizable reporting features that streamline communication among stakeholders. Enterprises that integrate EGRC into their business processes gain a competitive advantage through operational consistency and risk-informed strategies. The growing preference for automation and efficiency drives long-term demand for EGRC platforms.
Market Trends:
Growing Integration of EGRC Platforms with Environmental, Social, and Governance (ESG) Reporting:
Enterprises are increasingly aligning their governance and risk frameworks with ESG mandates to meet stakeholder expectations and regulatory scrutiny. The Global Enterprise Governance, Risk and Compliance (EGRC) Market is evolving to incorporate ESG-focused modules that track emissions, labor standards, and ethical sourcing. It enables companies to unify financial and non-financial disclosures through a centralized platform. Stakeholders, investors, and regulators are demanding more transparent reporting on sustainability and corporate social responsibility. EGRC vendors are integrating automated ESG scoring, audit trails, and disclosure templates to support accurate and compliant reporting. This trend enhances brand reputation while fulfilling global reporting frameworks such as SASB and TCFD.
- For instance, SAP’s Sustainability Control Tower, as of its 2024 update, enables enterprises to report on more than 50 ESG KPIs with automated real-time data feeds; over 7,000 organizations use SAP sustainability solutions to align disclosures with 70+ global ESG reporting standards, including SASB, GRI, and TCFD .
Proliferation of Low-Code and No-Code Configurable EGRC Platforms:
Vendors are redesigning EGRC software with low-code and no-code capabilities to enable faster deployment and greater customization. The Global Enterprise Governance, Risk and Compliance (EGRC) Market benefits from tools that empower business users to build workflows, set controls, and manage dashboards without technical expertise. It enhances agility in responding to dynamic risk and compliance requirements. Enterprises can scale platforms across departments without prolonged development cycles. Low-code tools reduce dependency on IT teams and minimize the cost of ongoing updates. Organizations are seeking platforms that offer both technical robustness and user-friendly customization features.
- For instance, ServiceNow’s Governance, Risk, and Compliance module enabled organizations to deploy over 6,000 unique compliance workflows using its App Engine Studio in 2023, with deployment times on average 65% faster compared to traditional development cycles.
Emphasis on Real-Time Decision Support through Embedded Analytics:
EGRC solutions are increasingly adopting embedded analytics and AI-driven insights to support proactive decision-making. The Global Enterprise Governance, Risk and Compliance (EGRC) Market reflects growing demand for tools that visualize risk heat maps, predict compliance breaches, and recommend mitigation strategies. It enables managers to assess organizational risk posture in real-time using automated alerts and dynamic dashboards. Predictive models offer early warning signals that improve response time. These capabilities foster a shift from reactive compliance management to strategic foresight. The inclusion of advanced analytics enhances both compliance accuracy and executive confidence.
Adoption of Mobile-First EGRC Tools for On-the-Go Risk Monitoring:
Workforce mobility is driving the development of mobile-first EGRC applications that offer compliance monitoring on smartphones and tablets. The Global Enterprise Governance, Risk and Compliance (EGRC) Market is responding with platforms that enable remote audits, policy approvals, and incident reporting. It helps organizations maintain business continuity and compliance posture outside traditional office environments. Mobile EGRC apps support push notifications, camera integration, and voice-enabled task assignments. This mobility enhances responsiveness and supports hybrid work environments. It reinforces the decentralization of compliance functions while ensuring governance integrity.
Market Challenges Analysis:
Integration Complexity and High Implementation Costs Limit Market Penetration:
One of the major challenges in the Global Enterprise Governance, Risk and Compliance (EGRC) Market is the complexity of integrating EGRC platforms with existing enterprise systems. Many organizations operate with siloed infrastructures and legacy applications, making it difficult to deploy centralized EGRC solutions without disrupting ongoing operations. The process of aligning disparate IT systems, data sources, and compliance workflows often demands significant time, financial investment, and internal change management. Small and mid-sized enterprises frequently lack the resources to implement and maintain comprehensive EGRC systems, deterring adoption across broader segments. The lack of standardized frameworks also complicates integration efforts, forcing vendors to provide customized solutions for each industry or region. These technical and financial barriers slow down implementation and reduce the scalability of EGRC tools across diverse operational environments.
Data Privacy Concerns and Regulatory Fragmentation Hinder Global Expansion:
Data privacy regulations and regional compliance discrepancies present another challenge for the Global Enterprise Governance, Risk and Compliance (EGRC) Market. Organizations operating across multiple jurisdictions must address differing legal standards, which increases operational complexity and compliance costs. It is difficult to design a unified EGRC system that effectively responds to evolving privacy laws such as GDPR, CCPA, and region-specific mandates in Asia and the Middle East. Inconsistent regulatory interpretations further increase the risk of non-compliance, especially for multinational corporations. Data localization laws in several countries restrict the free flow of information, which undermines the centralized data management approach typical of EGRC platforms. These legal and jurisdictional limitations reduce the operational efficiency of global deployments and force companies to implement region-specific solutions, which fragment governance and increase administrative overhead.
Market Opportunities:
Rising Demand from Small and Mid-Sized Enterprises Expands Market Reach:
The growing adoption of cloud-based and modular EGRC solutions creates significant opportunities for market expansion among small and mid-sized enterprises (SMEs). These businesses are increasingly seeking cost-effective tools to manage compliance obligations and mitigate operational risks without building complex internal systems. Vendors that offer scalable, subscription-based models can reach a broader customer base and tap into underserved markets. The Global Enterprise Governance, Risk and Compliance (EGRC) Market can benefit from this trend by developing user-friendly platforms tailored for limited IT resources. It enables SMEs to streamline audits, policy enforcement, and risk assessments through simplified interfaces and preconfigured workflows. This shift toward accessible EGRC tools helps bridge the digital governance gap in emerging markets.
AI-Powered Analytics and Real-Time Risk Insights Drive Innovation:
Advancements in artificial intelligence and machine learning present new growth opportunities for the EGRC sector. AI-powered platforms can provide real-time monitoring, predictive risk scoring, and automated policy updates that improve enterprise-wide decision-making. It allows organizations to transition from manual, reactive compliance management to data-driven, proactive governance. Vendors that embed advanced analytics into EGRC platforms can differentiate their offerings and support faster incident detection and resolution. This innovation aligns with increasing enterprise demand for real-time transparency across complex regulatory environments. The integration of intelligent tools will reshape how organizations manage governance, risk, and compliance at scale.
Market Segmentation Analysis:
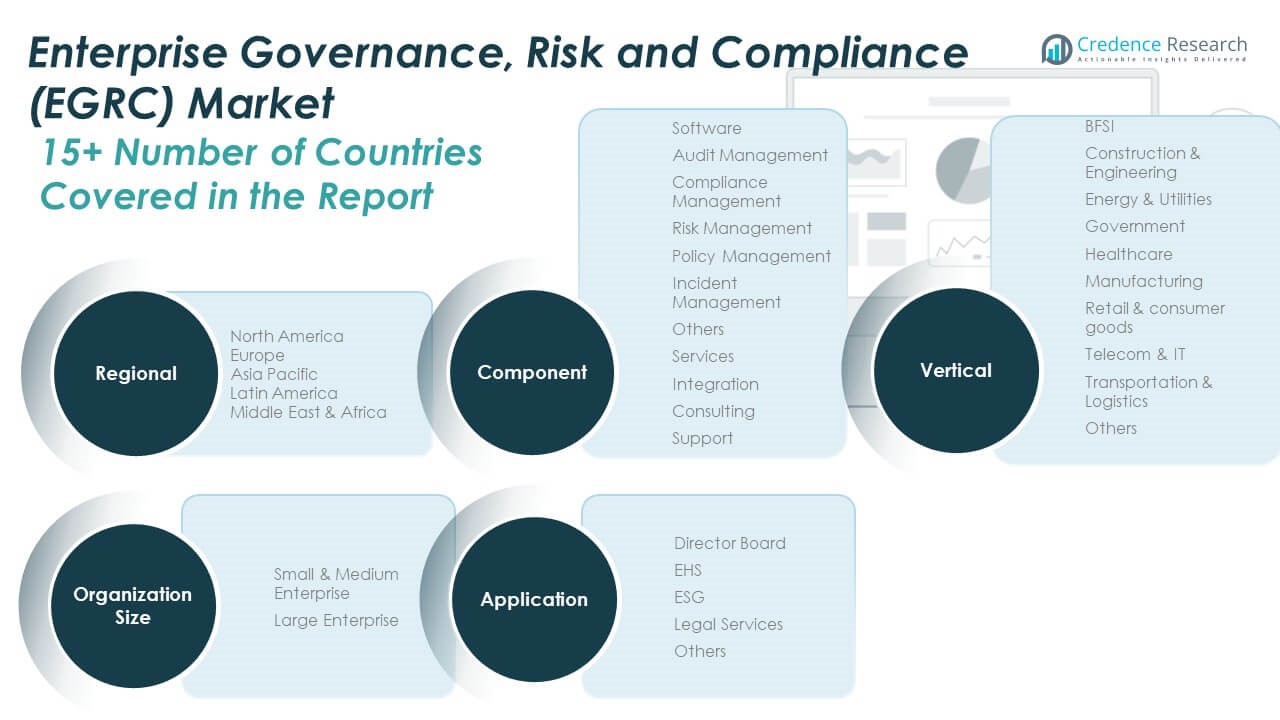
By Component
The Global Enterprise Governance, Risk and Compliance (EGRC) Market is segmented into software and services. The software segment includes audit management, compliance management, risk management, policy management, incident management, and others. Risk and compliance management tools lead the segment due to growing regulatory complexities and cyber threats. The services segment comprises integration, consulting, and support. Integration services hold strong demand, helping enterprises align EGRC platforms with their existing technology stack.
For instance, IBM OpenPages integrated with IBM Cloud Pak has been implemented by more than 400 multinational enterprises to consolidate compliance and risk modules, supporting over 500,000 end-users globally as of 2023.
By Application
Key application areas include Director Board, EHS (Environment, Health & Safety), ESG (Environmental, Social & Governance), Legal Services, and others. ESG and EHS applications are expanding rapidly as organizations prioritize sustainability, transparency, and workforce safety. Legal services continue to play a strategic role in managing legal risks and compliance across jurisdictions.
- For instance, Diligent’s Board Management solution is utilized by more than 700,000 board members and executives worldwide to manage governance, audit, and ESG integration across 25,000 organizations as of 2023.
By Organization Size
The market is divided into Small & Medium Enterprises (SMEs) and Large Enterprises. Large enterprises dominate adoption due to complex operational structures and greater compliance obligations. SMEs are witnessing increased adoption, supported by modular, cloud-based EGRC solutions tailored for resource-limited environments.
By Vertical
The vertical segmentation includes BFSI, Construction & Engineering, Energy & Utilities, Government, Healthcare, Manufacturing, Retail & Consumer Goods, Telecom & IT, Transportation & Logistics, and others. BFSI leads the market due to its risk-sensitive operations and tight regulatory oversight. Healthcare and telecom follow, driven by data privacy mandates and digital infrastructure growth. It continues to see expansion across diverse industries seeking risk alignment and policy automation.
Segmentation:
By Component
- Software
- Audit Management
- Compliance Management
- Risk Management
- Policy Management
- Incident Management
- Others
- Services
- Integration
- Consulting
- Support
By Application
- Director Board
- EHS (Environment, Health & Safety)
- ESG (Environmental, Social & Governance)
- Legal Services
- Others
By Organization Size
- Small & Medium Enterprise
- Large Enterprise
By Vertical
- BFSI
- Construction & Engineering
- Energy & Utilities
- Government
- Healthcare
- Manufacturing
- Retail & Consumer Goods
- Telecom & IT
- Transportation & Logistics
- Others
By Region
- North America
- Europe
- Asia Pacific
- Latin America
- Middle East
-
Africa
Regional Analysis:
North America
The North America Enterprise Governance, Risk and Compliance (EGRC) Market size was valued at USD 15,999.30 million in 2018 to USD 22,977.57 million in 2024 and is anticipated to reach USD 60,252.83 million by 2032, at a CAGR of 12.9% during the forecast period. The Global Enterprise Governance, Risk and Compliance (EGRC) Market sees strong growth in North America, supported by early adoption of advanced risk and compliance platforms. It benefits from stringent regulatory enforcement in financial services, healthcare, and defense sectors. The U.S. drives market leadership due to frequent regulatory updates and a large base of multinational corporations. Organizations prioritize centralized governance strategies to avoid litigation, data breaches, and financial penalties. The availability of robust cloud infrastructure and presence of major vendors fuel regional expansion. Demand continues to rise for AI-powered and real-time compliance tools.
Europe
The Europe Enterprise Governance, Risk and Compliance (EGRC) Market size was valued at USD 11,062.05 million in 2018 to USD 15,432.83 million in 2024 and is anticipated to reach USD 38,195.80 million by 2032, at a CAGR of 12.1% during the forecast period. Europe’s regulatory landscape is driven by data privacy mandates such as GDPR and corporate governance initiatives. The Global Enterprise Governance, Risk and Compliance (EGRC) Market gains traction from European firms seeking to unify risk, audit, and compliance reporting. Countries like Germany, France, and the U.K. are investing in sustainable compliance strategies. Public and private sectors both contribute to growth, driven by digital transformation agendas. EGRC solutions tailored for ESG and financial compliance are in high demand. Regional collaboration on cross-border compliance strengthens the overall market framework.
Asia Pacific
The Asia Pacific Enterprise Governance, Risk and Compliance (EGRC) Market size was valued at USD 12,484.50 million in 2018 to USD 18,832.93 million in 2024 and is anticipated to reach USD 53,843.88 million by 2032, at a CAGR of 14.1% during the forecast period. The Global Enterprise Governance, Risk and Compliance (EGRC) Market sees the fastest growth in Asia Pacific due to policy digitization and economic modernization. Governments in China, India, and Southeast Asia are introducing new data protection and corporate accountability laws. Organizations implement EGRC solutions to reduce fraud, improve oversight, and align with international standards. Financial services, telecom, and IT sectors lead adoption. Cloud migration and local vendor partnerships enhance accessibility. Regional growth is supported by education initiatives and demand for scalable compliance solutions.
Latin America
The Latin America Enterprise Governance, Risk and Compliance (EGRC) Market size was valued at USD 1,783.50 million in 2018 to USD 2,553.88 million in 2024 and is anticipated to reach USD 5,955.52 million by 2032, at a CAGR of 11.3% during the forecast period. The Global Enterprise Governance, Risk and Compliance (EGRC) Market expands in Latin America through structural reforms and anti-corruption efforts. Countries like Brazil and Mexico implement governance practices aligned with international benchmarks. Companies adopt EGRC platforms to build transparency and improve corporate ethics. The financial, mining, and energy sectors experience heightened compliance demands. EGRC vendors introduce localized products to fit regional legal structures. Market momentum is further supported by investor scrutiny and regulatory modernization.
Middle East
The Middle East Enterprise Governance, Risk and Compliance (EGRC) Market size was valued at USD 1,357.20 million in 2018 to USD 1,820.63 million in 2024 and is anticipated to reach USD 4,201.49 million by 2032, at a CAGR of 11.1% during the forecast period. The Global Enterprise Governance, Risk and Compliance (EGRC) Market grows in the Middle East with support from state-led digital governance reforms. Countries like Saudi Arabia and the UAE focus on enhancing public sector transparency and private sector competitiveness. EGRC tools are widely adopted in banking, energy, and real estate domains. Multinational corporations and government agencies invest in integrated platforms to manage risk exposure. Compliance automation and Islamic finance regulations drive specialized solution demand. Market expansion benefits from partnerships between local regulators and international vendors.
Africa
The Africa Enterprise Governance, Risk and Compliance (EGRC) Market size was valued at USD 813.45 million in 2018 to USD 1,612.63 million in 2024 and is anticipated to reach USD 3,581.16 million by 2032, at a CAGR of 10.1% during the forecast period. The Global Enterprise Governance, Risk and Compliance (EGRC) Market is developing in Africa, driven by financial transparency initiatives and regulatory adoption. Countries like South Africa, Nigeria, and Kenya focus on strengthening internal controls and audit processes. The rise in mobile banking and fintech services creates new compliance needs. EGRC adoption is increasing in government programs, insurance, and telecommunications. Market growth faces infrastructure and awareness challenges, but global donor support and digital finance initiatives boost regional momentum. Localized training programs and regulatory collaboration contribute to adoption.
Shape Your Report to Specific Countries or Regions & Enjoy 30% Off!
Key Player Analysis:
- FIS
- Genpact
- IBM
- Maclear Global
- MetricStream
- Microsoft
- NAVEX Global, Inc.
- Oracle
- RSA Security LLC
- SAI360 Inc.
- SAP SE
- SAS Institute Inc.
- Software GmbH
- Thomson Reuters
- Wolters Kluwer N.V.
Competitive Analysis:
The Global Enterprise Governance, Risk and Compliance (EGRC) Market features a competitive landscape with key players focusing on product innovation, cloud integration, and industry-specific solutions. Major companies include IBM, SAP SE, Oracle, MetricStream, Microsoft, and Wolters Kluwer. These players invest in AI, machine learning, and automation to enhance real-time risk intelligence and compliance visibility. It is witnessing strong competition in platform unification, where vendors aim to deliver scalable, all-in-one EGRC suites. Strategic partnerships, mergers, and regional expansions are common tactics to increase market share and strengthen domain expertise. New entrants are targeting small and mid-sized enterprises through flexible subscription-based models. Vendors that offer modular, user-centric platforms with high integration capability gain a competitive edge. Continuous regulatory changes and cybersecurity demands ensure that product adaptability and speed to compliance remain central to sustaining leadership in the evolving EGRC market landscape.
Recent Developments:
- In June 2025, Genpact completed the acquisition of XponentL Data, a data products and AI solutions provider, to strengthen its advanced technology offerings. This move is aimed at accelerating Genpact’s AI-led innovation and expanding its expertise in data strategy, engineering, and AI transformation across multiple industries.
- In May 2025, MetricStream unveiled a major brand update and adopted an AI-first strategy for its GRC platform. The new approach focuses on embedding generative AI and automation to simplify risk, compliance, and audit processes for global organizations, accompanied by a refreshed leadership team and identity.
- In May 2025, Microsoft’s acquisition of Activision Blizzard, initiated in 2023, was finally cleared of regulatory challenge by the U.S. Federal Trade Commission, confirming the completion of one of the largest transactions in technology and entertainment.In April 2025, Microsoft also reportedly divested Metaswitch to Alianza, further optimizing its portfolio for cloud and communication services.
- In April 2025, Maclear Global introduced a new borrower scoring system using an investment grade scale (AAA to D), improving transparency and risk assessment capabilities for clients. The company also enhanced its deposit process by exclusively partnering with Narvi Bank, emphasizing improved security and operational speed for end users.
Market Concentration & Characteristics:
The Global Enterprise Governance, Risk and Compliance (EGRC) Market is moderately concentrated, with a mix of established enterprise software providers and niche solution vendors. It is characterized by high demand for integrated, cloud-based platforms that deliver real-time visibility across risk, compliance, and governance functions. Leading players such as IBM, SAP, Oracle, and Microsoft maintain strong market positions through broad portfolios and global presence. The market favors vendors with advanced analytics, regulatory intelligence, and cross-industry applicability. It demands scalability, configurability, and seamless integration with enterprise IT systems. Mid-tier and emerging players differentiate by offering industry-specific capabilities and flexible deployment models. Buyers prioritize platform reliability, auditability, and security compliance, making certification and regulatory alignment key purchase criteria. Frequent regulatory changes and complex enterprise environments reinforce the need for continuous product enhancement and service excellence in this dynamic and compliance-driven market.
Report Coverage:
The research report offers an in-depth analysis based on component, application, organization size, and vertical. It details leading market players, providing an overview of their business, product offerings, investments, revenue streams, and key applications. Additionally, the report includes insights into the competitive environment, SWOT analysis, current market trends, as well as the primary drivers and constraints. Furthermore, it discusses various factors that have driven market expansion in recent years. The report also explores market dynamics, regulatory scenarios, and technological advancements that are shaping the industry. It assesses the impact of external factors and global economic changes on market growth. Lastly, it provides strategic recommendations for new entrants and established companies to navigate the complexities of the market.
Future Outlook:
- The market will witness strong growth driven by increased regulatory scrutiny across finance, healthcare, and energy sectors.
- AI and machine learning integration will enhance predictive risk analytics and automate compliance workflows.
- Cloud-based EGRC solutions will gain traction among SMEs due to cost efficiency and deployment flexibility.
- Demand for ESG-related compliance tools will rise with stricter global sustainability mandates.
- Real-time cybersecurity and incident response capabilities will become core features in EGRC platforms.
- Vendors will focus on cross-platform interoperability to support complex IT environments.
- North America will maintain dominance, while Asia-Pacific will register the fastest growth due to digital transformation.
- Strategic acquisitions and partnerships will accelerate product innovation and global expansion.
- Industry-specific EGRC frameworks will see rising adoption in telecom, logistics, and manufacturing.
- Organizations will prioritize unified platforms that consolidate governance, risk, audit, and compliance functions.


