| REPORT ATTRIBUTE |
DETAILS |
| Historical Period |
2020-2023 |
| Base Year |
2024 |
| Forecast Period |
2025-2032 |
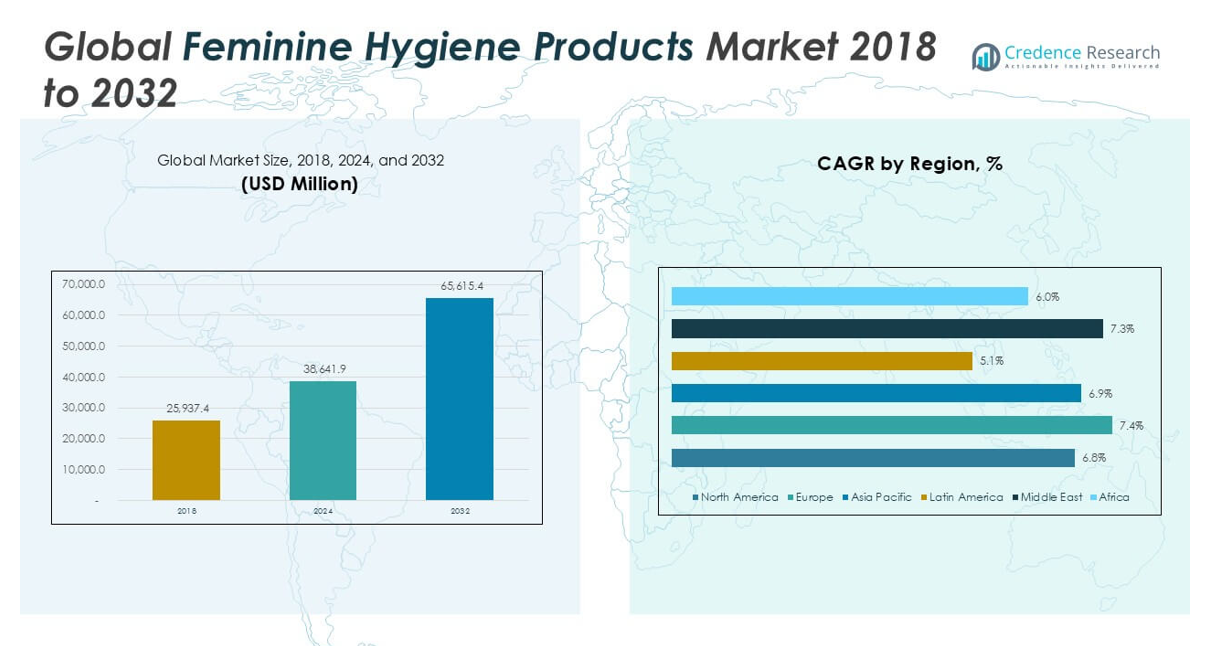
| Feminine Hygiene Products Market Size 2024 |
USD 38,641.9 million |
| Feminine Hygiene Products Market, CAGR |
6.86% |
| Feminine Hygiene Products Market Size 2032 |
USD 65,615.4 million |
Market Overview
The Feminine Hygiene Products Market was valued at USD 25,937.4 million in 2018 and grew to USD 38,641.9 million in 2024. It is anticipated to reach USD 65,615.4 million by 2032, registering a compound annual growth rate (CAGR) of 6.86% during the forecast period.
The Feminine Hygiene Products Market is experiencing robust growth driven by increasing awareness of women’s health and hygiene, rising disposable income, and the expansion of the female workforce globally. The market benefits from greater access to education and health information, which encourages higher adoption rates, particularly in developing regions. Product innovation, such as the development of organic, biodegradable, and reusable hygiene products, is meeting evolving consumer preferences for sustainability and safety. E-commerce channels are also expanding market reach, enabling consumers to access a wider range of products discreetly and conveniently. Regulatory support and government initiatives focused on menstrual health are further propelling market expansion. However, persistent social taboos and lack of awareness in certain areas continue to limit growth. Overall, these factors, combined with the growing influence of social media and advocacy campaigns, are shaping a dynamic and rapidly evolving landscape for feminine hygiene products worldwide.
The geographical analysis of the Feminine Hygiene Products Market highlights strong demand across North America, Europe, and Asia Pacific, driven by rising awareness, improved access to hygiene products, and ongoing product innovation. North America and Europe benefit from established retail infrastructure, widespread education on menstrual health, and consumer preference for premium and sustainable solutions. In Asia Pacific, countries like China, India, and Japan experience rapid market expansion, fueled by urbanization, growing middle-class populations, and government-led awareness campaigns. Key players shaping the competitive landscape include Procter & Gamble, Kimberly-Clark Corporation, and Unicharm Corporation. These companies focus on product innovation, sustainability, and expanding their distribution networks to meet evolving consumer needs and capture new growth opportunities worldwide.
Market Insights
- The Feminine Hygiene Products Market was valued at USD 38,641.9 million in 2024 and is projected to reach USD 65,615.4 million by 2032, registering a CAGR of 6.86%.
- Rising awareness about menstrual hygiene, increasing disposable incomes, and greater female workforce participation continue to drive market growth worldwide.
- Demand for sustainable and eco-friendly products is accelerating, with consumers shifting toward organic, biodegradable, and reusable options such as menstrual cups and natural ingredient-based pads.
- Leading companies, including Procter & Gamble, Kimberly-Clark Corporation, and Unicharm Corporation, maintain their positions by investing in product innovation, expanding global reach, and offering diverse product portfolios.
- Social taboos, affordability challenges, and limited awareness in rural and low-income regions act as persistent restraints on market expansion, especially in developing countries.
- North America, Europe, and Asia Pacific lead the market due to strong retail infrastructure, effective awareness campaigns, and rapid urbanization; key growth countries include the United States, China, India, and Germany.
- The competitive landscape is characterized by frequent product launches, strategic partnerships, and a focus on sustainability, with new entrants and established players competing to capture evolving consumer preferences and strengthen brand loyalty.
Access crucial information at unmatched prices!
Request your sample report today & start making informed decisions powered by Credence Research Inc.!
Download Sample
Market Drivers
Rising Awareness and Educational Initiatives Fuel Adoption of Feminine Hygiene Products
Increased awareness of women’s health and hygiene needs plays a central role in expanding the Feminine Hygiene Products Market. Educational campaigns and widespread dissemination of health information encourage proactive management of menstrual health. Governments, non-profit organizations, and private players invest in outreach programs, workshops, and school curriculums that emphasize the importance of menstrual hygiene. This heightened awareness prompts women to seek reliable, effective hygiene solutions, driving market penetration in both urban and rural regions. Accessibility to accurate information helps break longstanding taboos, allowing open discussions about menstrual health. The collective focus on education fosters a supportive environment for product adoption, strengthening market growth.
- For instance, Procter & Gamble’s “Always Keeping Girls in School” initiative reached over 170,000 girls across more than 1,100 schools in Nigeria, providing education and free sanitary pads to reduce absenteeism.
Product Innovation and Sustainable Solutions Address Evolving Consumer Preferences
The market is experiencing steady growth due to continuous product innovation and the introduction of sustainable solutions. Companies invest in research and development to create organic, biodegradable, and reusable products that cater to environmentally conscious consumers. The Feminine Hygiene Products Market benefits from the development of safer, skin-friendly, and allergen-free alternatives, attracting a broader user base. Innovations such as period panties, menstrual cups, and natural ingredient-based pads and tampons enhance product variety and appeal. These advancements not only align with global sustainability goals but also improve consumer trust and satisfaction. Strong demand for innovative products supports a competitive market landscape.
- For instance, Kimberly-Clark introduced over 30 new feminine care SKUs in the last two years, focusing on organic materials and hypoallergenic designs for their Kotex brand.
Rising Female Workforce Participation and Urbanization Increase Product Demand
Greater participation of women in the workforce and growing urbanization drive consistent demand for feminine hygiene products. Working women, seeking comfort and convenience, prioritize high-quality, discreet solutions suitable for active lifestyles. Urban populations, characterized by higher purchasing power and access to retail and digital channels, contribute significantly to market expansion. The Feminine Hygiene Products Market leverages these demographic shifts to boost both product availability and adoption rates. Corporate wellness programs and employer-driven health benefits often include feminine hygiene products, supporting regular use. Rapid urban growth and evolving lifestyle trends further reinforce sustained market demand.
E-Commerce Expansion and Government Initiatives Strengthen Market Accessibility
The proliferation of e-commerce platforms and targeted government initiatives increase the accessibility and affordability of feminine hygiene products. Online retail enables discreet purchases, wider product selection, and convenient home delivery, appealing to consumers in diverse geographies. The Feminine Hygiene Products Market grows as governments implement policies to subsidize products and eliminate taxes, especially for underserved populations. Collaborative efforts between stakeholders promote market inclusivity and ensure availability in remote or rural areas. Digital marketing and influencer engagement through e-commerce channels enhance product visibility and consumer education. This multi-faceted approach accelerates market growth and fosters equitable access.
Market Trends
Shift Toward Sustainable and Eco-Friendly Feminine Hygiene Products Gains Momentum
A prominent trend shaping the Feminine Hygiene Products Market is the shift toward sustainable and eco-friendly alternatives. Consumers are increasingly seeking products that minimize environmental impact, favoring organic cotton pads, biodegradable tampons, and reusable menstrual cups. Brands respond by investing in green materials, recyclable packaging, and transparent supply chains. The market now features a wider range of natural and chemical-free options, appealing to health-conscious individuals. This trend drives innovation in both product development and marketing strategies, positioning eco-friendly solutions at the forefront. The transition to sustainability supports long-term brand loyalty and encourages responsible consumption habits.
- For instance, Unicharm’s “Sofy Organics” product line in Japan uses 100% organic cotton for its top sheets and has sold more than 12 million units since launch.
Digital Transformation Enhances Access and Consumer Engagement Across Regions
Digitalization transforms access to feminine hygiene products and influences consumer buying behavior worldwide. E-commerce platforms, social media marketing, and direct-to-consumer models make it easier for women to learn about, compare, and purchase products from the comfort of their homes. The Feminine Hygiene Products Market leverages digital tools to build brand awareness, deliver educational content, and facilitate discreet shopping experiences. Influencer partnerships and targeted digital campaigns drive product visibility and foster community engagement. Online feedback and reviews guide product development and help brands address emerging consumer needs. The digital shift enhances transparency, convenience, and personalization for a global customer base.
- For instance, The Honest Company reported that over 60% of its feminine hygiene product sales were generated through its online platform in 2023, demonstrating a strong digital engagement strategy.
Increased Focus on Health, Wellness, and Product Safety Shapes Product Development
An increased emphasis on overall health and wellness significantly influences the development of feminine hygiene products. Consumers prioritize products free from harmful chemicals, fragrances, and allergens, prompting brands to highlight safety, purity, and dermatological testing. The Feminine Hygiene Products Market introduces hypoallergenic, pH-balanced, and gynecologist-approved products to address diverse needs. Brands actively educate consumers on proper usage, product ingredients, and potential health benefits through expert endorsements and clear labeling. This health-focused trend supports trust and credibility, leading to greater consumer satisfaction and repeat purchases. Ongoing research into safer formulations continues to drive advancements in the market.
Emergence of Inclusive Marketing and New Product Categories Expands Market Reach
Inclusive marketing strategies and the introduction of new product categories broaden the market’s appeal across demographics. Brands are designing products for various life stages, from adolescence to menopause, including specialized solutions for sensitive skin and post-partum care. The Feminine Hygiene Products Market sees increased representation of diverse identities in advertising, fostering acceptance and destigmatization. Companies engage with communities to address unmet needs and promote open conversations about menstrual and intimate health. This inclusive approach, combined with product variety, enhances market penetration and supports long-term industry growth. The trend toward inclusivity ensures broader relevance and social impact for leading brands.
Market Challenges Analysis
Persistent Social Taboos and Lack of Awareness Hinder Market Expansion
Cultural stigmas and social taboos surrounding menstruation continue to hinder the growth of the Feminine Hygiene Products Market, particularly in developing regions. Deep-rooted misconceptions, limited open dialogue, and inadequate health education prevent women and girls from accessing or prioritizing menstrual hygiene products. The market faces challenges in breaking through these barriers, despite ongoing advocacy and awareness campaigns. Limited product knowledge and reliance on traditional alternatives reduce adoption rates in certain areas. Community outreach efforts must address misinformation and foster acceptance to achieve sustained market progress. The impact of social attitudes on purchasing decisions remains a significant barrier for industry stakeholders.
Affordability, Distribution Constraints, and Regulatory Hurdles Restrict Accessibility
High product costs, inefficient distribution networks, and complex regulatory requirements limit the accessibility of feminine hygiene products for many consumers. The Feminine Hygiene Products Market encounters obstacles when serving low-income populations or reaching rural areas with limited infrastructure. Regulatory variations across countries complicate product launches and compliance processes, raising operational costs for manufacturers. E-commerce growth helps bridge some distribution gaps but cannot fully resolve affordability concerns. Addressing these challenges requires collaborative action from governments, NGOs, and private sector partners to promote inclusive access. Market players must balance cost efficiency, regulatory compliance, and product quality to ensure broader availability.
Market Opportunities
Expansion into Emerging Markets Presents Significant Growth Potential
Emerging markets represent a major opportunity for the Feminine Hygiene Products Market, fueled by rising income levels, urbanization, and improved access to education. Increasing awareness about women’s health encourages adoption of branded hygiene products among previously underserved populations. Companies can expand their reach by tailoring products to local preferences, price sensitivities, and distribution dynamics. Strategic partnerships with local organizations, governments, and community groups enhance outreach and brand recognition. The market stands to benefit from investments in supply chain infrastructure and targeted marketing initiatives. Continued focus on accessibility and affordability can unlock sustained demand and accelerate growth across developing regions.
Product Diversification and Technological Innovation Drive Competitive Advantage
Opportunities abound for brands that introduce new product categories and leverage technological advancements. The Feminine Hygiene Products Market responds to changing consumer expectations with innovations such as smart period care devices, customizable solutions, and sustainable packaging. Brands that invest in research and development can set themselves apart by delivering unique value propositions and addressing niche needs. Personalization, digital engagement, and data-driven product recommendations further enhance customer loyalty and market differentiation. Collaborating with healthcare professionals and integrating educational content can improve product credibility and consumer trust. These strategies create pathways for long-term success and industry leadership.
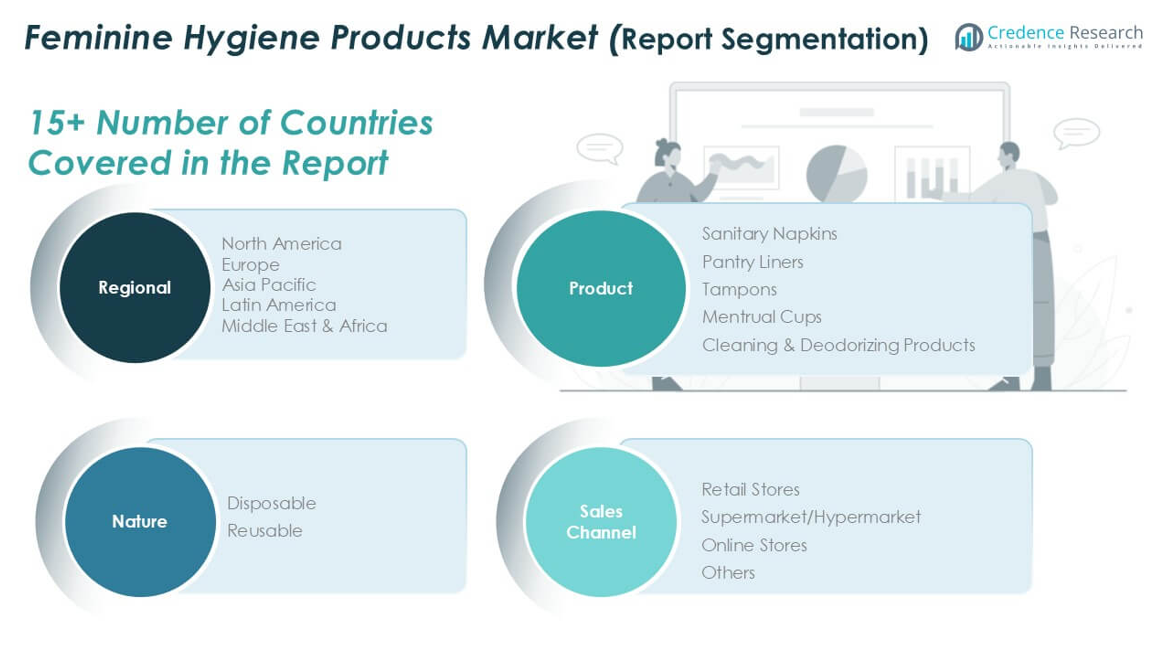
Market Segmentation Analysis:
By Product:
The Feminine Hygiene Products Market features a diverse product portfolio, catering to a wide range of consumer needs and preferences. Sanitary napkins hold the largest share within the product segment, supported by high consumer familiarity, convenience, and affordability. Panty liners continue to gain traction among women seeking daily freshness and light protection, while tampons appeal to consumers seeking discreet and comfortable menstrual solutions, particularly in urban regions. Menstrual cups represent a rapidly expanding segment, favored for their reusability, cost-effectiveness, and growing environmental awareness. Cleaning and deodorizing products complement traditional offerings by addressing hygiene and odor concerns, attracting consumers focused on holistic personal care.
- For instance, Edgewell Personal Care’s “Playtex” brand distributed over 45 million tampons annually in North America, meeting growing demand for reliable and comfortable solutions.
By Nature:
The market consists of disposable and reusable products. Disposable products, such as single-use sanitary napkins and tampons, dominate the Feminine Hygiene Products Market due to their widespread availability and convenience. These products remain popular among consumers who prioritize hygiene and minimal maintenance. Reusable products, including menstrual cups and washable pads, are gaining momentum, supported by increasing demand for sustainable and economical solutions. Environmental concerns and cost savings drive the adoption of reusable options, particularly among younger consumers and environmentally conscious demographics.
- For instance, Diva International sold over 6 million DivaCup reusable menstrual cups in more than 35 countries, underscoring the global shift toward reusables.
By Sales Channel:
The market segmentation by sales channel includes retail stores, supermarket/hypermarket, online stores, and others. Retail stores account for a significant portion of sales, offering easy access and product variety in urban and rural areas alike. Supermarket and hypermarket channels provide consumers with a wide selection and competitive pricing, strengthening their role in the distribution landscape. Online stores are experiencing rapid growth, driven by the need for privacy, convenience, and access to a broader product range. It benefits from digital transformation and the rising preference for e-commerce, which allows consumers to compare options and read reviews before making a purchase. Other channels, including pharmacies and specialty shops, continue to support market accessibility, especially for niche or specialized products. This multi-channel approach ensures comprehensive market coverage and meets the evolving shopping habits of consumers worldwide.
Segments:
Based on Product:
- Sanitary Napkins
- Panty Liners
- Tampons
- Menstrual Cups
- Cleaning & Deodorizing Products
Based on Nature:
Based on Sales Channel:
- Retail Stores
- Supermarket/Hypermarket
- Online Stores
- Others
Based on the Geography:
- North America
- Europe
- UK
- France
- Germany
- Italy
- Spain
- Russia
- Belgium
- Netherlands
- Austria
- Sweden
- Poland
- Denmark
- Switzerland
- Rest of Europe
- Asia Pacific
- China
- Japan
- South Korea
- India
- Australia
- Thailand
- Indonesia
- Vietnam
- Malaysia
- Philippines
- Taiwan
- Rest of Asia Pacific
- Latin America
- Brazil
- Argentina
- Peru
- Chile
- Colombia
- Rest of Latin America
- Middle East
- UAE
- KSA
- Israel
- Turkey
- Iran
- Rest of Middle East
- Africa
- Egypt
- Nigeria
- Algeria
- Morocco
- Rest of Africa
Regional Analysis
North America Feminine Hygiene Products Market
North America Feminine Hygiene Products Market grew from USD 6,826.73 million in 2018 to USD 10,122.52 million in 2024 and is projected to reach USD 17,079.70 million by 2032, reflecting a compound annual growth rate (CAGR) of 6.8%. North America is holding a 26.2% market share. The United States and Canada dominate this region, supported by high consumer awareness, robust retail infrastructure, and increasing demand for premium and organic products. Government and NGO-led education initiatives continue to promote menstrual health, while the expansion of e-commerce further accelerates market growth. The presence of global and local brands ensures a competitive landscape and wide product availability.
Europe Feminine Hygiene Products Market
Europe Feminine Hygiene Products Market grew from USD 6,186.07 million in 2018 to USD 9,517.49 million in 2024 and is expected to reach USD 16,843.48 million by 2032, at a CAGR of 7.4%. Europe accounts for a 25.7% market share. Key countries include Germany, the United Kingdom, and France, where consumer focus on sustainability and product safety drives demand for eco-friendly and reusable options. Regulatory initiatives supporting menstrual health and product transparency boost market penetration. The region benefits from strong retail and online distribution networks, making a wide variety of products easily accessible.
Asia Pacific Feminine Hygiene Products Market
Asia Pacific Feminine Hygiene Products Market grew from USD 8,525.63 million in 2018 to USD 12,723.11 million in 2024 and is forecast to reach USD 21,653.09 million by 2032, with a CAGR of 6.9%. Asia Pacific holds a 33% market share, making it the largest regional market. China, India, and Japan lead this segment due to rising income levels, urbanization, and improving health awareness. Efforts by governments and NGOs to educate women on menstrual hygiene are driving rapid market adoption. The growing middle-class population and retail expansion continue to support strong growth across the region.
Latin America Feminine Hygiene Products Market
Latin America Feminine Hygiene Products Market grew from USD 2,277.31 million in 2018 to USD 3,097.97 million in 2024 and will likely reach USD 4,593.08 million by 2032, posting a CAGR of 5.1%. Latin America holds a 7% market share. Brazil and Mexico stand out as the primary markets, where increasing urbanization and rising female workforce participation encourage demand. Distribution challenges in rural areas persist, but the adoption of e-commerce channels is gradually improving product reach. Awareness programs by local organizations are slowly addressing social barriers.
Middle East Feminine Hygiene Products Market
Middle East Feminine Hygiene Products Market grew from USD 1,600.34 million in 2018 to USD 2,438.85 million in 2024 and is estimated to reach USD 4,265.00 million by 2032, registering a CAGR of 7.3%. The Middle East holds a 6.5% market share. Saudi Arabia and the United Arab Emirates are key countries in this region, benefiting from changing cultural attitudes and greater female workforce integration. Government health initiatives and urban retail growth drive steady product demand. The market is also witnessing greater availability of premium and organic hygiene products.
Africa Feminine Hygiene Products Market
Africa Feminine Hygiene Products Market grew from USD 521.34 million in 2018 to USD 741.92 million in 2024 and is projected to reach USD 1,181.08 million by 2032, with a CAGR of 6.0%. Africa commands a 1.8% market share. South Africa, Nigeria, and Egypt represent the leading markets, where rising awareness and international aid programs encourage product adoption. Infrastructure limitations and affordability challenges persist, but targeted outreach and retail expansion are improving access to hygiene solutions. The market continues to rely on government and NGO support to raise awareness and boost product penetration.
Shape Your Report to Specific Countries or Regions & Enjoy 30% Off!
Key Player Analysis
- Procter & Gamble
- Kimberly-Clark Corporation
- Edgewell Personal Care
- Unicharm Corporation
- Hengan International Group
- Ontex Group
- The Honest Company
- Bella
- Corman SpA
Competitive Analysis
The competitive landscape of the Feminine Hygiene Products Market is characterized by the strong presence of global industry leaders such as Procter & Gamble, Kimberly-Clark Corporation, Unicharm Corporation, Edgewell Personal Care, Hengan International Group, Ontex Group, The Honest Company, Bella, and Corman SpA. These key players leverage robust research and development capabilities to launch innovative products that meet evolving consumer demands for safety, comfort, and sustainability. Product portfolios feature a wide range of offerings, including sanitary napkins, tampons, panty liners, menstrual cups, and eco-friendly alternatives to capture diverse market segments. Leading companies actively invest in marketing campaigns, brand building, and educational initiatives to boost consumer awareness and foster loyalty. Expansive distribution networks, both online and offline, enable these players to penetrate developed and emerging markets effectively. Sustainability remains a critical focus, with many companies prioritizing biodegradable materials, recyclable packaging, and social impact programs. Strategic mergers, acquisitions, and collaborations help strengthen global reach and accelerate product innovation, keeping these firms at the forefront of the industry. The dynamic competitive environment continues to push players to differentiate through quality, affordability, and value-added features, sustaining growth and reinforcing market leadership
Recent Developments
- In August 2024, Unilever Ventures invested over USD 2 million in Luna Daily, a UK-based intimate body care brand focusing on microbiome-balancing and natural and vegan products. This investment aims to expand Luna Daily’s motherhood product line and marketing strategies.
- In August 2024, Edgewell reported a 23% rise in adjusted Earnings Per Share (EPS) despite a slight drop in net sales. In the feminine care segment, the net sales of pads and tampons decreased by 7.9%, which was partially offset by an increase in liner sales.
- In March 2023, Unicharm implemented menstrual education programs in Egypt and China, benefiting thousands of students. Moreover, the company hosted the “Mahila Udyami Samman” event under “Project Jagriti” in May 2023 in India to support and promote women’s economic empowerment with menstrual hygiene awareness.
- In December 2023, Ontex introduced two new feminine care products: SatinSense tampons with a silky coating for comfort and Confidaily daily liners offering high levels of protection and comfort.
Market Concentration & Characteristics
The Feminine Hygiene Products Market demonstrates a moderate to high level of market concentration, with a few multinational corporations commanding significant influence through extensive product portfolios and established global distribution networks. It features a mix of established brands and emerging players, leading to healthy competition and frequent product innovation. The market is characterized by strong brand loyalty, recurring consumer purchases, and high sensitivity to product safety, quality, and affordability. Companies differentiate through continuous investment in research and development, sustainability initiatives, and tailored marketing strategies. Evolving consumer preferences for organic, reusable, and eco-friendly products drive ongoing changes in product offerings and packaging. The regulatory landscape demands compliance with health, safety, and environmental standards, encouraging responsible business practices. The combination of advanced manufacturing capabilities, widespread retail access, and targeted awareness campaigns supports robust market development and ensures that industry leaders maintain their competitive edge while creating opportunities for niche brands.
Report Coverage
The research report offers an in-depth analysis based on Product, Nature, Sales Channel and Geography. It details leading market players, providing an overview of their business, product offerings, investments, revenue streams, and key applications. Additionally, the report includes insights into the competitive environment, SWOT analysis, current market trends, as well as the primary drivers and constraints. Furthermore, it discusses various factors that have driven market expansion in recent years. The report also explores market dynamics, regulatory scenarios, and technological advancements that are shaping the industry. It assesses the impact of external factors and global economic changes on market growth. Lastly, it provides strategic recommendations for new entrants and established companies to navigate the complexities of the market.
Future Outlook
- The Feminine Hygiene Products Market will continue to grow due to rising global awareness of menstrual health.
- Growing demand for sustainable products will prompt companies to expand reusable and biodegradable offerings.
- E-commerce platforms will become more influential in product distribution and consumer outreach.
- Private-label brands may increase market share through competitive pricing and value positioning.
- Technological integration, such as smart period care devices, will gain traction among health-conscious consumers.
- Partnerships between manufacturers and NGOs will support outreach in underserved rural and low-income regions.
- Improved regulatory standards will drive transparency and encourage adoption of safer product alternatives.
- Personalization through data-driven insights will boost consumer loyalty and tailor product experiences.
- Brand strategies will likely focus on inclusive messaging to address diverse life stages and identities.
- Continued investment in research and innovation will shape future product development and market differentiation.


