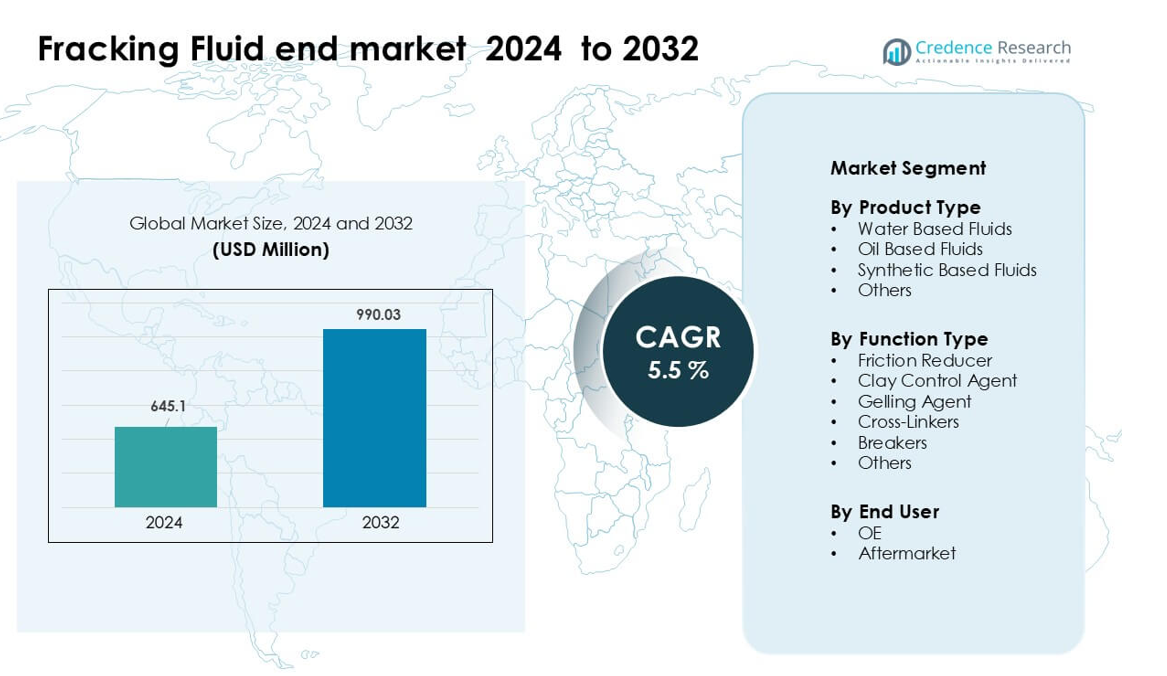
Home » Automotive & Transportation » Fracking Fluid End Market

Fracking Fluid End Market By Material Type (Carbon Steel Fluid End, Stainless-Steel Fluid End) By End-User Type (OE, Aftermarket) By Horsepower Type (2000-2500 HP, Above 2500 HP)– By Design Type (Triplex, Quintuplex) – Growth, Future Prospects & Competitive Analysis, 2016 – 2028

Price: $4999

Published: | Report ID: 5678 | Report Format : PDF

About this report

The global fracking fluid end market report explores the critical analysis of the fracking fluid end industry using key parameters. The report consists of investment strategies, the need for investments in the fracking fluid end industry, and the multiple benefits for investors. Importantly, this report sets out major changes in the global technical regulations for the fracking fluid end industry and how economic and non-economic barriers are helping the market grow. Moreover, the report analyses the global, regional, and country-level historic and forecasted market size. The report also provides a comprehensive analysis of key investment propositions, demand and supply gap, competitors positioning, STAR analysis, SRC analysis, and Tornado analysis. Key technological developments and other analyses include Porter’s five forces analysis, PESTEL analysis, value chain analysis, etc.

REPORT ATTRIBUTE DETAILS
Fracking Fluid End Market by Volume Yes
Fracking Fluid End Market by Value Yes
Fracking Fluid End Market, Tornado Analysis Yes
Fracking Fluid End Market, STAR Analysis Yes
Fracking Fluid End Market, SRC Analysis Yes
Fracking Fluid End Market, Import-Export Data Yes (On Demand)
Fracking Fluid End Market Pricing Analysis Yes (On Demand)
Fracking Fluid End Market Segment Analysis By Material Type (Carbon Steel Fluid End and Stainless-Steel Fluid End)

By End-User Type (OE and Aftermarket)

By Horsepower Type (2000-2500 HP and Above 2500 HP)

By Design Type (Triplex and Quintuplex)

Fracking Fluid End Market, Regional Analysis North America (the US and Canada)

Europe (Germany, UK, France, Italy, Spain, and the Rest of Europe)

Asia Pacific (China, India, Japan, South Korea, South East Asia, and the Rest of Asia Pacific)

Latin America (Brazil, Mexico, and the Rest of Latin America)

Middle East and Africa (GCC Countries, South Africa, and the Rest of Middle East and Africa)

Fracking Fluid End Market Key Companies VP Sales & Manufacturing, Forum Energy Technologies Inc, Dragon Products Ltd, Gardner Denver Inc, Kerr Pumps, Halliburton Company, ST9 Gas & Oil LLC, The Weir Group PLC, TechnipFMC PLC, and Vulcan Industrial Holdings
Fracking Fluid End Market Competitive Landscape Market Share Analysis

Competitive Benchmarking

Key Players Market Positioning

Geographical Presence Analysis

Major Strategies Adopted

Key Highlights of the report

How are the major segments performing in the Fracking Fluid End Market?

  • The stainless-steel fluid end segment led the market in terms of material type in 2021 and is expected to continue throughout the projection period due to its supremacy in fluid materials. Stainless steel fluid ends are corrosion resistant, which means they can withstand corrosion damage caused by oxidization or other chemical reactions. Increased pumping hours are another reason this material type is expected to dominate the global market.
  • In 2021, the aftermarket end-user type segment accounted for the largest global market share. The lifespan of fracking fluid ends decreases as the fracking environment becomes harsher, more proppant is used, and pumping pressure rises, necessitating the replacement of fluid ends in conventional frac pumps. Fluid ends require replacement three to four times a year, whereas power ends last for two years.
  • The above 2500 horsepower segment is expected to grow faster during the forecast period, owing to a gradual shift in demand toward higher horsepower pumps to reduce the number of assets on site while extending part life. For instance, 20 units of 2500 HP frac pumps can be replaced by 11 units of 5000 HP fracking pumps.
  • The triplex design type segment dominated the global market in 2021. Fracking fluid ends compatible with triplex design types are gaining popularity, primarily to increase efficiency while reducing the number of pumps on-site and maintenance costs.

Which region dominated the fracking fluid end market?

North America dominated the global fracking fluid end market in 2021 and is expected to maintain its dominance throughout the forecast period. In particular, in the North American region, hydraulic fracturing is an unconventional method of extracting oil and gas. The fluids required for fracturing are introduced into the well using several regional pump manufacturers (18–20 pumps make up a fleet). One of the two components of this pump is the fluid end. The end market for fracking fluid benefits from adopting cutting-edge drilling techniques, such as horizontal drilling, in regional nations to recover oil and gas. The most recent advances in discovering new environmentally friendly fracking chemicals are anticipated to expand the regional market.

Design Element 2

Access crucial information at unmatched prices!

Request your free sample report today & start making informed decisions powered by Credence Research!

Download Free Sample
CTA Design Element 3

How is US Market Performing in the fracking fluid end market?

In 2021, the United States dominated the North American fracking fluid end market, and this trend is anticipated to hold throughout the forecast period. The low breakeven price and technological advancement in hydraulic fracturing have boosted demand for fracking fluids in the United States, the largest market. The country has seen a shift from vertical to horizontal drilling, with longer lateral lengths, more frac stages per well, and higher fracking fluid consumption per foot. In 2018, the number of horizontal wells in the United States reached 126,653, an increase of approximately 8.2% over the previous year. Continuing this trend, the country’s share of horizontally drilled wells reached 87% by the end of 2019. As a result, the increased emphasis on unconventional reserves to meet the rising demand for oil and gas is expected to fuel the fracking fluid end industry.

What is the competitive environment of the fracking fluid end market?

The global fracking fluid end market is highly competitive, with many players present. Companies that produce fracking fluids are forming alliances, joint ventures, and partnerships to expand their market share and meet shifting technological demands. For instance, Aker Solutions, a provider of oil services based in Norway, recently signed a contract to buy Reinertsen. Similarly, FMC Technologies Inc and Technip S.A. merged in 2017 to form TechnipFMC plc. The merger resulted in the formation of the world’s leading offshore energy services provider.

Executive Summary

What are technical developments being developed in the global fracking fluid end market?

The market has seen an increase in demand in recent years due to technological innovations to make fracking more productive and the use of various types of fracking liquid. The surge in international fracking technology investments and fractured good production boosted the market for fracking chemicals. Oil can be extracted more cheaply and effectively using the slickwater method. The slickwater process is being adopted as technology advances, and global demand for shale gas rises. This method allows for high-speed pumping, which improves hydrocarbon recovery rates. The need for such techniques will increase as global oil consumption increases, benefiting the companies involved in the fracking fluid end market. For instance, Gardener Denver Inc introduced GDNX, the next-generation fluid end technology, in 2018. The stainless-steel fluid end was created to extend the operational service life of fluid ends used in various applications, including coil tubing and hydraulic fracturing. The fluid end is designed to last 3.5 times longer than similar fluid ends currently on the market.

Which are the key investments by the fracking fluid end market players?

Major players in the fracking fluid end market are investing in research and development efforts and working to create environmentally friendly fracking fluids. The development of new products, such as non-toxic drilling fracking fluids and foams as alternatives to toxic oil-based fluid (OBF), which is difficult to extract from drill holes, is expected to drive industry growth. Fracking fluid contains many chemicals that can be used for several things, including delivering proppant to the shale formation, improving gel strength, viscosity fractures, and enlarging fractures. Established players such as Halliburton Company and Cargill Inc have begun to produce bio-based drill muds to diversify their product portfolio. Major players like Weir Group PLC, Gardner Denver Inc, and Halliburton Company have invested in and integrated their operations. They are involved in every fracking fluid value chain step, from production to distribution to final use. For instance, ST9 Gas + Oil introduced the XGen fluid end for frac and well delivery pumps in 2018. The company invested and developed this product to address the washout and fatigue issues seen in the fracking fluid end of the competitors.

Some major players in the fracking fluid end market are VP Sales & Manufacturing, Forum Energy Technologies Inc, Dragon Products Ltd, Gardner Denver Inc, Kerr Pumps, Halliburton Company, ST9 Gas & Oil LLC, The Weir Group PLC, TechnipFMC PLC, Vulcan Industrial Holdings.

What are the Major Driving Factors for the Fracking Fluid End Market?

The fracking fluid end market is driven by the global expansion of oil and gas exploration. Rising energy demand leads to increased fracking fluid end demand, which supports the global market. The rapidly changing trend of horizontal drilling for wells is expected to accelerate market growth for fracking fluids worldwide. Horizontal fracking necessitates more fracking fluids and chemicals than vertical drilling, which expands the market. Besides, horizontal drilling has a significantly lower environmental impact than vertical drilling. In addition, companies can extract a large amount of oil from a single horizontal well rather than drilling a dozen vertical wells. This helps oil and gas companies save money and time. These factors will likely provide the fracking fluid end market with lucrative growth opportunities.

What are the Major Risks for the Fracking Fluid End Market?

There have been numerous public concerns about water usage in areas with limited supply, contamination, and other environmental hazards caused by fracking. These concerns can be addressed by using and capitalizing on foam-based fluids. The public’s concern about the environmental effects of fracturing may be alleviated by using this alternative, which uses less water than conventional fracturing. Stringent laws against fracking fluids, the potential for backflow of water to contaminate surface and groundwater, and the growing demand for alternatives are hindering the growth of the global fracking fluid end market.

Which is the key material in the fracking fluid end market?

The stainless-steel fluid end segment is expected to maintain its dominance over the forecast period due to its corrosion resistance and higher pumping hours than the carbon steel fluid end. Fracking fluid ends are typically made of stainless steel. Stainless steel fluid ends have four times the life of carbon steel (150-450 hours) fluid end, based on the proppant and chemical used, as well as the hostile environment. Corrosion-resistant stainless-steel fluid ends can withstand corrosion damage brought on by oxidation or any other kind of chemical reaction. Another factor contributing to the expectation that this material type will dominate the global market is improved pumping hours.

How is the fracking fluid end market performing in regions?

North America is expected to retain the largest share of the fracking fluid end market throughout the forecast period, owing to the region’s tremendous technically recoverable shale oil and gas deposits and key fluid end manufacturers. The increased oil extraction in the United States will increase market demand, requiring frictional reducers and foam-based fluid to smooth the extraction process. Due to the high proportion of fractured hydraulic wells in the United States, major companies are investing in oil and gas exploration in the region. Baker Huge data estimates showed that active oil rigs in the United States increased from 7 to 356. These projections increase market demand as well as the drilling capacity in the region.

Furthermore, the Asia Pacific region is expected to have the highest revenue share in the global fracking fluid end market during the forecast period. Rising energy consumption and demand are expected to be major market growth drivers. Most oil and gas exploration and processing currently occurs in Australia, South Korea, China, and India. Due to the rising population, China and India are the top producers in the fracking fluid end market. India’s ongoing efforts to explore its shale gas reserves, which are dispersed across 56 sites, are helping to meet the country’s rising demand for shale gas. The government’s policy initiatives to permit fracking also set the market in the nation and region to display a strong position. The developed fracking market in China also contributes to favorable regional growth.

What is the regulatory landscape for the fracking fluid end market?

Every country has made concerted efforts to achieve energy independence and security. The fracking procedure necessitates the use of a large amount of water. However, the use of fracking methods is increasing significantly in areas with limited water supply. The use of foam-based liquids, which require less water and are less damaging to the environment than water-based liquids used in fracking fluid, has increased. Research and development efforts are also being made to find non-polluting liquids, which are expected to present lucrative opportunities for expanding the fracking fluid end market in the future. The adoption of natural gas by major countries is expected to create attractive opportunities for market participants. Germany, the Netherlands, and France are among the European nations that have called for legislation from the European Union (EU) to improve funding for low-carbon technologies. Several policies are being implemented to encourage the use of renewable energy.

What is the Market Size of the Fracking Fluid End regarding value?

The global fracking fluid end market is anticipated to grow at a substantial CAGR of 6% in the upcoming years. The global fracking fluid end industry is estimated to be worth USD 525.6 million in 2021 and is expected to be worth USD 745.57 million by 2028.

Shape Your Report to Specific Countries or Regions & Enjoy 30% Off!

What are the major players planning for the future of the fracking fluid end market?

Manufacturers and purchasers are planning to enter into long-term contracts with distribution companies to ensure consistent product supply. Stringent government regulations regarding the negative environmental impact of chemical use and disposal are expected to be a barrier to new entrants in the industry. Technological advances in fluid rheology modification for efficient extraction in various formations open lucrative growth opportunities for industry players. The rapid adoption of mud-cap drilling techniques and significant oilfield advancement in unconventional and offshore reserves are expected to open up new business opportunities for fracturing fluid end companies in the coming years.

Segmentation of Global Fracking Fluid End Market –

Global Fracking Fluid End Market – By Material Type

  • Carbon Steel Fluid End
  • Stainless-Steel Fluid End

Global Fracking Fluid End Market – By End-User Type

  • OE
  • Aftermarket

Global Fracking Fluid End Market – By Horsepower Type

  • 2000-2500 HP
  • Above 2500 HP

Global Fracking Fluid End Market – By Design Type

  • Triplex
  • Quintuplex

Global Fracking Fluid End Market – By Region

  • North America
    • US
    • Canada
  • Europe
    • Germany
    • France
    • UK.
    • Italy
    • Spain
    • Rest of Europe
  • Asia Pacific
    • China
    • Japan
    • India
    • South Korea
    • South-east Asia
    • Rest of Asia Pacific
  • Latin America
    • Brazil
    • Mexico
    • Rest of Latin America
  • Middle East & Africa
    • GCC Countries
    • South Africa
    • Rest of Middle East and Africa

1. Preface
1.1. Report Description
1.1.1. Purpose of the Report
1.1.2. Target Audience
1.1.3. USP and Key Offerings
1.2. Research Scope
1.3. Research Methodology
1.3.1. Phase I – Secondary Research
1.3.2. Phase II – Primary Research
1.3.3. Phase III – Expert Panel Review
1.3.4. Approach Adopted
1.3.4.1. Top-Down Approach
1.3.4.2. Bottom-Up Approach
1.3.5. Assumptions
1.4. Market Segmentation

2. Executive Summary
2.1. Market Snapshot: Global Fracking Fluid End Market
2.2. Global Fracking Fluid End Market, By Material Type
2.3. Global Fracking Fluid End Market, By End-User Type
2.4. Global Fracking Fluid End Market, By Horsepower Type
2.5. Global Fracking Fluid End Market, By Design Type
2.6. Global Fracking Fluid End Market, By Region

3. Market Dynamics & Factors Analysis
3.1. Introduction
3.1.1. Global Fracking Fluid End Market Value, 2016-2028, (US$ Bn)
3.2. Market Dynamics
3.2.1. Key Growth Trends
3.2.2. Market Drivers
3.2.3. Market Restraints
3.2.4. Market Opportunities
3.2.5. Major Industry Challenges
3.3. Attractive Investment Proposition,2021
3.3.1. Material Type
3.3.2. End-User Type
3.3.3. Horsepower Type
3.3.4. Design Type
3.3.5. Geography

4. Premium Insights
4.1. STAR (Situation, Task, Action, Results) Analysis
4.2. Porter’s Five Forces Analysis
4.2.1. Threat of New Entrants
4.2.2. Bargaining Power of Buyers/Consumers
4.2.3. Bargaining Power of Suppliers
4.2.4. Threat of Substitute Types
4.2.5. Intensity of Competitive Rivalry
4.3. Value Chain Analysis
4.4. Technology Analysis
4.5. Marketing Strategy Analysis
4.5.1. Direct Marketing
4.5.2. Indirect Marketing
4.5.3. Marketing Channel Development Trend

5. Market Positioning of Key Players, 2021
5.1. Company Market Share of Key Players, 2021
5.2. Competitive Benchmarking
5.3. Market Positioning of Key Vendors
5.4. Geographical Presence Analysis
5.5. Major Strategies Adopted by Key Players
5.5.1. Key Strategies Analysis
5.5.2. Mergers and Acquisitions
5.5.3. Partnerships
5.5.4. Product Launch
5.5.5. Geographical Expansion
5.5.6. Others

6. COVID-19 Impact Analysis
6.1. Global Fracking Fluid End Market Pre Vs Post COVID-19, 2019 – 2028
6.2. Impact on Import & Export
6.3. Impact on Demand & Supply

7. Global Fracking Fluid End Market
7.1. Global Fracking Fluid End Market, by Material Type, 2016-2028(US$ Bn)
7.1.1. Overview
7.1.2. Global Fracking Fluid End Market, By Material Type, 2021 vs 2028 (in%)
7.1.3. Global Fracking Fluid End Market, By Carbon Steel Fluid End, 2016-2028 (US$ Bn)
7.1.4. Global Fracking Fluid End Market, By Stainless-Steel Fluid End, 2016-2028 (US$ Bn)
7.2. Global Fracking Fluid End Market, by End-User Type, 2016-2028(US$ Bn)
7.2.1. Overview
7.2.2. Global Fracking Fluid End Market, By End-User Type, 2021 vs 2028 (in%)
7.2.3. Global Fracking Fluid End Market, By OE, 2016-2028 (US$ Bn)
7.2.4. Global Fracking Fluid End Market, By Aftermarket, 2016-2028 (US$ Bn)
7.3. Global Fracking Fluid End Market, by Horsepower Type, 2016-2028(US$ Bn)
7.3.1. Overview
7.3.2. Global Fracking Fluid End Market, By Horsepower Type, 2021 vs 2028 (in%)
7.3.3. Global Fracking Fluid End Market, By 2000-2500 HP, 2016-2028 (US$ Bn)
7.3.4. Global Fracking Fluid End Market, By Above 2500 HP, 2016-2028 (US$ Bn)
7.4. Global Fracking Fluid End Market, by Design Type, 2016-2028(US$ Bn)
7.4.1. Overview
7.4.2. Global Fracking Fluid End Market, By Design Type, 2021 vs 2028 (in%)
7.4.3. Global Fracking Fluid End Market, By Triplex, 2016-2028 (US$ Bn)
7.4.4. Global Fracking Fluid End Market, By Quintuplex, 2016-2028 (US$ Bn)

8. North America Fracking Fluid End Market Analysis
8.1. North America Fracking Fluid End Market, by Material Type, 2016-2028(US$ Bn)
8.1.1. Overview
8.1.2. SRC Analysis
8.2. North America Fracking Fluid End Market, by End-User Type, 2016-2028(US$ Bn)
8.2.1. Overview
8.2.2. SRC Analysis
8.3. North America Fracking Fluid End Market, by Horsepower Type, 2016-2028(US$ Bn)
8.3.1. Overview
8.3.2. SRC Analysis
8.4. North America Fracking Fluid End Market, by Design Type, 2016-2028(US$ Bn)
8.4.1. Overview
8.4.2. SRC Analysis
8.5. North America Fracking Fluid End Market, by Country, 2016-2028 (US$ Bn)
8.5.1. U.S.
8.5.1.1. U.S. Fracking Fluid End Market Estimates and Forecast, 2016-2028 (US$ Bn)
8.5.1.2. U.S. Fracking Fluid End Market, By Material Type, 2016-2028 (US$ Bn)
8.5.1.3. U.S. Fracking Fluid End Market, By End-User Type, 2016-2028 (US$ Bn)
8.5.1.4. U.S. Fracking Fluid End Market, By Horsepower Type, 2016-2028 (US$ Bn)
8.5.1.5. U.S. Fracking Fluid End Market, By Design Type, 2016-2028 (US$ Bn)
8.5.2. Canada
8.5.2.1. Canada Fracking Fluid End Market Estimates and Forecast, 2016-2028 (US$ Bn)
8.5.2.2. Canada Fracking Fluid End Markets, By Material Type, 2016-2028 (US$ Bn)
8.5.2.3. Canada Fracking Fluid End Market, By End-User Type, 2016-2028 (US$ Bn)
8.5.2.4. Canada Fracking Fluid End Market, By Horsepower Type, 2016-2028 (US$ Bn)
8.5.2.5. Canada Fracking Fluid End Market, By Design Type, 2016-2028 (US$ Bn)

9. Europe Fracking Fluid End Market Analysis
9.1. Europe Fracking Fluid End Market, by Material Type, 2016-2028(US$ Bn)
9.1.1. Overview
9.1.2. SRC Analysis
9.2. Europe Fracking Fluid End Market, by End-User Type, 2016-2028(US$ Bn)
9.2.1. Overview
9.2.2. SRC Analysis
9.3. Europe Fracking Fluid End Market, by Horsepower Type, 2016-2028(US$ Bn)
9.3.1. Overview
9.3.2. SRC Analysis
9.4. Europe Fracking Fluid End Market, by Design Type, 2016-2028(US$ Bn)
9.4.1. Overview
9.4.2. SRC Analysis
9.5. Europe Fracking Fluid End Market, by Country, 2016-2028 (US$ Bn)
9.5.1. Germany
9.5.1.1. Germany Fracking Fluid End Market Estimates and Forecast, 2016-2028 (US$ Bn)
9.5.1.2. Germany Fracking Fluid End Market, By Material Type, 2016-2028 (US$ Bn)
9.5.1.3. Germany Fracking Fluid End Market, By End-User Type, 2016-2028 (US$ Bn)
9.5.1.4. Germany Fracking Fluid End Market, By Horsepower Type, 2016-2028 (US$ Bn)
9.5.1.5. Germany Fracking Fluid End Market, By Design Type, 2016-2028 (US$ Bn)
9.5.2. France
9.5.2.1. France Fracking Fluid End Market Estimates and Forecast, 2016-2028 (US$ Bn)
9.5.2.2. France Fracking Fluid End Market, By Material Type, 2016-2028 (US$ Bn)
9.5.2.3. France Fracking Fluid End Market, By End-User Type, 2016-2028 (US$ Bn)
9.5.2.4. France Fracking Fluid End Market, By Horsepower Type, 2016-2028 (US$ Bn)
9.5.2.5. France Fracking Fluid End Market, By Design Type, 2016-2028 (US$ Bn)
9.5.3. UK
9.5.3.1. UK Fracking Fluid End Market Estimates and Forecast, 2016-2028 (US$ Bn)
9.5.3.2. UK Fracking Fluid End Market, By Material Type, 2016-2028 (US$ Bn)
9.5.3.3. UK Fracking Fluid End Market, By End-User Type, 2016-2028 (US$ Bn)
9.5.3.4. UK Fracking Fluid End Market, By Horsepower Type, 2016-2028 (US$ Bn)
9.5.3.5. UK Fracking Fluid End Market, By Design Type, 2016-2028 (US$ Bn)
9.5.4. Italy
9.5.4.1. Italy Fracking Fluid End Market Estimates and Forecast, 2016-2028 (US$ Bn)
9.5.4.2. Italy Fracking Fluid End Market, By Material Type, 2016-2028 (US$ Bn)
9.5.4.3. Italy Fracking Fluid End Market, By End-User Type, 2016-2028 (US$ Bn)
9.5.4.4. Italy Fracking Fluid End Market, By Horsepower Type, 2016-2028 (US$ Bn)
9.5.4.5. Italy Fracking Fluid End Market, By Design Type, 2016-2028 (US$ Bn)
9.5.5. Spain
9.5.5.1. Spain Fracking Fluid End Market Estimates and Forecast, 2016-2028 (US$ Bn)
9.5.5.2. Spain Fracking Fluid End Market, By Material Type, 2016-2028 (US$ Bn)
9.5.5.3. Spain Fracking Fluid End Market, By End-User Type, 2016-2028 (US$ Bn)
9.5.5.4. Spain Fracking Fluid End Market, By Horsepower Type, 2016-2028 (US$ Bn)
9.5.5.5. Spain Fracking Fluid End Market, By Design Type, 2016-2028 (US$ Bn)
9.5.6. Rest of Europe
9.5.6.1. Rest of Europe Fracking Fluid End Market Estimates and Forecast, 2016-2028 (US$ Bn)
9.5.6.2. Rest of Europe Fracking Fluid End Market, By Material Type, 2016-2028 (US$ Bn)
9.5.6.3. Rest of Europe Fracking Fluid End Market, By End-User Type, 2016-2028 (US$ Bn)
9.5.6.4. Rest of Europe Fracking Fluid End Market, By Horsepower Type, 2016-2028 (US$ Bn)
9.5.6.5. Rest of Europe Fracking Fluid End Market, By Design Type, 2016-2028 (US$ Bn)

10. Asia Pacific Fracking Fluid End Market Analysis
10.1. Asia Pacific Fracking Fluid End Market, by Material Type, 2016-2028(US$ Bn)
10.1.1. Overview
10.1.2. SRC Analysis
10.2. Asia Pacific Fracking Fluid End Market, by End-User Type, 2016-2028(US$ Bn)
10.2.1. Overview
10.2.2. SRC Analysis
10.3. Asia Pacific Fracking Fluid End Market, by Horsepower Type, 2016-2028(US$ Bn)
10.3.1. Overview
10.3.2. SRC Analysis
10.4. Asia Pacific Fracking Fluid End Market, by Design Type, 2016-2028(US$ Bn)
10.4.1. Overview
10.4.2. SRC Analysis
10.5. Asia Pacific Fracking Fluid End Market, by Country, 2016-2028 (US$ Bn)
10.5.1. China
10.5.1.1. China Fracking Fluid End Market Estimates and Forecast, 2016-2028 (US$ Bn)
10.5.1.2. China Fracking Fluid End Market, By Material Type, 2016-2028 (US$ Bn)
10.5.1.3. China Fracking Fluid End Market, By End-User Type, 2016-2028 (US$ Bn)
10.5.1.4. China Fracking Fluid End Market, By Horsepower Type, 2016-2028 (US$ Bn)
10.5.1.5. China Fracking Fluid End Market, By Design Type, 2016-2028 (US$ Bn)
10.5.2. Japan
10.5.2.1. Japan Fracking Fluid End Market Estimates and Forecast, 2016-2028 (US$ Bn)
10.5.2.2. Japan Fracking Fluid End Market, By Material Type, 2016-2028 (US$ Bn)
10.5.2.3. Japan Fracking Fluid End Market, By End-User Type, 2016-2028 (US$ Bn)
10.5.2.4. Japan Fracking Fluid End Market, By Horsepower Type, 2016-2028 (US$ Bn)
10.5.2.5. Japan Fracking Fluid End Market, By Design Type, 2016-2028 (US$ Bn)
10.5.3. India
10.5.3.1. India Fracking Fluid End Market Estimates and Forecast, 2016-2028 (US$ Bn)
10.5.3.2. India Fracking Fluid End Market, By Material Type, 2016-2028 (US$ Bn)
10.5.3.3. India Fracking Fluid End Market, By End-User Type, 2016-2028 (US$ Bn)
10.5.3.4. India Fracking Fluid End Market, By Horsepower Type, 2016-2028 (US$ Bn)
10.5.3.5. India Fracking Fluid End Market, By Design Type, 2016-2028 (US$ Bn)
10.5.4. South Korea
10.5.4.1. South Korea Fracking Fluid End Market Estimates and Forecast, 2016-2028 (US$ Bn)
10.5.4.2. South Korea Fracking Fluid End Market, By Material Type, 2016-2028 (US$ Bn)
10.5.4.3. South Korea Fracking Fluid End Market, By End-User Type, 2016-2028 (US$ Bn)
10.5.4.4. South Korea Fracking Fluid End Market, By Horsepower Type, 2016-2028 (US$ Bn)
10.5.4.5. South Korea Fracking Fluid End Market, By Design Type, 2016-2028 (US$ Bn)
10.5.5. South-East Asia
10.5.5.1. South-East Asia Fracking Fluid End Market Estimates and Forecast, 2016-2028 (US$ Bn)
10.5.5.2. South-East Asia Fracking Fluid End Market, By Material Type, 2016-2028 (US$ Bn)
10.5.5.3. South-East Asia Fracking Fluid End Market, By End-User Type, 2016-2028 (US$ Bn)
10.5.5.4. South-East Asia Fracking Fluid End Market, By Horsepower Type, 2016-2028 (US$ Bn)
10.5.5.5. South-East Asia Fracking Fluid End Market, By Design Type, 2016-2028 (US$ Bn)
10.5.6. Rest of Asia Pacific
10.5.6.1. Rest of Asia Pacific Fracking Fluid End Market Estimates and Forecast, 2016-2028 (US$ Bn)
10.5.6.2. Rest of Asia Pacific Fracking Fluid End Market, By Material Type, 2016-2028 (US$ Bn)
10.5.6.3. Rest of Asia Pacific Fracking Fluid End Market, By End-User Type, 2016-2028 (US$ Bn)
10.5.6.4. Rest of Asia Pacific Fracking Fluid End Market, By Horsepower Type, 2016-2028 (US$ Bn)
10.5.6.5. Rest of Asia Pacific Fracking Fluid End Market, By Design Type, 2016-2028 (US$ Bn)

11. Latin America Fracking Fluid End Market Analysis
11.1. Latin America Fracking Fluid End Market, by Material Type, 2016-2028(US$ Bn)
11.1.1. Overview
11.1.2. SRC Analysis
11.2. Latin America Fracking Fluid End Market, by End-User Type, 2016-2028(US$ Bn)
11.2.1. Overview
11.2.2. SRC Analysis
11.3. Latin America Fracking Fluid End Market, by Horsepower Type, 2016-2028(US$ Bn)
11.3.1. Overview
11.3.2. SRC Analysis
11.4. Latin America Fracking Fluid End Market, by Design Type, 2016-2028(US$ Bn)
11.4.1. Overview
11.4.2. SRC Analysis
11.5. Latin America Fracking Fluid End Market, by Country, 2016-2028 (US$ Bn)
11.5.1. Brazil
11.5.1.1. Brazil Fracking Fluid End Market Estimates and Forecast, 2016-2028 (US$ Bn)
11.5.1.2. Brazil Fracking Fluid End Market, By Material Type, 2016-2028 (US$ Bn)
11.5.1.3. Brazil Fracking Fluid End Market, By End-User Type, 2016-2028 (US$ Bn)
11.5.1.4. Brazil Fracking Fluid End Market, By Horsepower Type, 2016-2028 (US$ Bn)
11.5.1.5. Brazil Fracking Fluid End Market, By Design Type, 2016-2028 (US$ Bn)
11.5.2. Mexico
11.5.2.1. Mexico Fracking Fluid End Market Estimates and Forecast, 2016-2028 (US$ Bn)
11.5.2.2. Mexico Fracking Fluid End Market, By Material Type, 2016-2028 (US$ Bn)
11.5.2.3. Mexico Fracking Fluid End Market, By End-User Type, 2016-2028 (US$ Bn)
11.5.2.4. Mexico Fracking Fluid End Market, By Horsepower Type, 2016-2028 (US$ Bn)
11.5.2.5. Mexico Fracking Fluid End Market, By Design Type, 2016-2028 (US$ Bn)
11.5.3. Rest of Latin America
11.5.3.1. Rest of Latin America Fracking Fluid End Market Estimates and Forecast, 2016-2028 (US$ Bn)
11.5.3.2. Rest of Latin America Fracking Fluid End Market, By Material Type, 2016-2028 (US$ Bn)
11.5.3.3. Rest of Latin America Fracking Fluid End Market, By End-User Type, 2016-2028 (US$ Bn)
11.5.3.4. Rest of Latin America Fracking Fluid End Market, By Horsepower Type, 2016-2028 (US$ Bn)
11.5.3.5. Rest of Latin America Fracking Fluid End Market, By Design Type, 2016-2028 (US$ Bn)

12. Middle East and Africa Fracking Fluid End Market Analysis
12.1. Middle East and Africa Fracking Fluid End Market, by Material Type, 2016-2028(US$ Bn)
12.1.1. Overview
12.1.2. SRC Analysis
12.2. Middle East and Africa Fracking Fluid End Market, by End-User Type, 2016-2028(US$ Bn)
12.2.1. Overview
12.2.2. SRC Analysis
12.3. Middle East and Africa Fracking Fluid End Market, by Horsepower Type, 2016-2028(US$ Bn)
12.3.1. Overview
12.3.2. SRC Analysis
12.4. Middle East and Africa Fracking Fluid End Market, by Design Type, 2016-2028(US$ Bn)
12.4.1. Overview
12.4.2. SRC Analysis
12.5. Middle East and Africa Fracking Fluid End Market, by Country, 2016-2028 (US$ Bn)
12.5.1. GCC Countries
12.5.1.1. GCC Countries Fracking Fluid End Market Estimates and Forecast, 2016-2028 (US$ Bn)
12.5.1.2. GCC Countries Fracking Fluid End Market, By Material Type, 2016-2028 (US$ Bn)
12.5.1.3. GCC Countries Fracking Fluid End Market, By End-User Type, 2016-2028 (US$ Bn)
12.5.1.4. GCC Countries Fracking Fluid End Market, By Horsepower Type, 2016-2028 (US$ Bn)
12.5.1.5. GCC Countries Fracking Fluid End Market, By Design Type, 2016-2028 (US$ Bn)
12.5.2. South Africa
12.5.2.1. South Africa Fracking Fluid End Market Estimates and Forecast, 2016-2028 (US$ Bn)
12.5.2.2. South Africa Fracking Fluid End Market, By Material Type, 2016-2028 (US$ Bn)
12.5.2.3. South Africa Fracking Fluid End Market, By End-User Type, 2016-2028 (US$ Bn)
12.5.2.4. South Africa Fracking Fluid End Market, By Horsepower Type, 2016-2028 (US$ Bn)
12.5.2.5. South Africa Fracking Fluid End Market, By Design Type, 2016-2028 (US$ Bn)
12.5.3. Rest of Middle East and Africa
12.5.3.1. Rest of Middle East and Africa Fracking Fluid End Market Estimates and Forecast, 2016-2028 (US$ Bn)
12.5.3.2. Rest of Middle East and Africa Fracking Fluid End Market, By Material Type, 2016-2028 (US$ Bn)
12.5.3.3. Rest of Middle East and Africa Fracking Fluid End Market, By End-User Type, 2016-2028 (US$ Bn)
12.5.3.4. Rest of Middle East and Africa Fracking Fluid End Market, By Horsepower Type, 2016-2028 (US$ Bn)
12.5.3.5. Rest of Middle East and Africa Fracking Fluid End Market, By Design Type, 2016-2028 (US$ Bn)

13. Company Profiles
13.1. VP Sales & Manufacturing
13.1.1. Company Overview
13.1.2. Products/Services Portfolio
13.1.3. Geographical Presence
13.1.4. Financial Summary
13.1.4.1. Market Revenue and Net Profit (2019-2021)
13.1.4.2. Business Segment Revenue Analysis
13.1.4.3. Geographical Revenue Analysis
13.2. Forum Energy Technologies Inc
13.3. Dragon Products Ltd
13.4. Gardner Denver Inc
13.5. Kerr Pumps
13.6. Halliburton Company
13.7. ST9 Gas & Oil LLC
13.8. The Weir Group PLC
13.9. TechnipFMC PLC
13.10. Vulcan Industrial Holdings

List of Figures

FIG. 1 Global Fracking Fluid End Market: Research Methodology
FIG. 2 Market Size Estimation – Top Down & Bottom up Approach
FIG. 3 Global Fracking Fluid End Market Segmentation
FIG. 4 Global Fracking Fluid End Market, by Material Type, 2021 (US$ Bn)
FIG. 5 Global Fracking Fluid End Market, by End-User Type, 2021 (US$ Bn)
FIG. 6 Global Fracking Fluid End Market, by Horsepower Type, 2021 (US$ Bn)
FIG. 7 Global Fracking Fluid End Market, by Design Type, 2021 (US$ Bn)
FIG. 8 Global Fracking Fluid End Market, by Geography, 2021 (US$ Bn)
FIG. 9 Attractive Investment Proposition, by Material Type, 2021
FIG. 10 Attractive Investment Proposition, by End-User Type, 2021
FIG. 11 Attractive Investment Proposition, by Horsepower Type, 2021
FIG. 12 Attractive Investment Proposition, by Design Type, 2021
FIG. 13 Attractive Investment Proposition, by Geography, 2021
FIG. 14 Global Market Share Analysis of Key Fracking Fluid End Market Manufacturers, 2021
FIG. 15 Global Market Positioning of Key Fracking Fluid End Market Manufacturers, 2021
FIG. 16 Global Fracking Fluid End Market Value Contribution, By Material Type, 2021 & 2028 (Value %)
FIG. 17 Global Fracking Fluid End Market, by Carbon Steel Fluid End, Value, 2016-2028 (US$ Bn)
FIG. 18 Global Fracking Fluid End Market, by Stainless-Steel Fluid End, Value, 2016-2028 (US$ Bn)
FIG. 19 Global Fracking Fluid End Market Value Contribution, By End-User Type, 2021 & 2028 (Value %)
FIG. 20 Global Fracking Fluid End Market, by OE, Value, 2016-2028 (US$ Bn)
FIG. 21 Global Fracking Fluid End Market, by Aftermarket, Value, 2016-2028 (US$ Bn)
FIG. 22 Global Fracking Fluid End Market Value Contribution, By Horsepower Type, 2021 & 2028 (Value %)
FIG. 23 Global Fracking Fluid End Market, by 2000-2500 HP, Value, 2016-2028 (US$ Bn)
FIG. 24 Global Fracking Fluid End Market, by Above 2500 HP, Value, 2016-2028 (US$ Bn)
FIG. 25 Global Fracking Fluid End Market Value Contribution, By Design Type, 2021 & 2028 (Value %)
FIG. 26 Global Fracking Fluid End Market, by Triplex, Value, 2016-2028 (US$ Bn)
FIG. 27 Global Fracking Fluid End Market, by Quintuplex, Value, 2016-2028 (US$ Bn)
FIG. 28 U.S. Fracking Fluid End Market, 2016-2028 (US$ Bn)
FIG. 29 Canada Fracking Fluid End Market, 2016-2028 (US$ Bn)
FIG. 30 Germany Fracking Fluid End Market, 2016-2028 (US$ Bn)
FIG. 31 France Fracking Fluid End Market, 2016-2028 (US$ Bn)
FIG. 32 U.K. Fracking Fluid End Market, 2016-2028 (US$ Bn)
FIG. 33 Italy Fracking Fluid End Market, 2016-2028 (US$ Bn)
FIG. 34 Spain Fracking Fluid End Market, 2016-2028 (US$ Bn)
FIG. 35 Rest of Europe Fracking Fluid End Market, 2016-2028 (US$ Bn)
FIG. 36 China Fracking Fluid End Market, 2016-2028 (US$ Bn)
FIG. 37 Japan Fracking Fluid End Market, 2016-2028 (US$ Bn)
FIG. 38 India Fracking Fluid End Market, 2016-2028 (US$ Bn)
FIG. 39 South Korea Fracking Fluid End Market, 2016-2028 (US$ Bn)
FIG. 40 Southeast Asia Fracking Fluid End Market, 2016-2028 (US$ Bn)
FIG. 41 Rest of Asia Pacific Fracking Fluid End Market, 2016-2028 (US$ Bn)
FIG. 42 Latin America Fracking Fluid End Market, 2016-2028 (US$ Bn)
FIG. 43 Brazil Fracking Fluid End Market, 2016-2028 (US$ Bn)
FIG. 44 Mexico Fracking Fluid End Market, 2016-2028 (US$ Bn)
FIG. 45 Rest of Latin America Fracking Fluid End Market, 2016-2028 (US$ Bn)
FIG. 46 Middle East & Africa Fracking Fluid End Market, 2016-2028 (US$ Bn)
FIG. 47 GCC Countries Fracking Fluid End Market, 2016-2028 (US$ Bn)
FIG. 48 South Africa Fracking Fluid End Market, 2016-2028 (US$ Bn)
FIG. 49 Rest of Middle East and Africa Fracking Fluid End Market, 2016-2028 (US$ Bn)

List of Tables

TABLE 1 Market Snapshot: Global Fracking Fluid End Market
TABLE 2 Global Fracking Fluid End Market, by Competitive Benchmarking, 2021
TABLE 3 Global Fracking Fluid End Market, by Geographical Presence Analysis, 2021
TABLE 4 Global Fracking Fluid End Market, by Key Strategies Analysis, 2021
TABLE 5 Global Fracking Fluid End Market, by Material Type, 2016-2028 (US$ Bn)
TABLE 6 Global Fracking Fluid End Market, by End-User Type, 2016-2028 (US$ Bn)
TABLE 7 Global Fracking Fluid End Market, by Horsepower Type, 2016-2028 (US$ Bn)
TABLE 8 Global Fracking Fluid End Market, by Design Type, 2016-2028 (US$ Bn)
TABLE 9 Global Fracking Fluid End Market, by Geography, 2016-2028 (US$ Bn)
TABLE 10 North America Fracking Fluid End Market, by Material Type, 2016-2028 (US$ Bn)
TABLE 11 North America Fracking Fluid End Market, by End-User Type, 2016-2028 (US$ Bn)
TABLE 12 North America Fracking Fluid End Market, by Horsepower Type, 2016-2028 (US$ Bn)
TABLE 13 North America Fracking Fluid End Market, by Design Type, 2016-2028 (US$ Bn)
TABLE 14 North America Fracking Fluid End Market, by Country, 2016-2028 (US$ Bn)
TABLE 15 US Fracking Fluid End Market, by Material Type, 2016-2028 (US$ Bn)
TABLE 16 US Fracking Fluid End Market, by End-User Type, 2016-2028 (US$ Bn)
TABLE 17 US Fracking Fluid End Market, by Horsepower Type, 2016-2028 (US$ Bn)
TABLE 18 US Fracking Fluid End Market, by Design Type, 2016-2028 (US$ Bn)
TABLE 19 Canada Fracking Fluid End Market, by Material Type, 2016-2028 (US$ Bn)
TABLE 20 Canada Fracking Fluid End Market, by End-User Type, 2016-2028 (US$ Bn)
TABLE 21 Canada Fracking Fluid End Market, by Horsepower Type, 2016-2028 (US$ Bn)
TABLE 22 Canada Fracking Fluid End Market, by Design Type, 2016-2028 (US$ Bn)
TABLE 23 Europe Fracking Fluid End Market, by Material Type, 2016-2028 (US$ Bn)
TABLE 24 Europe Fracking Fluid End Market, by End-User Type, 2016-2028 (US$ Bn)
TABLE 25 Europe Fracking Fluid End Market, by Horsepower Type, 2016-2028 (US$ Bn)
TABLE 26 Europe Fracking Fluid End Market, by Design Type, 2016-2028 (US$ Bn)
TABLE 27 Europe Fracking Fluid End Market, by Country, 2016-2028 (US$ Bn)
TABLE 28 Germany Fracking Fluid End Market, by Material Type, 2016-2028 (US$ Bn)
TABLE 29 Germany Fracking Fluid End Market, by End-User Type, 2016-2028 (US$ Bn)
TABLE 30 Germany Fracking Fluid End Market, by Horsepower Type, 2016-2028 (US$ Bn)
TABLE 31 Germany Fracking Fluid End Market, by Design Type, 2016-2028 (US$ Bn)
TABLE 32 France Fracking Fluid End Market, by Material Type, 2016-2028 (US$ Bn)
TABLE 33 France Fracking Fluid End Market, by End-User Type, 2016-2028 (US$ Bn)
TABLE 34 France Fracking Fluid End Market, by Horsepower Type, 2016-2028 (US$ Bn)
TABLE 35 France Fracking Fluid End Market, by Design Type, 2016-2028 (US$ Bn)
TABLE 36 UK Fracking Fluid End Market, by Material Type, 2016-2028 (US$ Bn)
TABLE 37 UK Fracking Fluid End Market, by End-User Type, 2016-2028 (US$ Bn)
TABLE 38 UK Fracking Fluid End Market, by Horsepower Type, 2016-2028 (US$ Bn)
TABLE 39 UK Fracking Fluid End Market, by Design Type, 2016-2028 (US$ Bn)
TABLE 40 Italy Fracking Fluid End Market, by Material Type, 2016-2028 (US$ Bn)
TABLE 41 Italy Fracking Fluid End Market, by End-User Type, 2016-2028 (US$ Bn)
TABLE 42 Italy Fracking Fluid End Market, by Horsepower Type, 2016-2028 (US$ Bn)
TABLE 43 Italy Fracking Fluid End Market, by Design Type, 2016-2028 (US$ Bn)
TABLE 44 Spain Fracking Fluid End Market, by Material Type, 2016-2028 (US$ Bn)
TABLE 45 Spain Fracking Fluid End Market, by End-User Type, 2016-2028 (US$ Bn)
TABLE 46 Spain Fracking Fluid End Market, by Horsepower Type, 2016-2028 (US$ Bn)
TABLE 47 Spain Fracking Fluid End Market, by Design Type, 2016-2028 (US$ Bn)
TABLE 48 Rest of Europe Fracking Fluid End Market, by Material Type, 2016-2028 (US$ Bn)
TABLE 49 Rest of Europe Fracking Fluid End Market, by End-User Type, 2016-2028 (US$ Bn)
TABLE 50 Rest of Europe Fracking Fluid End Market, by Horsepower Type, 2016-2028 (US$ Bn)
TABLE 51 Rest of Europe Fracking Fluid End Market, by Design Type, 2016-2028 (US$ Bn)
TABLE 52 Asia Pacific Fracking Fluid End Market, by Material Type, 2016-2028 (US$ Bn)
TABLE 53 Asia Pacific Fracking Fluid End Market, by End-User Type, 2016-2028 (US$ Bn)
TABLE 54 Asia Pacific Fracking Fluid End Market, by Horsepower Type, 2016-2028 (US$ Bn)
TABLE 55 Asia Pacific Fracking Fluid End Market, by Design Type, 2016-2028 (US$ Bn)
TABLE 56 Asia Pacific Fracking Fluid End Market, by Country, 2016-2028 (US$ Bn)
TABLE 57 China Fracking Fluid End Market, by Material Type, 2016-2028 (US$ Bn)
TABLE 58 China Fracking Fluid End Market, by End-User Type, 2016-2028 (US$ Bn)
TABLE 59 China Fracking Fluid End Market, by Horsepower Type, 2016-2028 (US$ Bn)
TABLE 60 China Fracking Fluid End Market, by Design Type, 2016-2028 (US$ Bn)
TABLE 61 Japan Fracking Fluid End Market, by Material Type, 2016-2028 (US$ Bn)
TABLE 62 Japan Fracking Fluid End Market, by End-User Type, 2016-2028 (US$ Bn)
TABLE 63 Japan Fracking Fluid End Market, by Horsepower Type, 2016-2028 (US$ Bn)
TABLE 64 Japan Fracking Fluid End Market, by Design Type, 2016-2028 (US$ Bn)
TABLE 65 India Fracking Fluid End Market, by Material Type, 2016-2028 (US$ Bn)
TABLE 66 India Fracking Fluid End Market, by End-User Type, 2016-2028 (US$ Bn)
TABLE 67 India Fracking Fluid End Market, by Horsepower Type, 2016-2028 (US$ Bn)
TABLE 68 India Fracking Fluid End Market, by Design Type, 2016-2028 (US$ Bn)
TABLE 69 South Korea Fracking Fluid End Market, by Material Type, 2016-2028 (US$ Bn)
TABLE 70 South Korea Fracking Fluid End Market, by End-User Type, 2016-2028 (US$ Bn)
TABLE 71 South Korea Fracking Fluid End Market, by Horsepower Type, 2016-2028 (US$ Bn)
TABLE 72 South Korea Fracking Fluid End Market, by Design Type, 2016-2028 (US$ Bn)
TABLE 73 South East Asia Fracking Fluid End Market, by Material Type, 2016-2028 (US$ Bn)
TABLE 74 South East Asia Fracking Fluid End Market, by End-User Type, 2016-2028 (US$ Bn)
TABLE 75 South East Asia Fracking Fluid End Market, by Horsepower Type, 2016-2028 (US$ Bn)
TABLE 76 South East Asia Fracking Fluid End Market, by Design Type, 2016-2028 (US$ Bn)
TABLE 77 Rest of Asia Pacific Fracking Fluid End Market, by Material Type, 2016-2028 (US$ Bn)
TABLE 78 Rest of Asia Pacific Fracking Fluid End Market, by End-User Type, 2016-2028 (US$ Bn)
TABLE 79 Rest of Asia Pacific Fracking Fluid End Market, by Horsepower Type, 2016-2028 (US$ Bn)
TABLE 80 Rest of Asia Pacific Fracking Fluid End Market, by Design Type, 2016-2028 (US$ Bn)
TABLE 81 Latin America Fracking Fluid End Market, by Material Type, 2016-2028 (US$ Bn)
TABLE 82 Latin America Fracking Fluid End Market, by End-User Type, 2016-2028 (US$ Bn)
TABLE 83 Latin America Fracking Fluid End Market, by Horsepower Type, 2016-2028 (US$ Bn)
TABLE 84 Latin America Fracking Fluid End Market, by Design Type, 2016-2028 (US$ Bn)
TABLE 85 Latin America Fracking Fluid End Market, by Country, 2016-2028 (US$ Bn)
TABLE 86 Brazil Fracking Fluid End Market, by Material Type, 2016-2028 (US$ Bn)
TABLE 87 Brazil Fracking Fluid End Market, by End-User Type, 2016-2028 (US$ Bn)
TABLE 88 Brazil Fracking Fluid End Market, by Horsepower Type, 2016-2028 (US$ Bn)
TABLE 89 Brazil Fracking Fluid End Market, by Design Type, 2016-2028 (US$ Bn)
TABLE 90 Mexico Fracking Fluid End Market, by Material Type, 2016-2028 (US$ Bn)
TABLE 91 Mexico Fracking Fluid End Market, by End-User Type, 2016-2028 (US$ Bn)
TABLE 92 Mexico Fracking Fluid End Market, by Horsepower Type, 2016-2028 (US$ Bn)
TABLE 93 Mexico Fracking Fluid End Market, by Design Type, 2016-2028 (US$ Bn)
TABLE 94 Rest of Latin America Fracking Fluid End Market, by Material Type, 2016-2028 (US$ Bn)
TABLE 95 Rest of Latin America Fracking Fluid End Market, by End-User Type, 2016-2028 (US$ Bn)
TABLE 96 Rest of Latin America Fracking Fluid End Market, by Horsepower Type, 2016-2028 (US$ Bn)
TABLE 97 Rest of Latin America Fracking Fluid End Market, by Design Type, 2016-2028 (US$ Bn)
TABLE 98 Middle East and Africa Fracking Fluid End Market, by Material Type, 2016-2028 (US$ Bn)
TABLE 99 Middle East and Africa Fracking Fluid End Market, by End-User Type, 2016-2028 (US$ Bn)
TABLE 100 Middle East and Africa Fracking Fluid End Market, by Horsepower Type, 2016-2028 (US$ Bn)
TABLE 101 Middle East and Africa Fracking Fluid End Market, by Design Type, 2016-2028 (US$ Bn)
TABLE 102 Middle East and Africa Fracking Fluid End Market, by Country, 2016-2028 (US$ Bn)
TABLE 103 GCC Countries Fracking Fluid End Market, by Material Type, 2016-2028 (US$ Bn)
TABLE 104 GCC Countries Fracking Fluid End Market, by End-User Type, 2016-2028 (US$ Bn)
TABLE 105 GCC Countries Fracking Fluid End Market, by Horsepower Type, 2016-2028 (US$ Bn)
TABLE 106 GCC Countries Fracking Fluid End Market, by Design Type, 2016-2028 (US$ Bn)
TABLE 107 South Africa Fracking Fluid End Market, by Material Type, 2016-2028 (US$ Bn)
TABLE 108 South Africa Fracking Fluid End Market, by End-User Type, 2016-2028 (US$ Bn)
TABLE 109 South Africa Fracking Fluid End Market, by Horsepower Type, 2016-2028 (US$ Bn)
TABLE 110 South Africa Fracking Fluid End Market, by Design Type, 2016-2028 (US$ Bn)
TABLE 111 Rest of Middle East and Africa Fracking Fluid End Market, by Material Type, 2016-2028 (US$ Bn)
TABLE 112 Rest of Middle East and Africa Fracking Fluid End Market, by End-User Type, 2016-2028 (US$ Bn)
TABLE 113 Rest of Middle East and Africa Fracking Fluid End Market, by Horsepower Type, 2016-2028 (US$ Bn)
TABLE 114 Rest of Middle East and Africa Fracking Fluid End Market, by Design Type, 2016-2028 (US$ Bn)

Frequently Asked Questions

How does COVID-19 impact the global fracking fluid end market?

The onset of the COVID-19 pandemic has had a global impact on economies worldwide. The limitations imposed by lockdowns led to a halt in oil production and drilling activities, which had a detrimental effect on the fracking fluid end market.

Which is the leading region of the market for the fracking fluid end?

North America accounted for the most heightened share in the global fracking fluid end market.

What are the key drivers for the growth of the fracking fluid end market?

The global expansion of oil and gas exploration drives the fracking fluid end market. The rapidly evolving trend of drilling wells toward horizontal drilling is anticipated to boost global market growth for the fracking fluid end.

Which is the major segment in the fracking fluid end market by material type?

The stainless-steel fluid end segment had a major share in the global market in 2021.

Which is the major segment in the fracking fluid end market by horsepower type?

The above 2500 HP segment had a major share in the global market.

Airless Tires Market

Published:
Report ID: 1175

Singapore Electric Vehicle (EV) Market

Published:
Report ID: 35964

Asia Pacific Automotive Infotainment Systems Market

Published:
Report ID: 35958

Peer-To-Peer Electric Vehicle Charging Market

Published:
Report ID: 9059

Japan Tire Market

Published:
Report ID: 32634

Automotive Steel Wheels Market

Published:
Report ID: 35559

Automotive Alloy Wheels Market

Published:
Report ID: 35549

Automotive Active Safety System Market

Published:
Report ID: 35497

Driving Apparel Market

Published:
Report ID: 35443

Automotive Air Filters Market

Published:
Report ID: 16439

Personal Watercraft (PWC) Market

Published:
Report ID: 34935

X-ray Tire Inspection System Market

Published:
Report ID: 9315

Purchase Options

$2999
Delivery Format: Excel.
$4999
Designed for the individual purchaser.
$6999
Users located at a single corporate site or regional office.
$7999
Allowed for unlimited sharing globally within one company.
Smallform of Sample request

Have a question?

User Profile

Don’t settle for less – trust Mitul to help you find the best solution.

Report delivery within 24 to 48 hours

– Other Info –

What people say?-

User Review

I am very impressed with the information in this report. The author clearly did their research when they came up with this product and it has already given me a lot of ideas.

Jana Schmidt
CEDAR CX Technologies

– Connect with us –

Phone

+91 6232 49 3207


support

24/7 Research Support


sales@credenceresearch.com

– Research Methodology –

Going beyond the basics: advanced techniques in research methodology

– Trusted By –

Pepshi, LG, Nestle
Motorola, Honeywell, Johnson and johnson
LG Chem, SIEMENS, Pfizer
Unilever, Samsonite, QIAGEN