
Gas Turbine Compressor Market Overview:
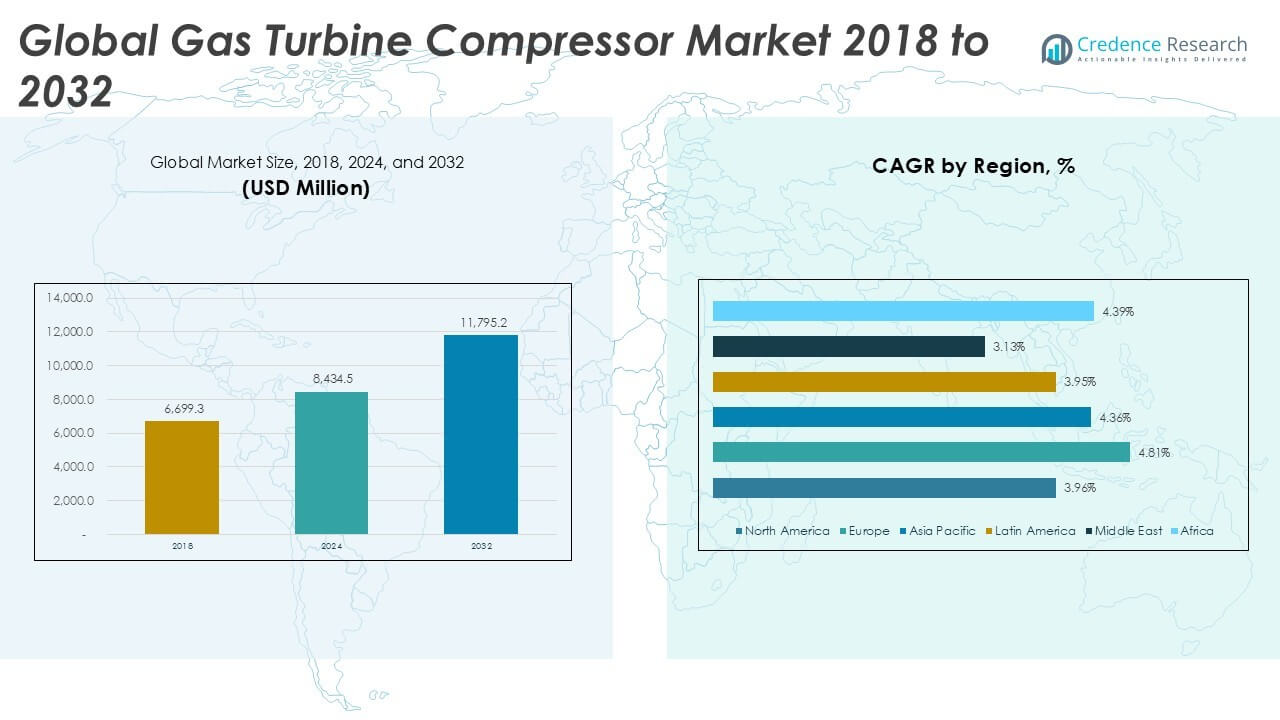
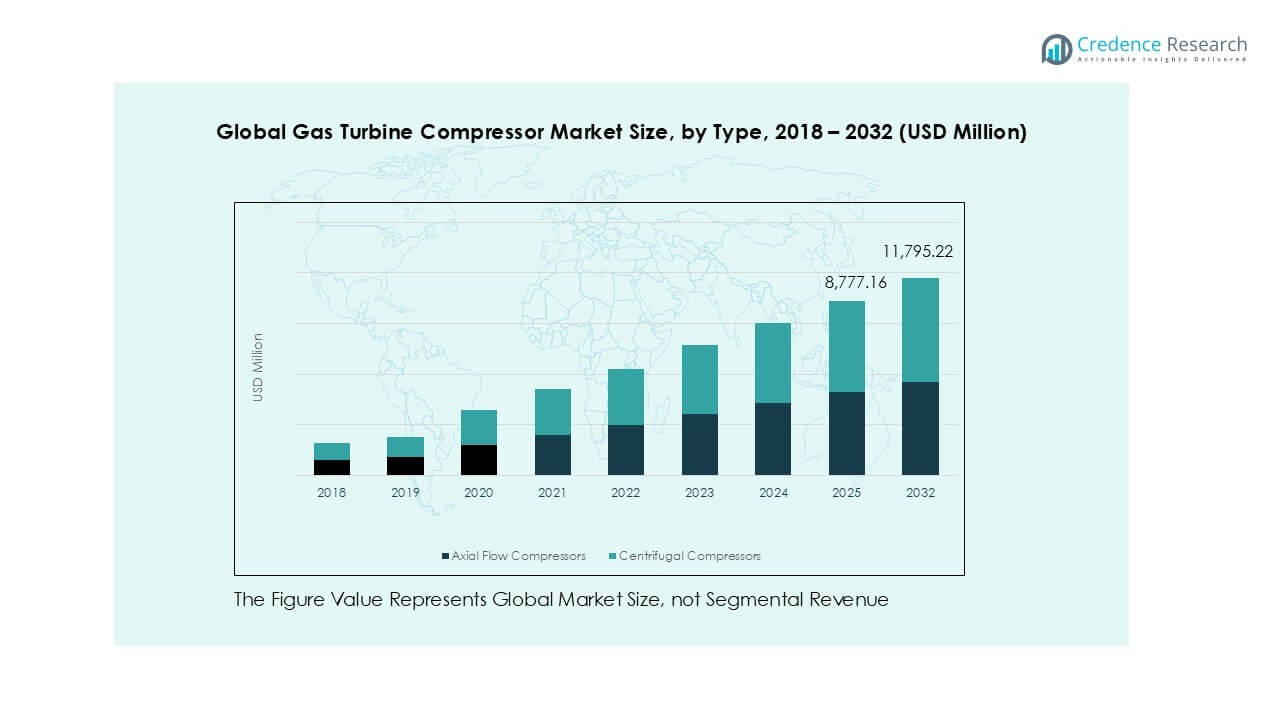
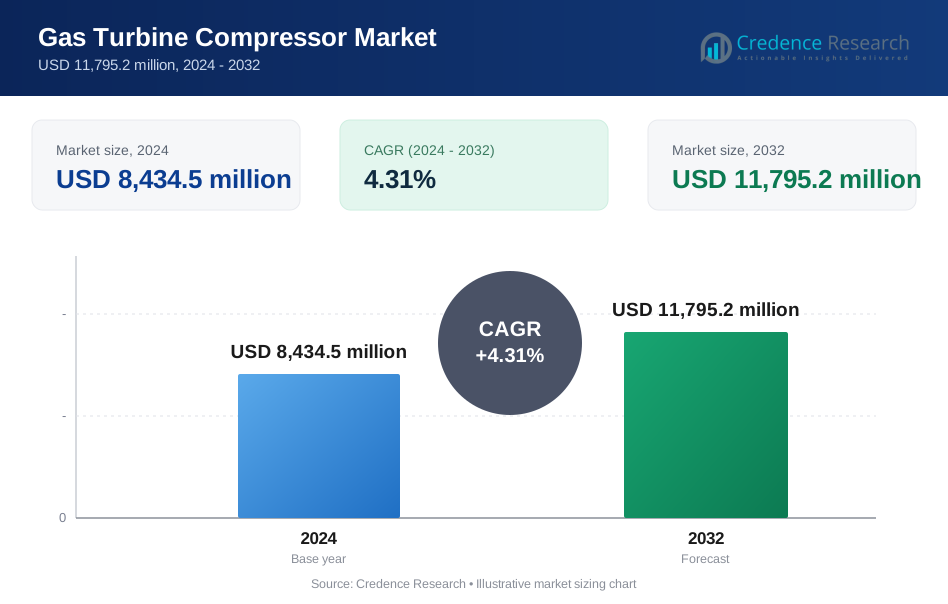
The Global Gas Turbine Compressor Market size was valued at USD 6,699.3 million in 2018, reached USD 8,434.5 million in 2024, and is anticipated to reach USD 11,795.2 million by 2032, growing at a CAGR of 4.31% during the forecast period.
| REPORT ATTRIBUTE | DETAILS |
|---|---|
| Historical Period | 2020-2023 |
| Base Year | 2024 |
| Forecast Period | 2025-2032 |
| Gas Turbine Compressor Market Size 2024 | USD 8,434.5 million |
| Gas Turbine Compressor Market, CAGR | 4.31% |
| Gas Turbine Compressor Market Size 2032 | USD 11,795.2 million |
The global gas turbine compressor market is led by key players such as General Electric, Mitsubishi Heavy Industries, Siemens Energy, Rolls-Royce Holdings, and MAN Energy Solutions. These companies dominate through advanced product portfolios, global service networks, and continuous innovation in efficiency and emissions control. General Electric and Siemens Energy hold significant market shares due to their presence across power, oil & gas, and industrial sectors. Asia Pacific emerges as the leading regional market, accounting for 34.9% of the global share in 2024, driven by rising power demand, industrial growth, and gas infrastructure expansion in China and India. Europe follows with 27.8%, supported by energy transition initiatives and infrastructure upgrades. Strategic partnerships, focus on hydrogen-ready turbines, and digital performance optimization tools remain key differentiators among the top competitors, while emerging markets continue to offer new growth opportunities for modular and mid-scale systems.
Gas Turbine Compressor Market Insights
- The global gas turbine compressor market was valued at USD 8,434.5 million in 2024 and is projected to reach USD 11,795.2 million by 2032, growing at a CAGR of 4.31%.
- Demand is driven by rising energy needs, industrialization, and preference for gas-fired power over coal due to lower emissions and better efficiency.
- Key trends include adoption of hydrogen-ready turbines, digital monitoring systems, and modular compressor designs for flexible deployment across industries.
- Major players such as General Electric, Mitsubishi Heavy Industries, and Siemens Energy lead with strong R&D and global service networks, while niche firms target mid-size segments.
- Asia Pacific leads with a 34.9% share in 2024, followed by Europe at 27.8% and North America at 23.6%. Power generation holds the largest application share, while axial flow compressors dominate by type due to their performance in high-capacity systems.
Gas Turbine Compressor Market Segmentation Analysis:
By Type:
Axial flow compressors dominate the global gas turbine compressor market by type, accounting for over 60% of the revenue share in 2024. Their high efficiency in handling large volumes of air at constant pressure makes them ideal for heavy-duty industrial and power applications. These compressors offer superior aerodynamic performance, compact size, and lower operational costs for high-flow environments. Centrifugal compressors, while used in smaller or medium-scale systems, serve niche applications like aviation auxiliary power units and compact gas turbines. However, axial units continue to lead due to their suitability in high-capacity, high-efficiency turbine systems.
- For instance, GE’s LM2500 series gas turbines use a 17‑stage axial compressor to deliver up to 47,370 shp in the LM2500+G4 configuration with enhanced reliability and flow handling.
By Capacity:
Large-capacity gas turbine compressors (above 20 MW) lead the market, contributing more than 50% of the segment revenue in 2024. Their dominance stems from growing adoption in utility-scale power plants and major oil & gas infrastructure requiring high output and sustained performance. These units deliver higher thermal efficiency and longer operational lifecycles, making them cost-effective for large-scale continuous operations. Meanwhile, medium (5–20 MW) and small (1–5 MW) capacity turbines support distributed energy, marine, and industrial uses. The shift toward decentralized energy and microgrids supports moderate growth in the small and medium segments.
- For instance, GE’s aeroderivative LM2500 family, producing around 37 MW in typical configurations, has accumulated over 120 million operating hours globally, demonstrating durability in high‑capacity applications.
By Application:
Power generation remains the dominant application segment, holding over 40% market share in 2024. The rising global demand for cleaner and more efficient energy sources fuels adoption of gas turbine compressors in combined-cycle and peaking power plants. Gas turbines offer fast start-up, reduced emissions, and reliable performance, making them ideal for grid stabilization and renewable energy integration. The oil & gas sector follows, driven by compressor use in LNG processing, gas injection, and refinery operations. Aviation, marine, and industrial sectors also use gas turbine compressors for propulsion and process efficiency, though they account for smaller shares.
Gas Turbine Compressor Market Key Growth Drivers
Rising Demand for Reliable and Flexible Power Generation
The increasing global need for flexible and dispatchable power is a key driver for gas turbine compressor adoption. With rising energy consumption and intermittent renewable integration, utilities are turning to gas turbines for quick ramp-up capabilities and grid stability. Gas turbine compressors are critical to maintaining high thermal efficiency and reliable operation under fluctuating loads. Rapid urbanization and industrial expansion in emerging economies further boost demand for gas-based power infrastructure. Combined-cycle power plants, which rely on efficient compressors, are preferred for their low emissions and better heat utilization. Countries facing energy transition mandates are investing in modern gas turbine systems as bridging solutions, driving compressor upgrades and new installations.
- For instance, Siemens Energy’s SGT‑800 gas turbine delivers stable output with integrated multistage compressors ideal for flexible power generation systems.
Expanding Oil & Gas Infrastructure Investments
Ongoing exploration and production activities across North America, the Middle East, and Asia are strengthening demand for gas turbine compressors in the oil & gas industry. These compressors are vital for gas re-injection, pipeline transmission, LNG processing, and refinery operations. With increasing offshore developments and rising natural gas trade, energy companies are investing in high-performance turbine systems with robust compression units. New refinery and petrochemical capacity additions in Asia-Pacific and the Middle East further expand compressor deployment. Additionally, aging infrastructure in North America and Europe is being upgraded with energy-efficient turbines, propelling compressor retrofits. The industry's focus on operational efficiency, emission control, and process reliability sustains long-term demand.
- For instance, Baker Hughes received an order to supply 17 pipeline centrifugal compressors for Saudi Arabia’s Aramco gas network expansion, enhancing gas distribution infrastructure.
Increasing Focus on Industrial Efficiency and Process Optimization
Industrial users across sectors such as chemicals, cement, steel, and paper are adopting gas turbine compressors for process heating, mechanical drive applications, and on-site power generation. Compressors enable stable pressure and flow control, optimizing turbine efficiency and reducing fuel consumption. As energy prices rise and regulatory pressures intensify, industries prioritize equipment that reduces operating costs and carbon emissions. The compact design, high power-to-weight ratio, and lower maintenance of turbine compressors make them suitable for continuous and demanding operations. Furthermore, digitalization and real-time monitoring solutions are enhancing compressor performance, enabling predictive maintenance, and extending operational life further incentivizing industrial uptake.
Gas Turbine Compressor Market Key Trends & Opportunities
Shift Toward Hydrogen-Compatible Gas Turbine Compressors
The push for decarbonization is leading to a growing interest in hydrogen-compatible turbine systems. Gas turbine compressor manufacturers are now designing equipment capable of handling hydrogen blends or pure hydrogen to future-proof investments. This transition opens new opportunities for equipment retrofits and greenfield installations in both power generation and industrial sectors. Countries in Europe, Japan, and South Korea are piloting hydrogen gas turbines, creating demand for advanced compression technologies. OEMs such as Siemens Energy and Mitsubishi Power are already testing 100% hydrogen-capable turbines, highlighting a major shift in product development. This trend supports both emissions reduction goals and long-term market relevance of gas turbines in a low-carbon economy.
- For instance, Mitsubishi Power completed a demonstration blending up to 50% hydrogen on an M501GAC gas turbine unit at Georgia Power’s Plant McDonough‑Atkinson, enhancing cleaner fuel
Growing Adoption of Modular and Mobile Turbine Compressor Units
The trend toward decentralized energy and flexible industrial operations is boosting demand for modular gas turbine compressors. These systems are compact, factory-assembled, and easier to transport, reducing installation time and cost. Mobile turbine compressors are gaining traction in oilfields, mining, and emergency power applications, especially in remote or rugged environments. As users prioritize plug-and-play solutions and scalability, manufacturers are developing portable units with digital control features and quick start-up capability. Modular designs also support faster service, lower downtime, and easier upgrades. This growing preference enables quicker project turnaround and opens new application areas for OEMs and service providers.
Gas Turbine Compressor Market Key Challenges
High Initial Capital Cost and Long ROI Period
One of the primary challenges in the gas turbine compressor market is the high upfront cost of acquisition and installation. Large-capacity systems require significant capital expenditure, including turbine, compressor, control systems, and auxiliary components. For many end users, especially in developing countries or smaller industrial operations, the extended return on investment (ROI) can deter adoption. This challenge is compounded by the availability of low-cost alternatives such as diesel engines or electric compressors in some use cases. Moreover, project financing constraints, policy uncertainties, and long approval cycles slow down procurement decisions. Reducing total lifecycle costs through efficiency gains and performance contracts is becoming essential to overcome this hurdle.
Stringent Emission Regulations and Transition to Renewables
Stricter environmental norms and rising pressure to reduce greenhouse gas emissions pose a challenge for the gas turbine compressor market. While gas turbines are cleaner than coal, they still emit carbon dioxide and nitrogen oxides, attracting regulatory scrutiny in regions like Europe and North America. Additionally, the rapid growth of solar, wind, and battery storage technologies is reducing reliance on thermal-based generation. This trend is shifting investment away from gas turbines in some mature markets, especially where policy favors zero-emission solutions. Manufacturers must therefore innovate around low-emission designs, carbon capture integration, and renewable gas compatibility to maintain competitiveness and regulatory compliance.
Gas Turbine Compressor Market Regional Analysis
North America
North America held a 23.6% share of the global gas turbine compressor market in 2024, with a value of USD 1,993.43 million, up from USD 1,615.20 million in 2018. The market is projected to reach USD 2,712.90 million by 2032, growing at a CAGR of 3.96%. The region benefits from advanced power infrastructure, shale gas exploration, and retrofit demand in thermal plants. The U.S. leads with high investments in combined-cycle gas turbines and LNG infrastructure. Regulatory support for cleaner energy and industrial energy efficiency further drives regional adoption of advanced turbine compressor systems.
Europe
Europe accounted for 27.8% of the global market in 2024, with a value of USD 2,346.00 million, rising from USD 1,808.81 million in 2018. By 2032, the market is expected to hit USD 3,408.82 million, registering the highest regional CAGR of 4.81%. The region’s growth is driven by energy transition goals, adoption of hydrogen-ready turbines, and strong investment in combined heat and power (CHP) plants. Countries like Germany, the UK, and France are upgrading aging infrastructure with high-efficiency turbine compressors, supporting emissions compliance. The push for decarbonization enhances demand for innovative gas-based solutions.
Asia Pacific
Asia Pacific led the global gas turbine compressor market in 2024 with a 34.9% share, valued at USD 2,941.47 million, up from USD 2,330.01 million in 2018. The market is projected to reach USD 4,128.33 million by 2032, growing at a CAGR of 4.36%. Strong industrial growth, urbanization, and large-scale energy projects across China, India, and Southeast Asia drive demand. Government initiatives to reduce coal dependency and expand gas-fired generation also support regional growth. Additionally, rising investments in oil & gas processing and distributed power generation expand opportunities for high-capacity compressors.
Latin America
Latin America represented 7.3% of the global market in 2024, reaching USD 615.72 million from USD 499.10 million in 2018. The market is projected to grow to USD 837.46 million by 2032 at a CAGR of 3.95%. Brazil and Mexico lead regional deployment, driven by industrial expansion and increased focus on natural gas-based power. Ongoing investments in refining and midstream gas infrastructure also contribute to demand. Despite economic challenges, regional governments are promoting private investments in energy, supporting gas turbine adoption across both utility and industrial sectors.
Middle East
The Middle East accounted for 4.5% of the global market in 2024, valued at USD 378.59 million, up from USD 320.23 million in 2018. The market is expected to reach USD 483.60 million by 2032, at a slower CAGR of 3.13%. Though the region has strong gas reserves, the focus remains on maximizing upstream efficiency and expanding refining capacity. Countries like Saudi Arabia and the UAE are modernizing power infrastructure to support industrial diversification. However, the presence of subsidized electricity and alternative fuel sources slightly dampens compressor market expansion compared to other regions.
Africa
Africa held a 1.9% share of the global market in 2024, with a value of USD 159.29 million, growing from USD 125.95 million in 2018. The market is projected to reach USD 224.11 million by 2032, registering a strong CAGR of 4.39%. Growing energy access programs, off-grid gas power solutions, and industrialization across Nigeria, Egypt, and South Africa drive market growth. Infrastructure gaps and funding challenges remain, but increasing public-private partnerships support expansion. Gas turbine compressors are being adopted in localized power generation and industrial projects, making Africa a rising market with long-term growth potential.
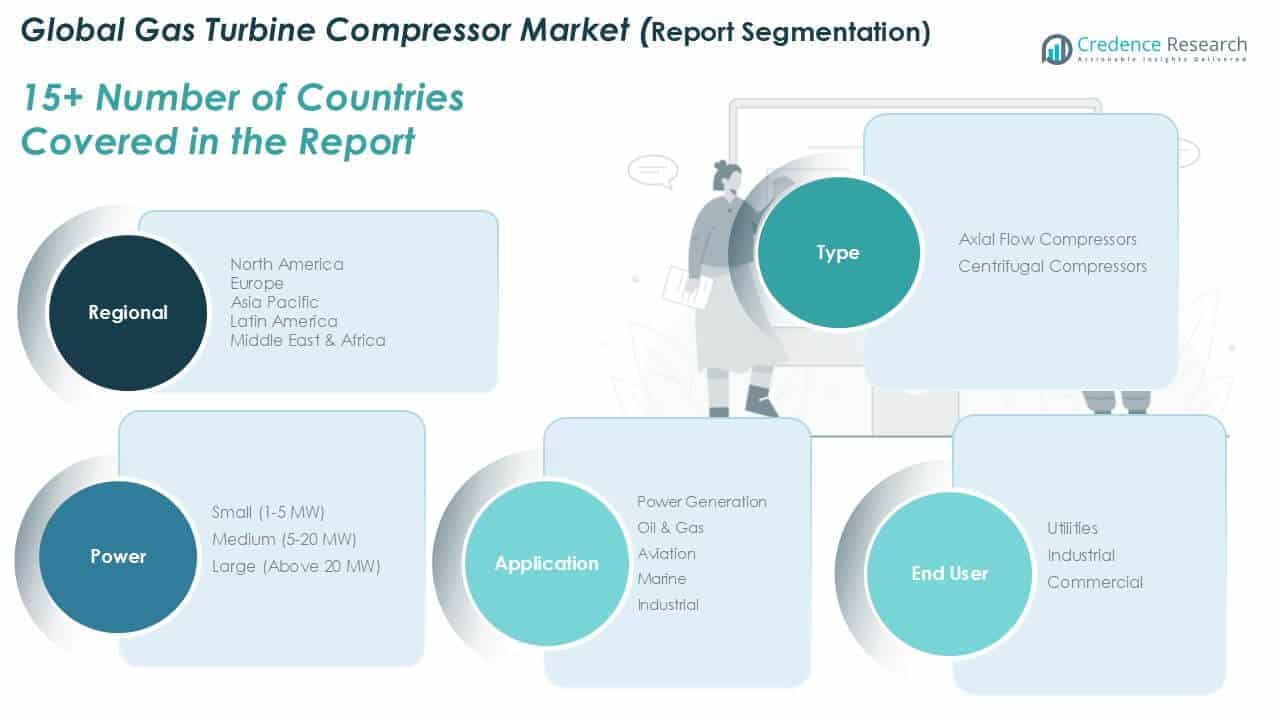
Gas Turbine Compressor Market Segmentations:
By Type:
- Axial Flow Compressors
- Centrifugal Compressors
By Capacity:
- Small (1–5 MW)
- Medium (5–20 MW)
- Large (Above 20 MW)
By Application:
- Power Generation
- Oil & Gas
- Aviation
- Marine
- Industrial
By End User:
- Utilities
- Industrial
- Commercial
By Geography:
- North America
- U.S.
- Canada
- Mexico
- Europe
- Germany
- France
- U.K.
- Italy
- Spain
- Rest of Europe
- Asia Pacific
- China
- Japan
- India
- South Korea
- South-east Asia
- Rest of Asia Pacific
- Latin America
- Brazil
- Argentina
- Rest of Latin America
- Middle East & Africa
- GCC Countries
- South Africa
- Rest of the Middle East and Africa
Gas Turbine Compressor Market Competitive Landscape
The global gas turbine compressor market is highly competitive, with key players focusing on innovation, efficiency enhancement, and global expansion. Major companies such as General Electric, Mitsubishi Heavy Industries, Siemens Energy, and Rolls-Royce dominate the landscape through extensive product portfolios and strong R&D capabilities. These firms are investing in hydrogen-ready and low-emission turbine technologies to align with decarbonization trends. Emerging players like Capstone Turbine and Solar Turbines Incorporated are gaining traction in small-scale and modular systems. Strategic partnerships, long-term service agreements, and digital performance monitoring are core to competitive differentiation. Additionally, companies are strengthening their aftermarket services and offering performance-based contracts to enhance customer retention and revenue streams. The presence of regional manufacturers and OEM collaborations in Asia and the Middle East adds further intensity to market rivalry. Overall, the market rewards technological advancement, cost efficiency, and reliability, with players competing on innovation, service quality, and lifecycle value.
Key Player Analysis
- General Electric
- Mitsubishi Heavy Industries Ltd.
- Ansaldo Energia
- MAN Energy Solutions
- Solar Turbines Incorporated
- Kawasaki Heavy Industries Ltd.
- Rolls-Royce Holdings plc
- Capstone Turbine Corporation
- Doosan Heavy Industries & Construction Co., Ltd.
- Alstom SA
- Other Key Players
Recent Developments
- In March 2023, GE’s latest high-efficiency gas turbine will cover less natural gas, which will be implemented in the 435-megawatt Tallawarra power station in Sydney, Australia.
- In January 2023, Mitsubishi Power accepts an order for H-25 Gas Turbine for Taiwan’s Chang Chun petrochemical project; additionally, conversion of the cogeneration system at the Miaoli Factory in Miaoli City to a High Power-Efficient Gas-Fired System to Decrease CO2 Emissions.
- In January 2022, GE Digital’s Autonomous Tuning Speed up the Energy Transition with Machine Learning and Artificial Intelligence, which will reduce harmful emissions and fuel consumption for gas turbines. Additionally, this will cost lower machinery and operational flexibility.
Report Coverage
The research report offers an in-depth analysis based on Type, Capacity, Application, End-User and Geography. It details leading market players, providing an overview of their business, product offerings, investments, revenue streams, and key applications. Additionally, the report includes insights into the competitive environment, SWOT analysis, current market trends, as well as the primary drivers and constraints. Furthermore, it discusses various factors that have driven market expansion in recent years. The report also explores market dynamics, regulatory scenarios, and technological advancements that are shaping the industry. It assesses the impact of external factors and global economic changes on market growth. Lastly, it provides strategic recommendations for new entrants and established companies to navigate the complexities of the market.
Future Outlook
- Demand for gas turbine compressors will rise with increasing focus on flexible and clean power generation.
- Hydrogen-compatible turbine systems will gain traction as countries invest in low-carbon technologies.
- Industrial sectors will adopt compressors for efficiency, reliability, and cost-effective on-site power solutions.
- Digital control and predictive maintenance will enhance system performance and reduce operational downtime.
- Modular and mobile turbine compressors will support decentralized energy and remote industrial applications.
- Power generation will remain the dominant application, especially in fast-growing economies.
- Retrofit and upgrade activities will grow in mature markets to meet emission norms and performance standards.
- Asia Pacific will maintain its lead due to strong energy demand and industrial investments.
- Europe will expand its share through green energy initiatives and hydrogen project rollouts.
- Competitive focus will remain on innovation, fuel flexibility, lifecycle services, and regional expansion.
Request a Free Sample
Fill in your details and we'll send you a free sample report.
- Sample data tables & charts
- Research methodology
Need a Custom Version of This Report?
Tailor the scope, geography, or segments to your exact requirements.
- Custom geography or segment scope
- Direct access to our analyst team
Frequently Asked Questions
What is the current market size for the Global Gas Turbine Compressor market, and what is its projected size in 2032?
At what Compound Annual Growth Rate is the Global Gas Turbine Compressor market projected to grow between 2024 and 2032?
Which Global Gas Turbine Compressor market segment held the largest share in 2024?
What are the primary factors fueling the growth of the Global Gas Turbine Compressor market?
Who are the leading companies in the Global Gas Turbine Compressor market?
Which region commanded the largest share of the Global Gas Turbine Compressor market in 2024?
Table of Content
Chapter 1. Report Introduction
- 1.1 Report Description & Purpose
- 1.1.1 Report Title & Market Definition
- 1.1.2 Unique Selling Propositions (USP) & Key Differentiators
- 1.1.3 Value Proposition for Stakeholders
- 1.2 Research Objectives
- 1.2.1 Market Sizing Objectives (Volume & Revenue)
- 1.2.2 Segmentation Objectives
- 1.2.3 Competitive Intelligence Objectives
- 1.2.4 Forecast & Scenario Objectives
- 1.3 Report Scope
- 1.3.1 Gas Turbine Compressor Scope – Types & Subtypes Covered
- 1.3.2 Geographic Scope – Regions & Countries Covered
- 1.3.3 Historical Period, Base Year & Forecast Period (2024; forecast to 2032)
- 1.3.4 Inclusions & Exclusions
- 1.4 HS Code & Classification Framework
- 1.5 Currency, Units & Pricing Basis
- 1.6 Target Stakeholders
- 1.7 Limitations & Assumptions
Chapter 2. Executive Summary
- 2.1 Global Gas Turbine Compressor Market Snapshot
- 2.1.1 Market Size – Historical (2024) & Forecast (2024-2032) (2024: USD 8,434.5 million → 2032: USD 11,795.2 million)
- 2.1.2 Volume & Revenue – Global Totals
- 2.1.3 Key Market Highlights – Top Five Facts
- 2.2 Gas Turbine Compressor Market Segmentation Snapshot
- 2.2.1 Market Split by Region – 2024 vs. 2032
- 2.3 Competitive Snapshot
- 2.3.1 Top 10 Players by Revenue Share – 2024
- 2.3.2 Top 10 Players by Volume Share – 2024
- 2.3.3 Recent Strategic Developments (18-Month Summary)
- 2.4 Key Investment Highlights & Strategic Conclusions
Chapter 3. Gas Turbine Compressor Market Dynamics & Industry Analysis
- 3.1 Market Overview & Context
- 3.1.1 Gas Turbine Compressor Market Position in the Broader Automotive Value Chain
- 3.1.2 OEM vs. Replacement Market Dynamics
- 3.1.3 Market Maturity & Development Stage by Region
- 3.2 Gas Turbine Compressor Market Drivers
- 3.3 Gas Turbine Compressor Market Restraints & Challenges
- 3.4 Gas Turbine Compressor Market Opportunities
- 3.5 Porter's Five Forces Analysis
- 3.5.1 Threat of New Entrants
- 3.5.2 Bargaining Power of Suppliers
- 3.5.3 Bargaining Power of Buyers
- 3.5.4 Threat of Substitutes
- 3.5.5 Competitive Rivalry – Intensity Assessment
- 3.6 Gas Turbine Compressor Value Chain Analysis
- 3.6.1 Upstream – Raw Material/Input Suppliers
- 3.6.1.1 Raw Material/Input 1
- 3.6.1.2 Raw Material/Input 2
- 3.6.1.3 Raw Material/Input 3
- 3.6.2 Midstream – Production/Manufacturing/Service Delivery
- 3.6.2.1 Production/Process Overview
- 3.6.2.2 Key Facility Locations & Capacity by Manufacturer
- 3.6.3 Downstream – Distribution & End Consumer
- 3.6.3.1 Primary Channel – B2B/OEM
- 3.6.3.2 Secondary Channels – Dealer, Retail, Online, Direct
- 3.6.4 Value Chain Profitability Analysis
- 3.6.1 Upstream – Raw Material/Input Suppliers
- 3.7 PESTEL Analysis
- 3.7.1 Political Factors
- 3.7.2 Economic Factors
- 3.7.3 Social Factors
- 3.7.4 Technological Factors
- 3.7.5 Environmental Factors
- 3.7.6 Legal Factors
- 3.8 Gas Turbine Compressor Supply Chain Analysis
- 3.8.1 Raw Material/Input Supply Risk Assessment
- 3.8.2 Manufacturing Concentration Risk (Geographic Exposure)
- 3.8.3 Trade Disruption Impact Analysis
- 3.9 Regulatory & Policy Landscape
Note: The regulatory and policy landscape section covers regulations based on their applicability to the market, Gas Turbine Compressor category, geography, and scope of the study. Only regulatory frameworks with a material impact on operations, compliance, trade, sustainability, or market access are analyzed in detail.
Chapter 4. Key Investment Pockets & Opportunity Analysis
- 4.1 Gas Turbine Compressor Market Attractiveness Analysis
- 4.1.1 By Region – Investment Attractiveness Matrix (Volume × CAGR)
- 4.2 Absolute Revenue Growth Opportunity
- 4.2.1 By Region – Absolute USD Growth Through 2032
- 4.3 Incremental Volume Opportunity
- 4.3.1 By Region – Incremental Volume Through 2032
- 4.3.2 Segment – Incremental Volume
- 4.4 Emerging Submarket Opportunity Deep Dive (Subject to Applicability)
- 4.5 Emerging Market Opportunity Scorecards
- 4.5.1 United States
- 4.5.2 Europe
- 4.5.3 Asia
- 4.5.4 Middle East & Africa
Note: Emerging Market Opportunity Scorecards will be included based on relevance and strategic importance. Regions listed are indicative and may vary depending on data availability and market dynamics.
Chapter 5. Gas Turbine Compressor Import-Export Analysis & Trade Flows
- 5.1 Global Trade Overview
- 5.1.1 Global Export Value by Country (2024)
- 5.1.2 Global Export Volume by Country (2024)
- 5.1.3 Global Import Value by Country (2024)
- 5.1.4 Global Import Volume by Country (2024)
- 5.1.5 Net Trade Balance by Country (2024)
- 5.2 Export Analysis – Segment
- 5.2.1 Type 1 (HS Code)
- 5.2.2 Type 2 (HS Code)
- 5.2.3 Type 3 (HS Code)
- 5.2.4 Type 4 (HS Code)
- 5.2.5 Type 5 (HS Code)
- 5.3 Import Analysis – Segment
- 5.3.1 Type 1 (HS Code)
- 5.3.2 Type 2 (HS Code)
- 5.3.3 Type 3 (HS Code)
- 5.3.4 Type 4 (HS Code)
- 5.3.5 Type 5 (HS Code)
- 5.4 Average Unit Trade Prices
- 5.4.1 Average Export Price – Segment & Country
- 5.4.2 Average Import Price – Segment & Source Country
- 5.4.3 Price Trends (2024)
- 5.5 Key Trade Route Analysis
- 5.5.1 Trade Route 1
- 5.5.2 Trade Route 2
- 5.5.3 Trade Route 3
- 5.5.4 Trade Route 4
- 5.5.5 Trade Route 5
- 5.6 Trade Policy Impact Assessment
- 5.6.1 US Anti-Dumping & Section 301 Tariffs
- 5.6.2 EU Customs Union Impact
- 5.6.3 Major Free Trade Agreements
- 5.6.4 USMCA Rules of Origin
Note: Trade policy analysis will be included only where relevant to the Gas Turbine Compressor market.
Chapter 6. Competitive Landscape & Company Benchmarking
- 6.1 Gas Turbine Compressor Market Concentration & Structure
- 6.1.1 Herfindahl-Hirschman Index (HHI) – vs. 2024
- 6.1.2 Tier 1, Tier 2 & Tier 3 Market Structure
- 6.1.3 Global, Regional & Local Player Dynamics
- 6.2 Gas Turbine Compressor Market Share Analysis – 2024
- 6.2.1 Global Revenue Share by Company
- 6.2.2 Global Volume Share by Company
- 6.2.3 Regional Revenue Share
- 6.2.4 Market Share Evolution ( vs. 2024)
- 6.2.5 OEM Segment Share by Company
- 6.2.6 Replacement Segment Share by Company
- 6.3 Production/Delivery Capacity & Facility Analysis
- 6.3.1 Global Installed Capacity
- 6.3.2 Capacity Utilization Rates
- 6.3.3 Production/Output Volume
- 6.3.4 Facility Locations & Capacity Map
- 6.3.5 Planned Capacity Additions
- 6.4 Gas Turbine Compressor Competitive Benchmarking Matrix
- 6.4.1 Revenue, Volume, CAGR & Profitability Comparison
- 6.4.2 Channel Revenue Mix
- 6.4.3 Geographic Revenue Exposure
- 6.4.4 R&D Intensity
- 6.4.5 Sustainability Maturity
- 6.5 Strategic Developments in Gas Turbine Compressor (Last 24 Months)
- 6.5.1 Mergers, Acquisitions & Divestments
- 6.5.2 New Gas Turbine Compressor Launches
- 6.5.3 Facility Expansions
- 6.5.4 Strategic Alliances, Joint Ventures & Partnerships
- 6.5.5 Distribution Expansion & Market Entry
- 6.5.6 Sustainability & ESG Initiatives
- 6.6 Competitive Strategy Mapping
- 6.6.1 Leader, Challenger, Follower & Niche Classification
- 6.6.2 Pricing Strategy Comparison
- 6.6.3 Channel Strategy Matrix
Note: Strategic developments are included based on their materiality and the availability of reliable information.
Chapter 7. Global Gas Turbine Compressor Market – By Distribution Channel
- 7.1 Segment Overview
- 7.1.1 Volume & Revenue Split by Channel (2024 & 2032)
- 7.1.2 Channel Mix Evolution (2024-2032)
Chapter 8. Regional Market Analysis – Global Overview
- 8.1 Global Regional Overview
- 8.1.1 Regional Volume Share
- 8.1.2 Regional Revenue Share
- 8.1.3 Regional Volume by Region
- 8.1.4 Regional Revenue by Region
- 8.1.5 Regional Forecast Through 2032
- 8.2 Cross-Regional Segment Analysis
- 8.2.1 By Distribution Channel
- 8.2.2 By Brand/Price Tier
Chapter 9. North America Gas Turbine Compressor Market
- 9.1 United States
- 9.2 Canada
- 9.3 Mexico
Chapter 10. Europe Gas Turbine Compressor Market
- 10.1 Germany
- 10.2 France
- 10.3 Italy
- 10.4 United Kingdom
- 10.5 Spain
- 10.6 Poland
- 10.7 Russia
- 10.8 Netherlands
- 10.9 Belgium
- 10.10 Sweden
- 10.11 Denmark
- 10.12 Norway
- 10.13 Rest of Europe
Chapter 11. Asia Pacific Gas Turbine Compressor Market
- 11.1 China
- 11.2 India
- 11.3 Japan
- 11.4 South Korea
- 11.5 Thailand
- 11.6 Indonesia
- 11.7 Vietnam
- 11.8 Malaysia
- 11.9 Australia
- 11.10 Rest of Asia Pacific
Chapter 12. Latin America Gas Turbine Compressor Market
- 12.1 Brazil
- 12.2 Argentina
- 12.3 Colombia
- 12.4 Chile
- 12.5 Rest of Latin America
Chapter 13. Middle East Gas Turbine Compressor Market
- 13.1 Saudi Arabia
- 13.2 United Arab Emirates
- 13.3 Turkey
- 13.4 Israel
- 13.5 Iran
- 13.6 Rest of the Middle East
Chapter 14. Africa Gas Turbine Compressor Market
- 14.1 South Africa
- 14.2 Egypt
- 14.3 Nigeria
- 14.4 Morocco
- 14.5 Rest of Africa
Chapter 15. Gas Turbine Compressor Company Profiles
- 15.1 [Company 01]
- 15.1.1 Company Overview
- 15.1.2 Key Management Personnel
- 15.1.3 Products & Services Portfolio
- 15.1.4 Financial Performance
- 15.1.5 Key Market Focus & Geographic Presence
- 15.1.6 Recent Developments & Strategic Initiatives
Note: The company profile list is preliminary and may change based on research findings, market developments, data availability, and client requirements.
Chapter 16. Appendices
- Appendix A – List of Abbreviations & Acronyms
- Appendix B – Industry Classification Code Reference – Full Series
- Appendix C – Production & Capacity Data Tables
- Appendix D – End-Use & Demand Base Tables
- Appendix E – Consumption & Replacement Rate Assumptions
- Appendix F – ASP Reference Tables
- Appendix G – Manufacturing & Facility Database
- Appendix H – Import-Export Data Tables
- Appendix I – Regulatory Summary Tables
- Appendix J – Primary Research Participant List (Anonymized)
- Appendix K – Primary Research Questionnaire Framework
- Appendix L – Data Sources & Bibliography
- Appendix M – Market Size Divergence & Source Comparison
Chapter 17. Research Methodology
- 17.1 Research Framework & Philosophy
- 17.2 Secondary Research – Sources, Hierarchy & Data Extraction
- 17.3 Data Modeling – Bottom-Up & Top-Down Market Sizing
- 17.4 Primary Research – Stakeholder Framework, LOI & Sample Sizes
- 17.5 Forecast Methodology – Regression, Scenario & Sensitivity Analysis
- 17.6 Quality Control – Four-Layer Validation Framework
- 17.7 Limitations & Standard Assumptions
- 17.8 Disclaimer
