
Market Overview:
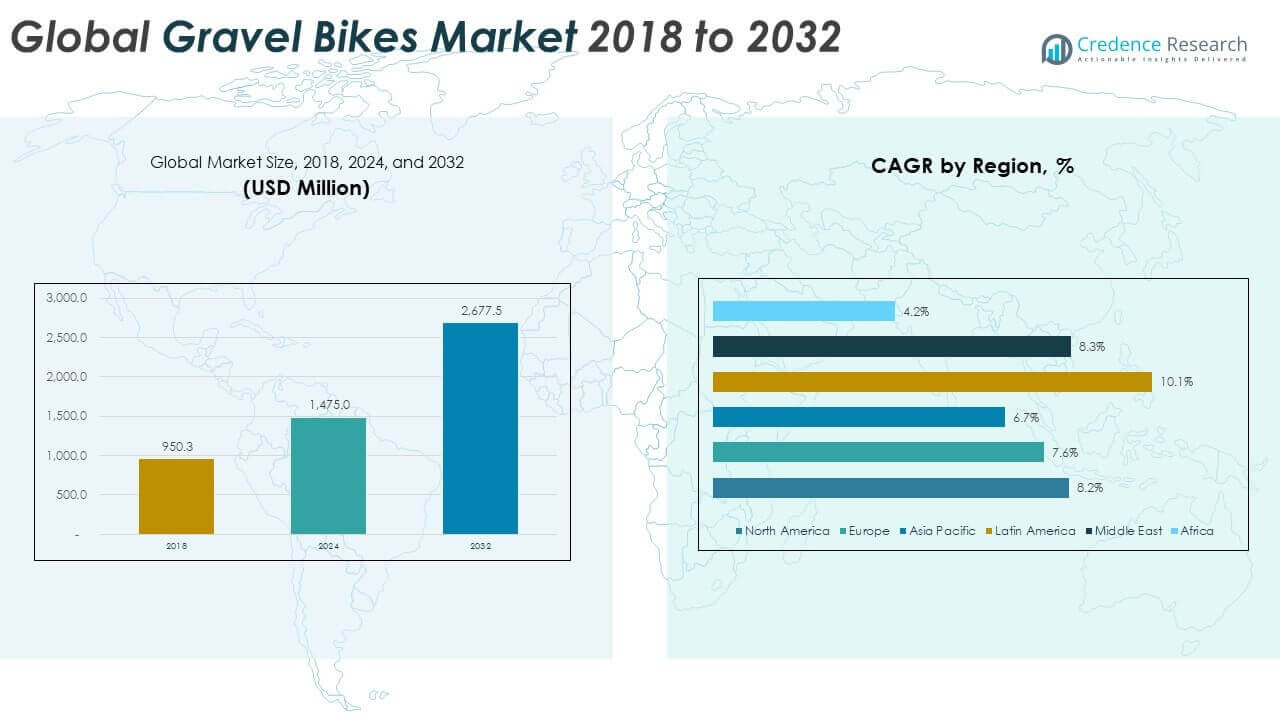
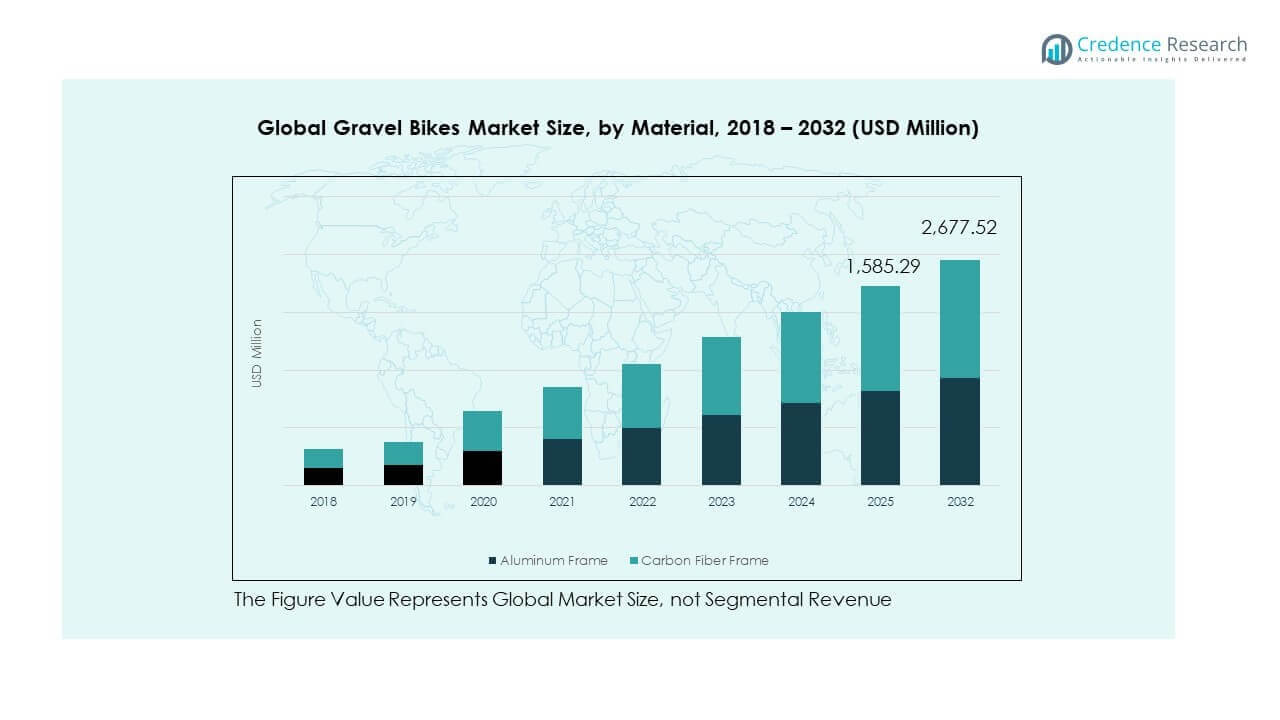
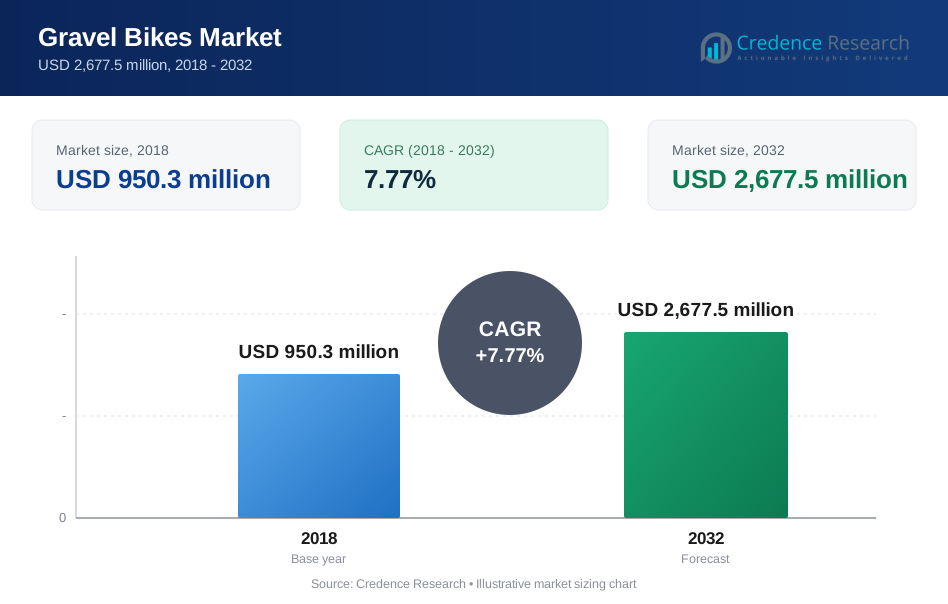
The Global Gravel Bikes Market size was valued at USD 950.3 million in 2018 to USD 1,475.0 million in 2024 and is anticipated to reach USD 2,677.5 million by 2032, at a CAGR of 7.77% during the forecast period.
| REPORT ATTRIBUTE | DETAILS |
|---|---|
| Historical Period | 2020-2023 |
| Base Year | 2024 |
| Forecast Period | 2025-2032 |
| Gravel Bikes Market Size 2024 | USD 1,475.0 million |
| Gravel Bikes Market, CAGR | 7.77% |
| Gravel Bikes Market Size 2032 | USD 2,677.5 million |
Growth comes from rising interest in mixed-terrain cycling and outdoor fitness. Riders want one bicycle for road, trail, and commuting use. Gravel bikes meet this need through wider tires and stable frames. Adventure tourism also supports demand across leisure riders. Urban cyclists adopt gravel bikes for poor road conditions. Brands improve comfort using carbon frames and vibration control. Disc brakes and electronic shifting improve safety and ease. Online retail expands access to niche models. Community events and races raise awareness and participation levels globally.
North America leads due to strong cycling culture and wide trail networks. The United States drives demand through adventure riding and endurance events. Europe follows with high adoption in Germany, the UK, and France. Strong infrastructure and eco-friendly travel support growth there. Asia-Pacific is emerging, led by Japan, China, and Australia. Rising income and urban cycling interest support adoption. Latin America shows gradual uptake through tourism routes. The Middle East and Africa remain nascent, limited by infrastructure and price sensitivity.
Market Insights:
- The Global Gravel Bikes Market was valued at USD 950.3 million in 2018, reached USD 1,475.0 million in 2024, and is projected to hit USD 2,677.5 million by 2032, expanding at a CAGR of 7.77% during the forecast period.
- Asia Pacific leads with about 35.5% share, followed by Europe at nearly 24% and North America at around 19.4%, driven by strong manufacturing bases, cycling infrastructure, and active recreational demand.
- Latin America is the fastest-growing region with roughly 13.2% share, supported by rising cycling tourism, expanding trail networks, and growing interest in adventure sports.
- By material, aluminum frame gravel bikes account for nearly 60% share, supported by affordability, durability, and wide adoption across entry and mid-range segments.
- Carbon fiber frame gravel bikes hold close to 40% share, driven by demand for lightweight performance models in racing and endurance-focused applications.
Market Drivers:
Rising Demand For Versatile Bicycles Across Mixed Terrain Use Cases
The Global Gravel Bikes Market benefits from demand for multi-surface bicycles. Riders prefer one bicycle for road and trail use. Gravel bikes handle rough roads and light trails well. Commuters value durability on poor urban surfaces. Recreational riders seek freedom beyond paved routes. Fitness-focused consumers favor long-distance comfort. Endurance events raise interest among amateur cyclists. Product versatility supports wider buyer appeal. This demand supports steady category expansion.
- For instance, Shimano’s GRX Di2 12‑speed gravel‑specific groupset delivers precise shifting and reliable braking tailored to mixed terrain performance, reinforcing bike versatility. Recreational riders seek freedom beyond paved routes.
Growth Of Outdoor Recreation And Adventure Cycling Activities Worldwide
Outdoor recreation growth supports the Global Gravel Bikes Market expansion. Adventure cycling attracts enthusiasts seeking exploration experiences. Long-distance gravel events gain popularity across regions. Cycling tourism promotes off-road route development. Riders invest in equipment for endurance journeys. Gravel bikes suit bikepacking and weekend travel. Social media exposure fuels lifestyle adoption. Community rides encourage trial and purchase decisions. This activity-driven demand sustains sales momentum.
- For instance, Lauf Cycling’s pivotless trailing link suspension fork enhances comfort and control on rugged routes, appealing to explorers on technical gravel terrain. Cycling tourism promotes off‑road route development. Riders invest in equipment for endurance journeys.
Technology Improvements Enhancing Comfort, Control, And Ride Stability
The Global Gravel Bikes Market gains strength from design innovation. Frame geometry improves stability on uneven surfaces. Wider tire clearance boosts traction and rider confidence. Disc brakes improve control in wet conditions. Carbon and alloy frames reduce fatigue on long rides. Vibration-damping components enhance comfort over distance. Gear range upgrades support climbing and speed balance. Manufacturers focus on reliability and durability. Technology supports premium and mid-range demand.
Expansion Of Organized Cycling Events And Grassroots Riding Communities
The Global Gravel Bikes Market grows with organized gravel events. Local races attract new riders to the category. Amateur participation rises across age groups. Clubs promote gravel riding through group events. Events showcase product performance in real conditions. Brand sponsorship increases category visibility. Retailers use events for demos and test rides. Community engagement strengthens loyalty and repeat purchases. Event culture supports long-term market growth.
Market Trends:
Shift Toward Lightweight Frames And Endurance-Focused Geometry Designs
The Global Gravel Bikes Market shows a shift toward lighter designs. Brands focus on endurance-oriented frame geometry. Riders prefer comfort during long-distance rides. Carbon frames gain interest in premium segments. Aluminum remains popular for value-focused buyers. Geometry balances speed with control on mixed terrain. Design choices support both racing and leisure use. Product differentiation increases across price tiers. This trend reshapes portfolio strategies.
- For instance, Merida’s Mission gravel platform features CF4 carbon and claimed sub‑8 kg builds on high‑end models, boosting performance in endurance and racing segments. Riders prefer comfort during long‑distance rides.
Rising Adoption Of Gravel Bikes For Urban And Commuter Applications
The Global Gravel Bikes Market sees urban adoption growth. Riders choose gravel bikes for daily commuting. Poor road quality supports this preference. Wider tires improve safety on broken surfaces. Upright posture enhances comfort during city rides. Commuters value durability and low maintenance. Accessories support racks and fenders integration. Urban use expands addressable demand. This trend blurs commuter and adventure segments.
- For instance, Canyon’s 2026 Grizl CF models feature up to 54 mm tire clearance and multiple accessory mounts (including fork, top tube, and rack interfaces), increasing utility for city riders navigating mixed infrastructure. Wider tires improve safety on broken surfaces by providing more grip and stability. Additionally, an upright posture from increased stack height enhances comfort during city rides.
Growing Preference For Customization And Modular Component Selection
The Global Gravel Bikes Market reflects rising customization demand. Riders select tires, handlebars, and gearing options. Modular setups suit personal riding styles. Bike fitting services gain importance at retail. Custom builds attract enthusiast buyers. Brands offer multiple trim levels per model. Online configurators support informed purchase decisions. Customization increases perceived product value. This trend supports premium pricing strategies.
Increasing Focus On Sustainability And Responsible Manufacturing Practices
The Global Gravel Bikes Market aligns with sustainability focus. Consumers value eco-conscious production methods. Brands highlight recycled materials in components. Durable designs support longer product life. Local assembly reduces transport emissions. Packaging changes reduce waste impact. Sustainability messaging influences brand choice. Retailers promote responsible sourcing narratives. Environmental focus shapes brand positioning.
Market Challenges Analysis:
High Product Pricing And Limited Accessibility For Entry-Level Consumers
The Global Gravel Bikes Market faces pricing challenges. Gravel bikes cost more than standard road bicycles. Advanced materials raise production expenses. Entry-level buyers face affordability barriers. Price sensitivity limits adoption in emerging regions. Financing options remain limited in some markets. High maintenance perception deters first-time buyers. Used bicycle markets compete with new sales. Pricing pressure affects volume growth potential.
Supply Chain Complexity And Component Availability Constraints
The Global Gravel Bikes Market encounters supply chain issues. Component shortages disrupt production schedules. Dependence on global suppliers increases risk. Shipping delays affect inventory planning. Smaller brands face sourcing disadvantages. Currency volatility impacts component costs. Lead times extend for premium parts. Retailers manage uneven stock availability. These constraints challenge consistent market expansion.
Market Opportunities:
Untapped Potential In Emerging Economies With Expanding Cycling Culture
The Global Gravel Bikes Market holds opportunity in emerging regions. Urban cycling adoption rises in developing countries. Middle-income consumers seek lifestyle bicycles. Tourism routes support off-road cycling interest. Government cycling initiatives improve infrastructure. Local brands enter value-oriented segments. Retail networks expand into secondary cities. Education campaigns increase category awareness. These factors support long-term demand creation.
Product Innovation For Women, Youth, And Age-Specific Rider Segments
The Global Gravel Bikes Market can expand through inclusive design. Women-specific geometry gains attention among brands. Youth-focused gravel models remain limited. Older riders seek comfort-oriented configurations. Adjustable components support broader fit ranges. Lightweight designs reduce physical strain. Marketing targets underserved demographics. Inclusive portfolios increase total addressable customers. This opportunity supports sustainable growth paths.
Market Segmentation Analysis:
By Bike Type
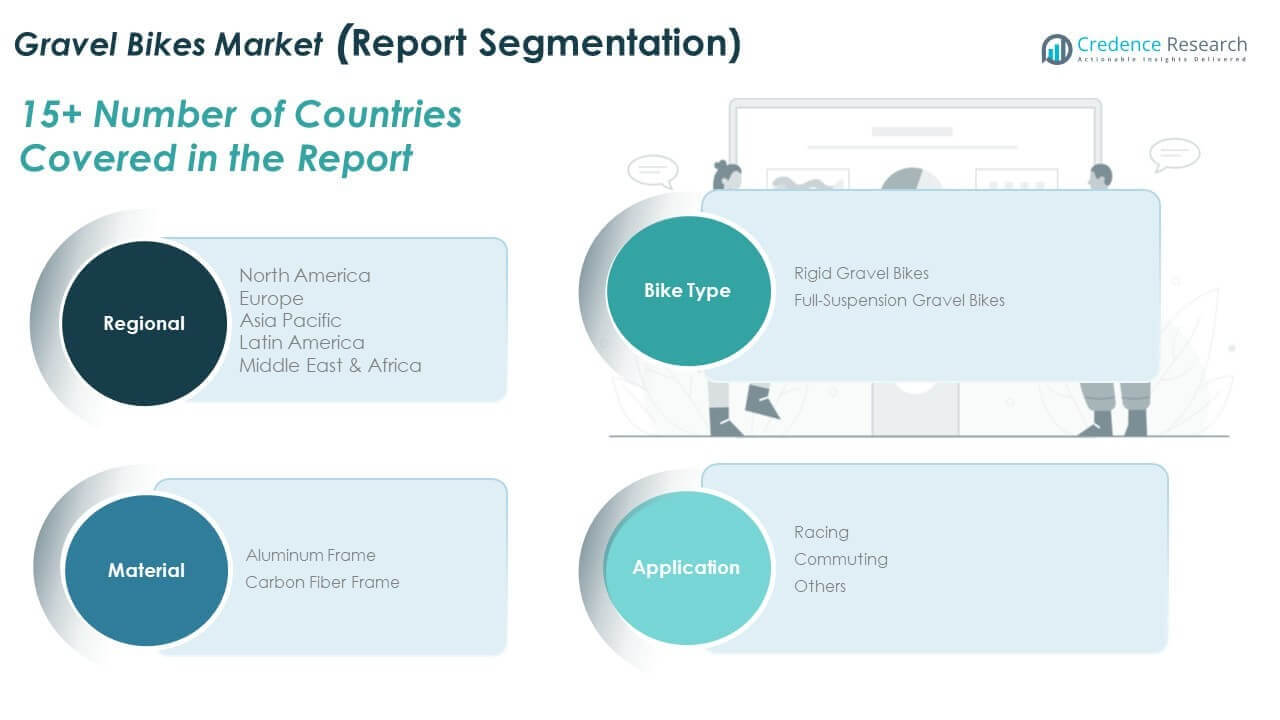
Rigid gravel bikes dominate due to their lightweight frames and mechanical simplicity. These models appeal to riders seeking speed on hard-packed trails and road segments. Their lower maintenance and affordability increase accessibility for new cyclists. Full-suspension gravel bikes cater to advanced riders navigating technical off-road terrain. These models improve control and comfort on rocky and uneven paths. Manufacturers focus on integrating suspension without compromising weight. Full-suspension options gain popularity in premium and racing segments. The Global Gravel Bikes Market reflects clear differentiation between these sub-categories based on rider type and terrain.
- For instance, OPEN Cycle’s O‑1.0 was marketed as one of the lightest 29‑inch hardtail production frames, enhancing efficiency on hard trails. These models appeal to riders seeking speed on hard‑packed trails and road segments.
By Material
Aluminum frame bikes remain the volume leader across mid-range and entry-level categories. Their durability and price-performance ratio appeal to commuters and recreational cyclists. Brands offer aluminum frames with improved geometry and internal cable routing. Carbon fiber frames dominate the high-performance segment due to superior stiffness-to-weight ratio. Cyclists prefer carbon for racing and endurance rides. It supports better vibration absorption and ride comfort. Leading brands invest in frame engineering to increase impact resistance. Carbon demand grows as consumers upgrade for performance.
- For instance, Trek’s aluminum Checkpoint ALR models offer generous tire clearance and robust frame design, making them preferred for mixed use. Brands offer aluminum frames with improved geometry and internal cable routing.
By Application
Racing leads in application share, driven by growing gravel endurance events and sports tourism. Riders demand responsive geometry and high-spec components for competitive use. Commuting forms the next key segment, supported by urban infrastructure development and poor road quality. Gravel bikes offer a versatile solution for daily riders. The “Others” category includes leisure, touring, and adventure cycling. It captures demand for weekend rides, bikepacking, and fitness exploration, contributing to market expansion across rider profiles.
Segmentation:
By Bike Type
- Rigid Gravel Bikes
- Full-Suspension Gravel Bikes
By Material
- Aluminum Frame
- Carbon Fiber Frame
By Application
- Racing
- Commuting
- Others
By Regional
- North America
- U.S.
- Canada
- Mexico
- Europe
- Germany
- France
- U.K.
- Italy
- Spain
- Rest of Europe
- Asia Pacific
- China
- Japan
- India
- South Korea
- South-east Asia
- Rest of Asia Pacific
- Latin America
- Brazil
- Argentina
- Rest of Latin America
- Middle East & Africa
- GCC Countries
- South Africa
- Rest of the Middle East and Africa
Regional Analysis:
North America
The North America Gravel Bikes Market size was valued at USD 179.61 million in 2018 to USD 285.73 million in 2024 and is anticipated to reach USD 535.50 million by 2032, at a CAGR of 8.2% during the forecast period. North America accounts for around 19.4% of the Global Gravel Bikes Market share. The U.S. leads demand, driven by recreational cycling, gravel racing events, and vast trail networks. Consumers show high interest in endurance biking, supported by bikepacking and off-road touring trends. State-level infrastructure improvements and active transport incentives increase adoption. Retailers promote gravel models through demos and media collaborations. E-bike integration into gravel categories gains early interest. Canada supports demand with strong outdoor culture and seasonal cycling trends. Mexico remains price-sensitive but shows growth through urban riders and adventure tourism. Market players emphasize innovation, weight reduction, and local partnerships.
Europe
The Europe Gravel Bikes Market size was valued at USD 229.22 million in 2018 to USD 352.87 million in 2024 and is anticipated to reach USD 633.50 million by 2032, at a CAGR of 7.6% during the forecast period. Europe contributes nearly 24% of the Global Gravel Bikes Market share. Germany, France, and the UK are primary markets, supported by cycling-friendly infrastructure and environmental policies. European consumers adopt gravel bikes for long-distance touring and commuting. Governments promote cycling as a carbon-neutral mobility solution. Local events and tours attract riders to explore regional trails. Manufacturers focus on carbon frames, electronic shifting, and disc brake integration. Italy and Spain gain momentum through tourism and lifestyle biking. Eastern Europe shows steady growth with rising sports enthusiasm. Cross-country gravel usage blurs racing and leisure applications.
Asia Pacific
The Asia Pacific Gravel Bikes Market size was valued at USD 356.85 million in 2018 to USD 524.42 million in 2024 and is anticipated to reach USD 880.63 million by 2032, at a CAGR of 6.7% during the forecast period. Asia Pacific holds the largest share at 35.5% of the Global Gravel Bikes Market. China and Japan drive volume through urban mobility and fitness trends. Riders favor gravel bikes for versatility across changing road surfaces. Australia’s cycling community promotes adventure rides and endurance events. South Korea and Taiwan support high-end bike manufacturing and local adoption. India shows growing interest in gravel riding through community-led awareness campaigns. Southeast Asia sees gradual uptake through eco-tourism and cross-border cycling trails. Strong OEM presence in the region supports both demand and supply ecosystems. Distribution expansion helps brands penetrate second-tier cities.
Latin America
The Latin America Gravel Bikes Market size was valued at USD 102.45 million in 2018 to USD 185.69 million in 2024 and is anticipated to reach USD 401.63 million by 2032, at a CAGR of 10.1% during the forecast period. Latin America accounts for around 13.2% of the Global Gravel Bikes Market. Brazil leads demand due to cycling clubs, tourism, and growing awareness of adventure sports. Argentina follows with rising recreational biking culture. Countries like Colombia and Chile invest in trail routes and open-road biking infrastructure. Import dependency and pricing remain constraints across the region. Regional distributors focus on aluminum-frame models for value buyers. Social media and local events raise interest among young riders. Hybrid usage across commuting and touring segments supports product traction. The market shows strong potential with expanding trail accessibility.
Middle East
The Middle East Gravel Bikes Market size was valued at USD 64.43 million in 2018 to USD 102.85 million in 2024 and is anticipated to reach USD 193.58 million by 2032, at a CAGR of 8.3% during the forecast period. The Middle East holds around 7% of the Global Gravel Bikes Market share. GCC countries invest in cycling tracks, events, and wellness-focused mobility. UAE and Saudi Arabia host gravel biking tours and competitive events. Harsh terrain and seasonal variability support off-road bike adoption. Consumers seek high-spec models with comfort and speed. Local cycling clubs promote gravel as a fitness and adventure tool. Distribution networks expand in response to interest from expatriate and local riders. Brands introduce models tailored for sand and mixed surfaces. Infrastructure growth continues to unlock market expansion.
Africa
The Africa Gravel Bikes Market size was valued at USD 17.77 million in 2018 to USD 23.47 million in 2024 and is anticipated to reach USD 32.67 million by 2032, at a CAGR of 4.2% during the forecast period. Africa holds the smallest share at 1.8% of the Global Gravel Bikes Market. South Africa drives regional demand through active tourism and local riding communities. Kenya and Egypt show gradual uptake in urban and peri-urban areas. Road conditions favor gravel bikes for reliability and comfort. Affordability remains a major barrier for wider adoption. NGOs and bike-sharing initiatives create awareness. Import duties and fragmented retail networks challenge accessibility. Market entry strategies rely on local partnerships and event-based promotion. Growth potential remains tied to infrastructure, awareness, and affordability.
Key Player Analysis:
- Trek Bikes
- Merida Bike
- Cube Bikes
- Fuji Bikes
- KHS Bicycles
- Xidesheng Bicycle
- YT Industries
- Atlas
- Giant Bicycles
- Other Key Players
Competitive Analysis:
The Global Gravel Bikes Market features intense competition among global and regional brands focused on product innovation and niche targeting. Leading companies compete on material quality, bike geometry, suspension tech, and weight optimization. Players such as Trek, Giant, Merida, and Fuji drive advancement through R&D and sponsorships. Smaller brands emphasize customization, direct-to-consumer sales, and lifestyle marketing. It continues to see rising activity in full-suspension innovation and gravel-specific groupsets. Strategic alliances and e-commerce channels shape visibility and reach. Price positioning plays a major role in segment penetration. The market structure favors a mix of high-volume OEMs and boutique performance brands.
Recent Developments:
- In December 2025, Focus updated the Atlas gravel bike for 2026 with refined geometry, including shorter wheelbase and lower stack for better agility on the 6 Series aluminum and 8 Series carbon models. Changes abandon Road Boost for standard thru-axles, retain extensive mounting points for bikepacking, and offer builds from €2,299 to €5,299. The design prioritizes comfort, speed, and adventure versatility.
- In October 2025, Cube revealed details on its 2026 gravel bikes, blending road speed with mountain bike robustness using C:62 carbon and aluminum frames. Key features include up to 50mm tire clearance, gravel-specific geometry, and options like GRX Di2 for high-end or mechanical GRX for accessibility. This targets both competitive and casual gravel riders across price points.
- In October 2025, Trek Bikes launched the new Checkpoint+ SL 6 AXS, their first electric-assist gravel bike, now available for 2026 Trek Travel trips. This model features advanced gravel capabilities paired with SRAM's AXS wireless shifting through a key partnership upgrade. The bikes emphasize top performance for rugged terrain and smooth gear changes.
- In July 2025, Merida announced its structured gravel program for the 2026 model year, including top models with Zipp 303 XPLR wheels and race gravel tires. Updates feature Reynolds G30 wheels and the new 1P GR Carbon cockpit for improved ergonomics. A third gravel segment was planned for fall 2025 under embargo.
Report Coverage:
The research report offers an in-depth analysis based on Bike Type, Material, and Application segments. It details leading market players, providing an overview of their business, product offerings, investments, revenue streams, and key applications. Additionally, the report includes insights into the competitive environment, SWOT analysis, current market trends, as well as the primary drivers and constraints. Furthermore, it discusses various factors that have driven market expansion in recent years. The report also explores market dynamics, regulatory scenarios, and technological advancements that are shaping the industry. It assesses the impact of external factors and global economic changes on market growth. Lastly, it provides strategic recommendations for new entrants and established companies to navigate the complexities of the market.
Future Outlook:
- Manufacturers will prioritize lightweight, aerodynamic frame designs that support both endurance and speed performance.
- Integration of advanced components such as electronic shifting and hydraulic disc brakes will become standard in mid-to-high-end models.
- Full-suspension gravel bikes will witness strong adoption across technical terrain markets and long-distance adventure segments.
- Urban commuters will continue choosing gravel bikes for their durability on poor road surfaces and multi-terrain capability.
- Product development will focus on women-specific and age-inclusive designs to expand the target consumer base.
- Asia Pacific will lead volume growth due to a rising middle class, improved infrastructure, and strong OEM presence.
- Retail channels will evolve, with direct-to-consumer and online custom configurators gaining popularity among younger demographics.
- Sustainability practices in frame material sourcing, packaging, and manufacturing will influence brand selection and loyalty.
- Evolving gravel race formats and bikepacking events will boost demand for premium performance models globally.
- Partnerships between brands and digital navigation or GPS service providers will enhance product utility for touring and competition riders.
Request a Free Sample
Fill in your details and we'll send you a free sample report.
- Sample data tables & charts
- Research methodology
Need a Custom Version of This Report?
Tailor the scope, geography, or segments to your exact requirements.
- Custom geography or segment scope
- Direct access to our analyst team
Frequently Asked Questions
What is the current market size for Global Gravel Bikes Market, and what is its projected size in 2032?
At what Compound Annual Growth Rate is the Global Gravel Bikes Market projected to grow between 2025 and 2032?
Which Global Gravel Bikes Market segment held the largest share in 2024?
What are the primary factors fueling the growth of the Global Gravel Bikes Market?
Who are the leading companies in the Global Gravel Bikes Market?
Which region commanded the largest share of the Global Gravel Bikes Market in 2024?
Table of Content
Chapter 1. Report Introduction
- 1.1 Report Description & Purpose
- 1.1.1 Report Title & Market Definition
- 1.1.2 Unique Selling Propositions (USP) & Key Differentiators
- 1.1.3 Value Proposition for Stakeholders
- 1.2 Research Objectives
- 1.2.1 Market Sizing Objectives (Volume & Revenue)
- 1.2.2 Segmentation Objectives
- 1.2.3 Competitive Intelligence Objectives
- 1.2.4 Forecast & Scenario Objectives
- 1.3 Report Scope
- 1.3.1 Gravel Bikes Scope – Types & Subtypes Covered
- 1.3.2 Geographic Scope – Regions & Countries Covered
- 1.3.3 Historical Period, Base Year & Forecast Period (2018; forecast to 2032)
- 1.3.4 Inclusions & Exclusions
- 1.4 HS Code & Classification Framework
- 1.5 Currency, Units & Pricing Basis
- 1.6 Target Stakeholders
- 1.7 Limitations & Assumptions
Chapter 2. Executive Summary
- 2.1 Global Gravel Bikes Market Snapshot
- 2.1.1 Market Size – Historical (2018) & Forecast (2018-2032) (2018: USD 950.3 million → 2032: USD 2,677.5 million)
- 2.1.2 Volume & Revenue – Global Totals
- 2.1.3 Key Market Highlights – Top Five Facts
- 2.2 Gravel Bikes Market Segmentation Snapshot
- 2.2.1 Market Split by Region – 2018 vs. 2032
- 2.3 Competitive Snapshot
- 2.3.1 Top 10 Players by Revenue Share – 2018
- 2.3.2 Top 10 Players by Volume Share – 2018
- 2.3.3 Recent Strategic Developments (18-Month Summary)
- 2.4 Key Investment Highlights & Strategic Conclusions
Chapter 3. Gravel Bikes Market Dynamics & Industry Analysis
- 3.1 Market Overview & Context
- 3.1.1 Gravel Bikes Market Position in the Broader Automotive Value Chain
- 3.1.2 OEM vs. Replacement Market Dynamics
- 3.1.3 Market Maturity & Development Stage by Region
- 3.2 Gravel Bikes Market Drivers
- 3.3 Gravel Bikes Market Restraints & Challenges
- 3.4 Gravel Bikes Market Opportunities
- 3.5 Porter's Five Forces Analysis
- 3.5.1 Threat of New Entrants
- 3.5.2 Bargaining Power of Suppliers
- 3.5.3 Bargaining Power of Buyers
- 3.5.4 Threat of Substitutes
- 3.5.5 Competitive Rivalry – Intensity Assessment
- 3.6 Gravel Bikes Value Chain Analysis
- 3.6.1 Upstream – Raw Material/Input Suppliers
- 3.6.1.1 Raw Material/Input 1
- 3.6.1.2 Raw Material/Input 2
- 3.6.1.3 Raw Material/Input 3
- 3.6.2 Midstream – Production/Manufacturing/Service Delivery
- 3.6.2.1 Production/Process Overview
- 3.6.2.2 Key Facility Locations & Capacity by Manufacturer
- 3.6.3 Downstream – Distribution & End Consumer
- 3.6.3.1 Primary Channel – B2B/OEM
- 3.6.3.2 Secondary Channels – Dealer, Retail, Online, Direct
- 3.6.4 Value Chain Profitability Analysis
- 3.6.1 Upstream – Raw Material/Input Suppliers
- 3.7 PESTEL Analysis
- 3.7.1 Political Factors
- 3.7.2 Economic Factors
- 3.7.3 Social Factors
- 3.7.4 Technological Factors
- 3.7.5 Environmental Factors
- 3.7.6 Legal Factors
- 3.8 Gravel Bikes Supply Chain Analysis
- 3.8.1 Raw Material/Input Supply Risk Assessment
- 3.8.2 Manufacturing Concentration Risk (Geographic Exposure)
- 3.8.3 Trade Disruption Impact Analysis
- 3.9 Regulatory & Policy Landscape
Note: The regulatory and policy landscape section covers regulations based on their applicability to the market, Gravel Bikes category, geography, and scope of the study. Only regulatory frameworks with a material impact on operations, compliance, trade, sustainability, or market access are analyzed in detail.
Chapter 4. Key Investment Pockets & Opportunity Analysis
- 4.1 Gravel Bikes Market Attractiveness Analysis
- 4.1.1 By Region – Investment Attractiveness Matrix (Volume × CAGR)
- 4.2 Absolute Revenue Growth Opportunity
- 4.2.1 By Region – Absolute USD Growth Through 2032
- 4.3 Incremental Volume Opportunity
- 4.3.1 By Region – Incremental Volume Through 2032
- 4.3.2 Segment – Incremental Volume
- 4.4 Emerging Submarket Opportunity Deep Dive (Subject to Applicability)
- 4.5 Emerging Market Opportunity Scorecards
- 4.5.1 United States
- 4.5.2 Europe
- 4.5.3 Asia
- 4.5.4 Middle East & Africa
Note: Emerging Market Opportunity Scorecards will be included based on relevance and strategic importance. Regions listed are indicative and may vary depending on data availability and market dynamics.
Chapter 5. Gravel Bikes Import-Export Analysis & Trade Flows
- 5.1 Global Trade Overview
- 5.1.1 Global Export Value by Country (2018)
- 5.1.2 Global Export Volume by Country (2018)
- 5.1.3 Global Import Value by Country (2018)
- 5.1.4 Global Import Volume by Country (2018)
- 5.1.5 Net Trade Balance by Country (2018)
- 5.2 Export Analysis – Segment
- 5.2.1 Type 1 (HS Code)
- 5.2.2 Type 2 (HS Code)
- 5.2.3 Type 3 (HS Code)
- 5.2.4 Type 4 (HS Code)
- 5.2.5 Type 5 (HS Code)
- 5.3 Import Analysis – Segment
- 5.3.1 Type 1 (HS Code)
- 5.3.2 Type 2 (HS Code)
- 5.3.3 Type 3 (HS Code)
- 5.3.4 Type 4 (HS Code)
- 5.3.5 Type 5 (HS Code)
- 5.4 Average Unit Trade Prices
- 5.4.1 Average Export Price – Segment & Country
- 5.4.2 Average Import Price – Segment & Source Country
- 5.4.3 Price Trends (2018)
- 5.5 Key Trade Route Analysis
- 5.5.1 Trade Route 1
- 5.5.2 Trade Route 2
- 5.5.3 Trade Route 3
- 5.5.4 Trade Route 4
- 5.5.5 Trade Route 5
- 5.6 Trade Policy Impact Assessment
- 5.6.1 US Anti-Dumping & Section 301 Tariffs
- 5.6.2 EU Customs Union Impact
- 5.6.3 Major Free Trade Agreements
- 5.6.4 USMCA Rules of Origin
Note: Trade policy analysis will be included only where relevant to the Gravel Bikes market.
Chapter 6. Competitive Landscape & Company Benchmarking
- 6.1 Gravel Bikes Market Concentration & Structure
- 6.1.1 Herfindahl-Hirschman Index (HHI) – vs. 2018
- 6.1.2 Tier 1, Tier 2 & Tier 3 Market Structure
- 6.1.3 Global, Regional & Local Player Dynamics
- 6.2 Gravel Bikes Market Share Analysis – 2018
- 6.2.1 Global Revenue Share by Company
- 6.2.2 Global Volume Share by Company
- 6.2.3 Regional Revenue Share
- 6.2.4 Market Share Evolution ( vs. 2018)
- 6.2.5 OEM Segment Share by Company
- 6.2.6 Replacement Segment Share by Company
- 6.3 Production/Delivery Capacity & Facility Analysis
- 6.3.1 Global Installed Capacity
- 6.3.2 Capacity Utilization Rates
- 6.3.3 Production/Output Volume
- 6.3.4 Facility Locations & Capacity Map
- 6.3.5 Planned Capacity Additions
- 6.4 Gravel Bikes Competitive Benchmarking Matrix
- 6.4.1 Revenue, Volume, CAGR & Profitability Comparison
- 6.4.2 Channel Revenue Mix
- 6.4.3 Geographic Revenue Exposure
- 6.4.4 R&D Intensity
- 6.4.5 Sustainability Maturity
- 6.5 Strategic Developments in Gravel Bikes (Last 24 Months)
- 6.5.1 Mergers, Acquisitions & Divestments
- 6.5.2 New Gravel Bikes Launches
- 6.5.3 Facility Expansions
- 6.5.4 Strategic Alliances, Joint Ventures & Partnerships
- 6.5.5 Distribution Expansion & Market Entry
- 6.5.6 Sustainability & ESG Initiatives
- 6.6 Competitive Strategy Mapping
- 6.6.1 Leader, Challenger, Follower & Niche Classification
- 6.6.2 Pricing Strategy Comparison
- 6.6.3 Channel Strategy Matrix
Note: Strategic developments are included based on their materiality and the availability of reliable information.
Chapter 7. Global Gravel Bikes Market – By Distribution Channel
- 7.1 Segment Overview
- 7.1.1 Volume & Revenue Split by Channel (2018 & 2032)
- 7.1.2 Channel Mix Evolution (2018-2032)
Chapter 8. Regional Market Analysis – Global Overview
- 8.1 Global Regional Overview
- 8.1.1 Regional Volume Share
- 8.1.2 Regional Revenue Share
- 8.1.3 Regional Volume by Region
- 8.1.4 Regional Revenue by Region
- 8.1.5 Regional Forecast Through 2032
- 8.2 Cross-Regional Segment Analysis
- 8.2.1 By Distribution Channel
- 8.2.2 By Brand/Price Tier
Chapter 9. North America Gravel Bikes Market
- 9.1 United States
- 9.2 Canada
- 9.3 Mexico
Chapter 10. Europe Gravel Bikes Market
- 10.1 Germany
- 10.2 France
- 10.3 Italy
- 10.4 United Kingdom
- 10.5 Spain
- 10.6 Poland
- 10.7 Russia
- 10.8 Netherlands
- 10.9 Belgium
- 10.10 Sweden
- 10.11 Denmark
- 10.12 Norway
- 10.13 Rest of Europe
Chapter 11. Asia Pacific Gravel Bikes Market
- 11.1 China
- 11.2 India
- 11.3 Japan
- 11.4 South Korea
- 11.5 Thailand
- 11.6 Indonesia
- 11.7 Vietnam
- 11.8 Malaysia
- 11.9 Australia
- 11.10 Rest of Asia Pacific
Chapter 12. Latin America Gravel Bikes Market
- 12.1 Brazil
- 12.2 Argentina
- 12.3 Colombia
- 12.4 Chile
- 12.5 Rest of Latin America
Chapter 13. Middle East Gravel Bikes Market
- 13.1 Saudi Arabia
- 13.2 United Arab Emirates
- 13.3 Turkey
- 13.4 Israel
- 13.5 Iran
- 13.6 Rest of the Middle East
Chapter 14. Africa Gravel Bikes Market
- 14.1 South Africa
- 14.2 Egypt
- 14.3 Nigeria
- 14.4 Morocco
- 14.5 Rest of Africa
Chapter 15. Gravel Bikes Company Profiles
- 15.1 [Company 01]
- 15.1.1 Company Overview
- 15.1.2 Key Management Personnel
- 15.1.3 Products & Services Portfolio
- 15.1.4 Financial Performance
- 15.1.5 Key Market Focus & Geographic Presence
- 15.1.6 Recent Developments & Strategic Initiatives
Note: The company profile list is preliminary and may change based on research findings, market developments, data availability, and client requirements.
Chapter 16. Appendices
- Appendix A – List of Abbreviations & Acronyms
- Appendix B – Industry Classification Code Reference – Full Series
- Appendix C – Production & Capacity Data Tables
- Appendix D – End-Use & Demand Base Tables
- Appendix E – Consumption & Replacement Rate Assumptions
- Appendix F – ASP Reference Tables
- Appendix G – Manufacturing & Facility Database
- Appendix H – Import-Export Data Tables
- Appendix I – Regulatory Summary Tables
- Appendix J – Primary Research Participant List (Anonymized)
- Appendix K – Primary Research Questionnaire Framework
- Appendix L – Data Sources & Bibliography
- Appendix M – Market Size Divergence & Source Comparison
Chapter 17. Research Methodology
- 17.1 Research Framework & Philosophy
- 17.2 Secondary Research – Sources, Hierarchy & Data Extraction
- 17.3 Data Modeling – Bottom-Up & Top-Down Market Sizing
- 17.4 Primary Research – Stakeholder Framework, LOI & Sample Sizes
- 17.5 Forecast Methodology – Regression, Scenario & Sensitivity Analysis
- 17.6 Quality Control – Four-Layer Validation Framework
- 17.7 Limitations & Standard Assumptions
- 17.8 Disclaimer
