India K-beauty product demand moves past the metros
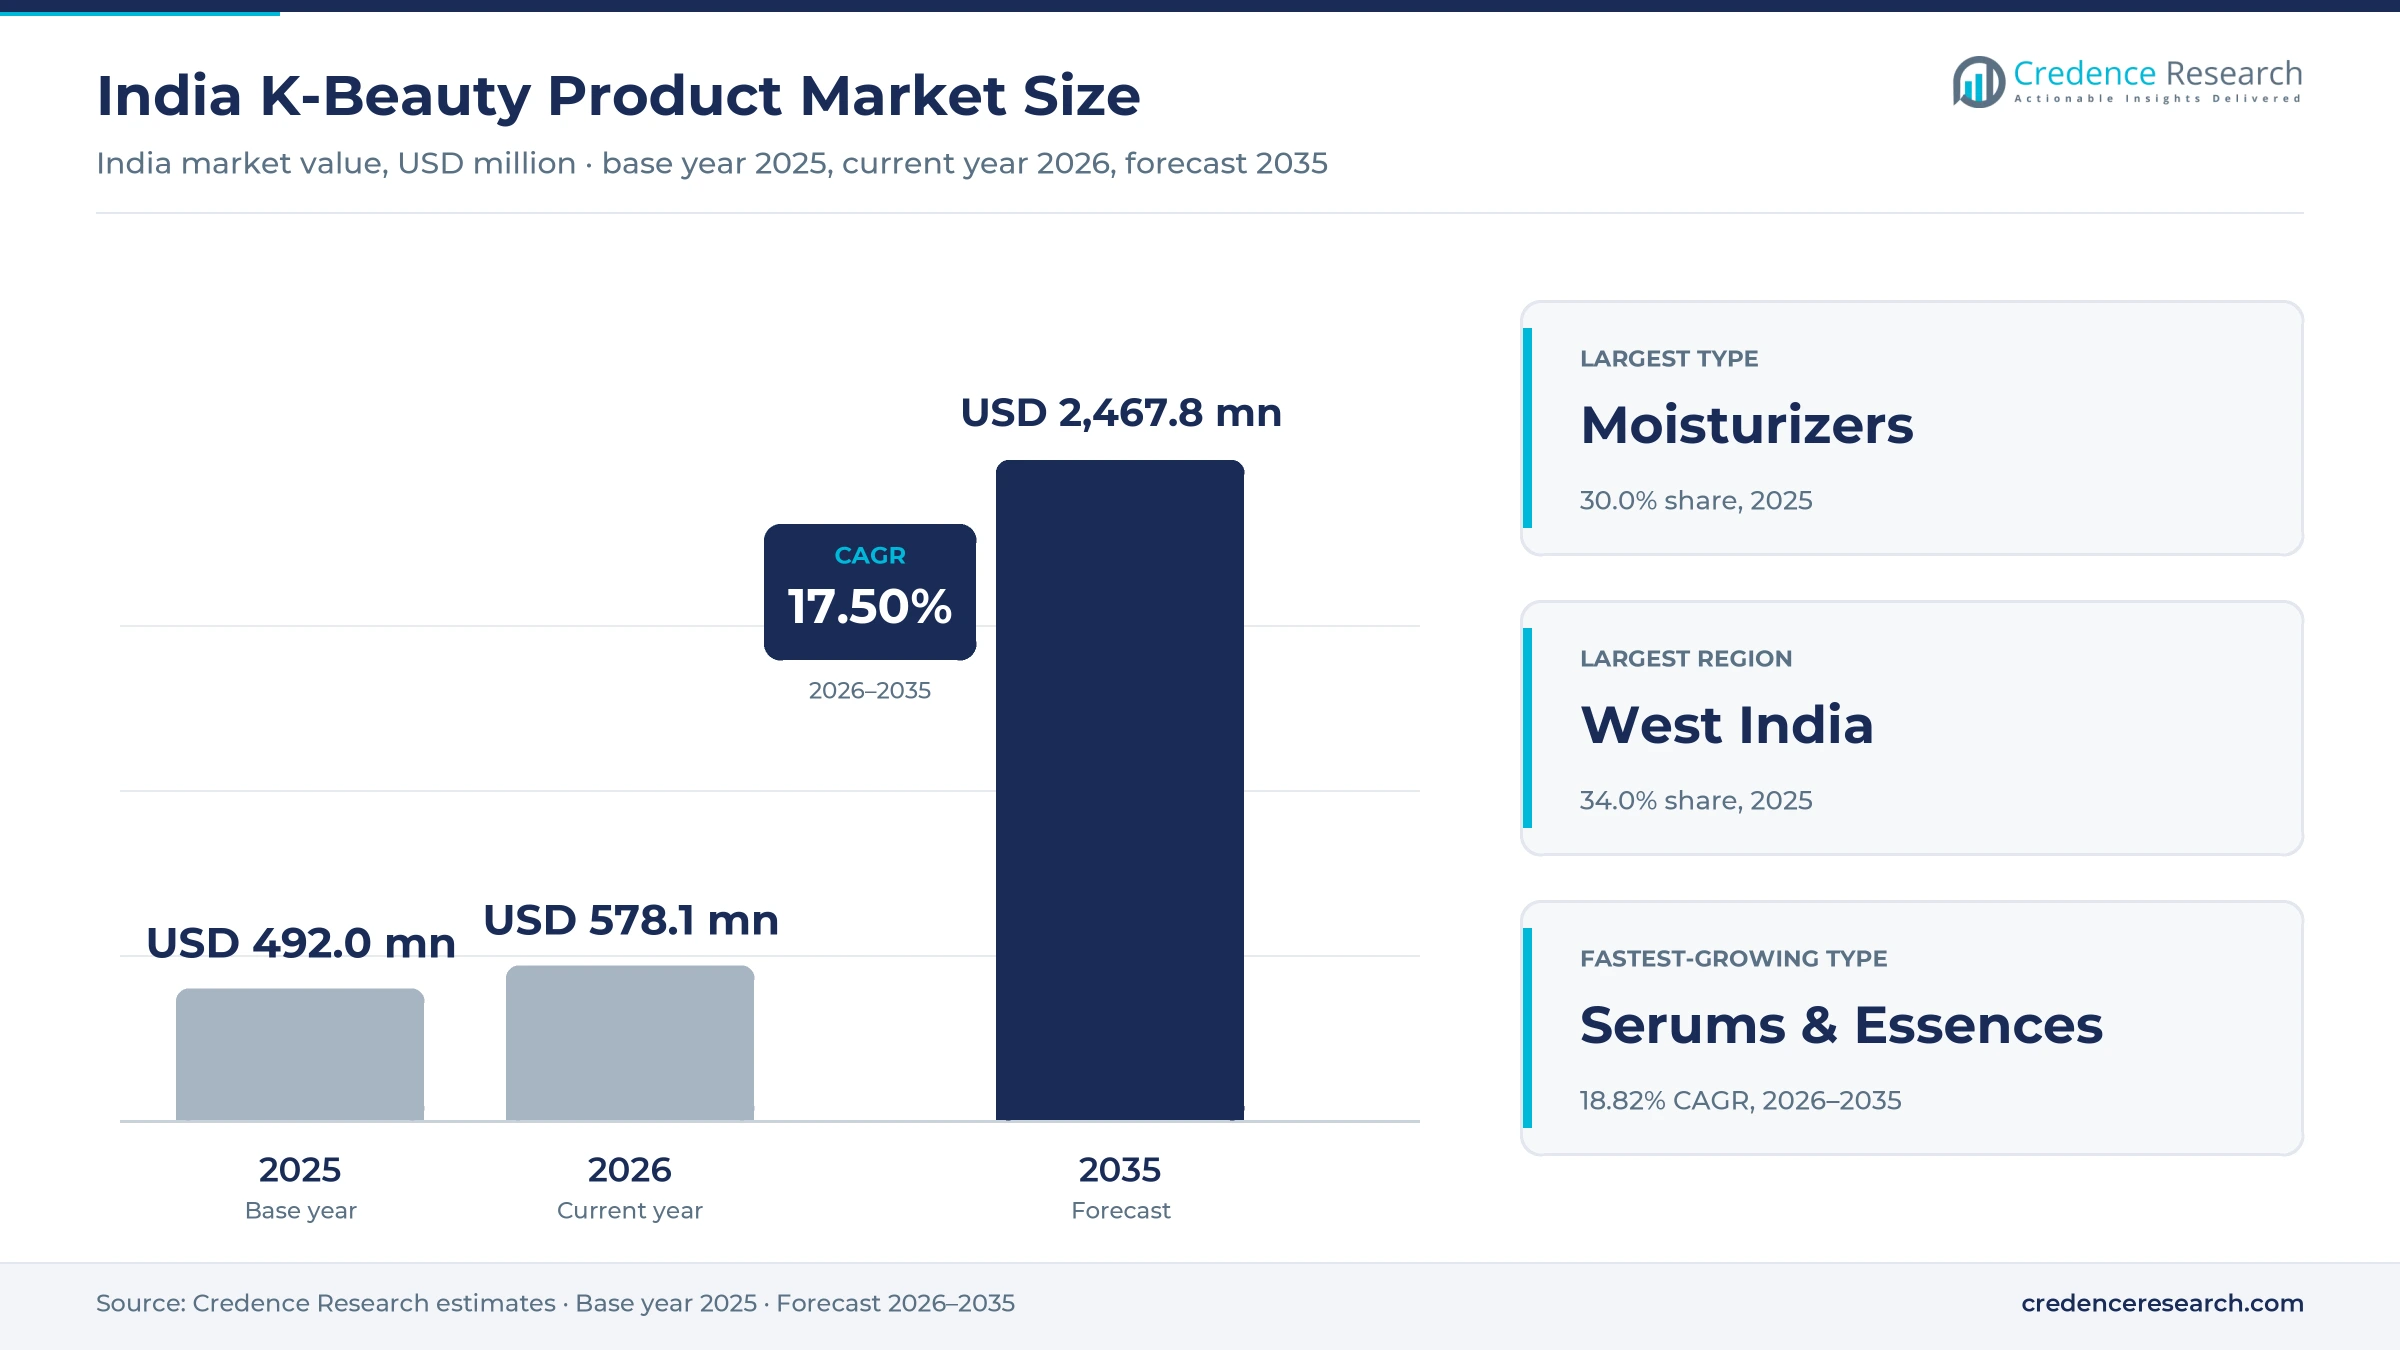
The India K-beauty product market was valued at USD 492.0 million in 2025 and is projected to increase from USD 578.1 million in 2026 to USD 2.47 billion by 2035, registering a CAGR of 17.50% during 2026–2035. Demand comes from younger Indian shoppers who buy barrier creams, serums, cleansers and sun care through Nykaa, Tira, Myntra and Amazon, with Myntra reporting 200% annual K-beauty demand growth between August 2025 and August 2026. West India held the largest regional share, 34.0% in 2025, because Mumbai anchors premium beauty retail and Cosmax planned its Indian subsidiary there. South India is the fastest-growing region at 18.38% a year, helped by Bengaluru hosting Nykaa's K-Beauty Festival in September 2026. Supply is changing as well, since India's imports of Korean skin care and make-up under HS 330499 rose from USD 37.65 million in 2023 to USD 63.02 million in 2024, according to World Integrated Trade Solution data, which made Korea the largest supplier that year.
What does this market count, and how large is the wider Indian beauty category?
The India K-beauty product market counts retail value of Korean-brand skin care, cleansing, mask, serum and related products sold in India through online platforms, multibrand stores, monobrand stores and professional outlets. It sits inside a much wider category, because the India Brand Equity Foundation projects Indian beauty and personal care to grow from USD 28 billion in 2024 to USD 34 billion in 2028, as cited by The Korea Times in March 2026.
The estimate excludes Indian brands that only borrow Korean styling, along with clinic service fees and powered beauty tools. Tools stay outside because APR, the Medicube owner, was not selling its devices in India when Digital Today reported its entry in March 2026. The value chain runs from Korean brand owners and contract makers through registered importers to platforms such as Nykaa and Tira.
India K-Beauty Product Market Insights
- The market grows from USD 492.0 million in 2025 to USD 2.47 billion by 2035, a 17.50% CAGR that reflects Korean brands moving from niche imports into mainstream Indian retail.
- West India held 34.0% of 2025 value, because Mumbai combines premium beauty retail, early Tira placements and a planned Cosmax subsidiary serving Indian brand clients.
- Moisturizers held 30.0% of 2025 value, as Aestura and Illiyoon launches on Nykaa pushed barrier care into the center of Korean skin care routines.
- Nykaa's offline estate reached 338 stores by Sept. 30, 2026, which moved Korean ranges from online discovery into physical testing and supervised selling across more Indian cities.
- Amorepacific, APR, Goodai Global, The Founders and Craver compete largely through Nykaa and Tira, so exclusive platform deals now decide much of the early brand access.
Barrier creams lead as serums gain ground
Why do moisturizers lead while serums gain?
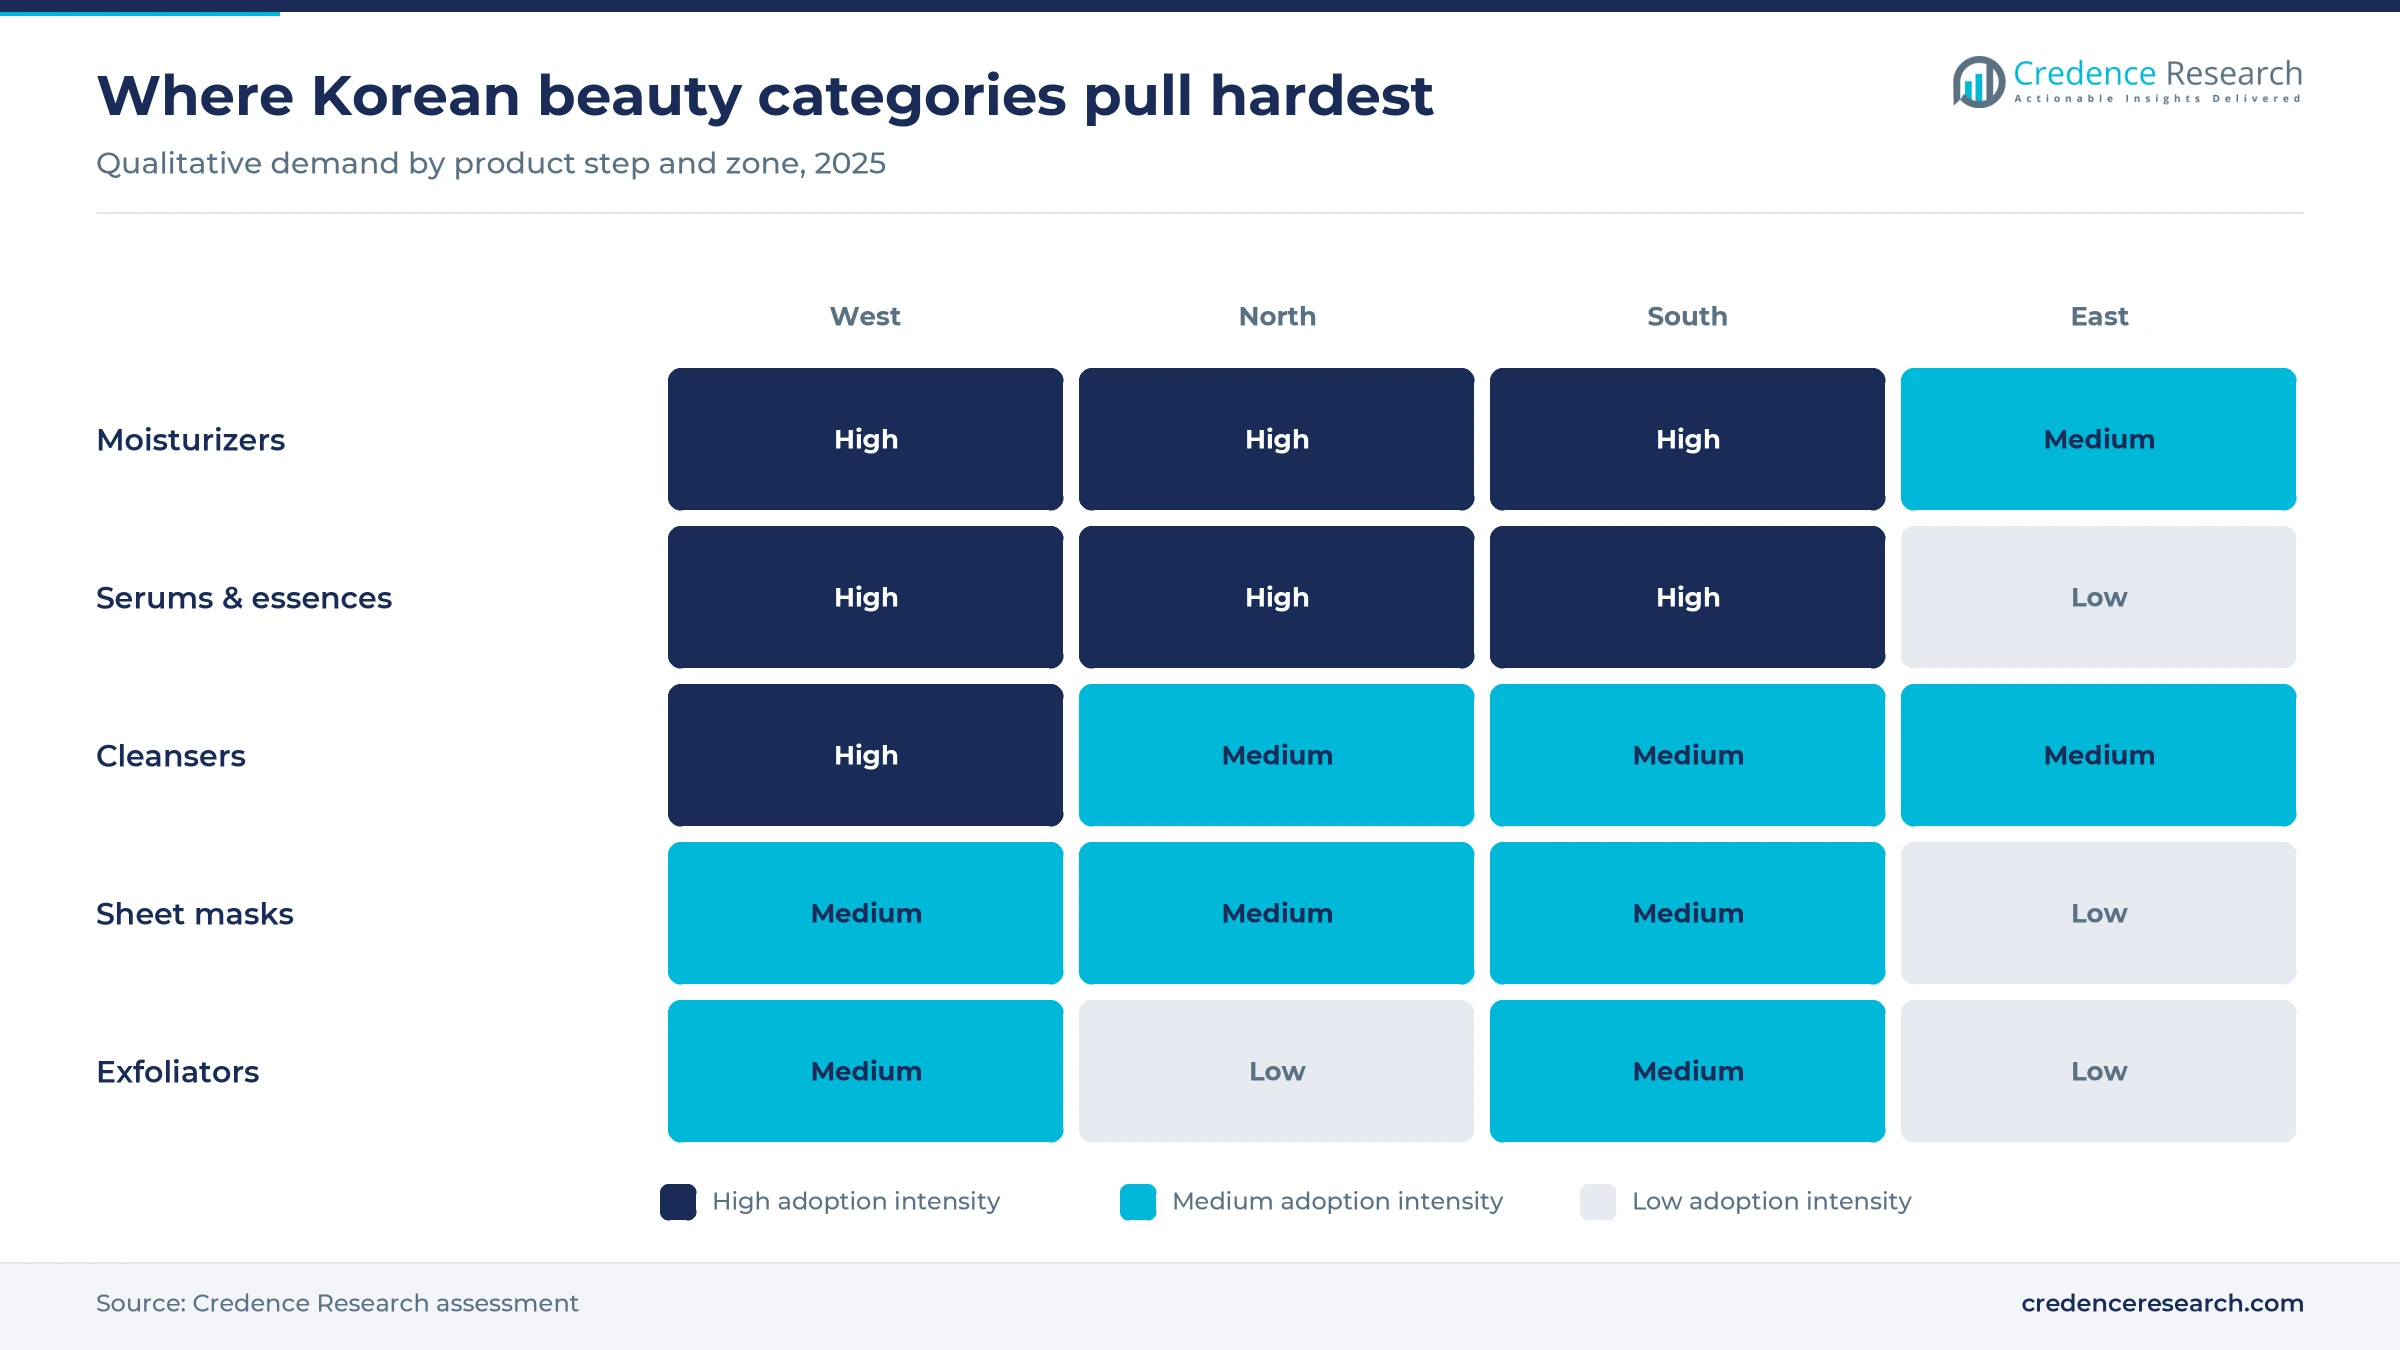
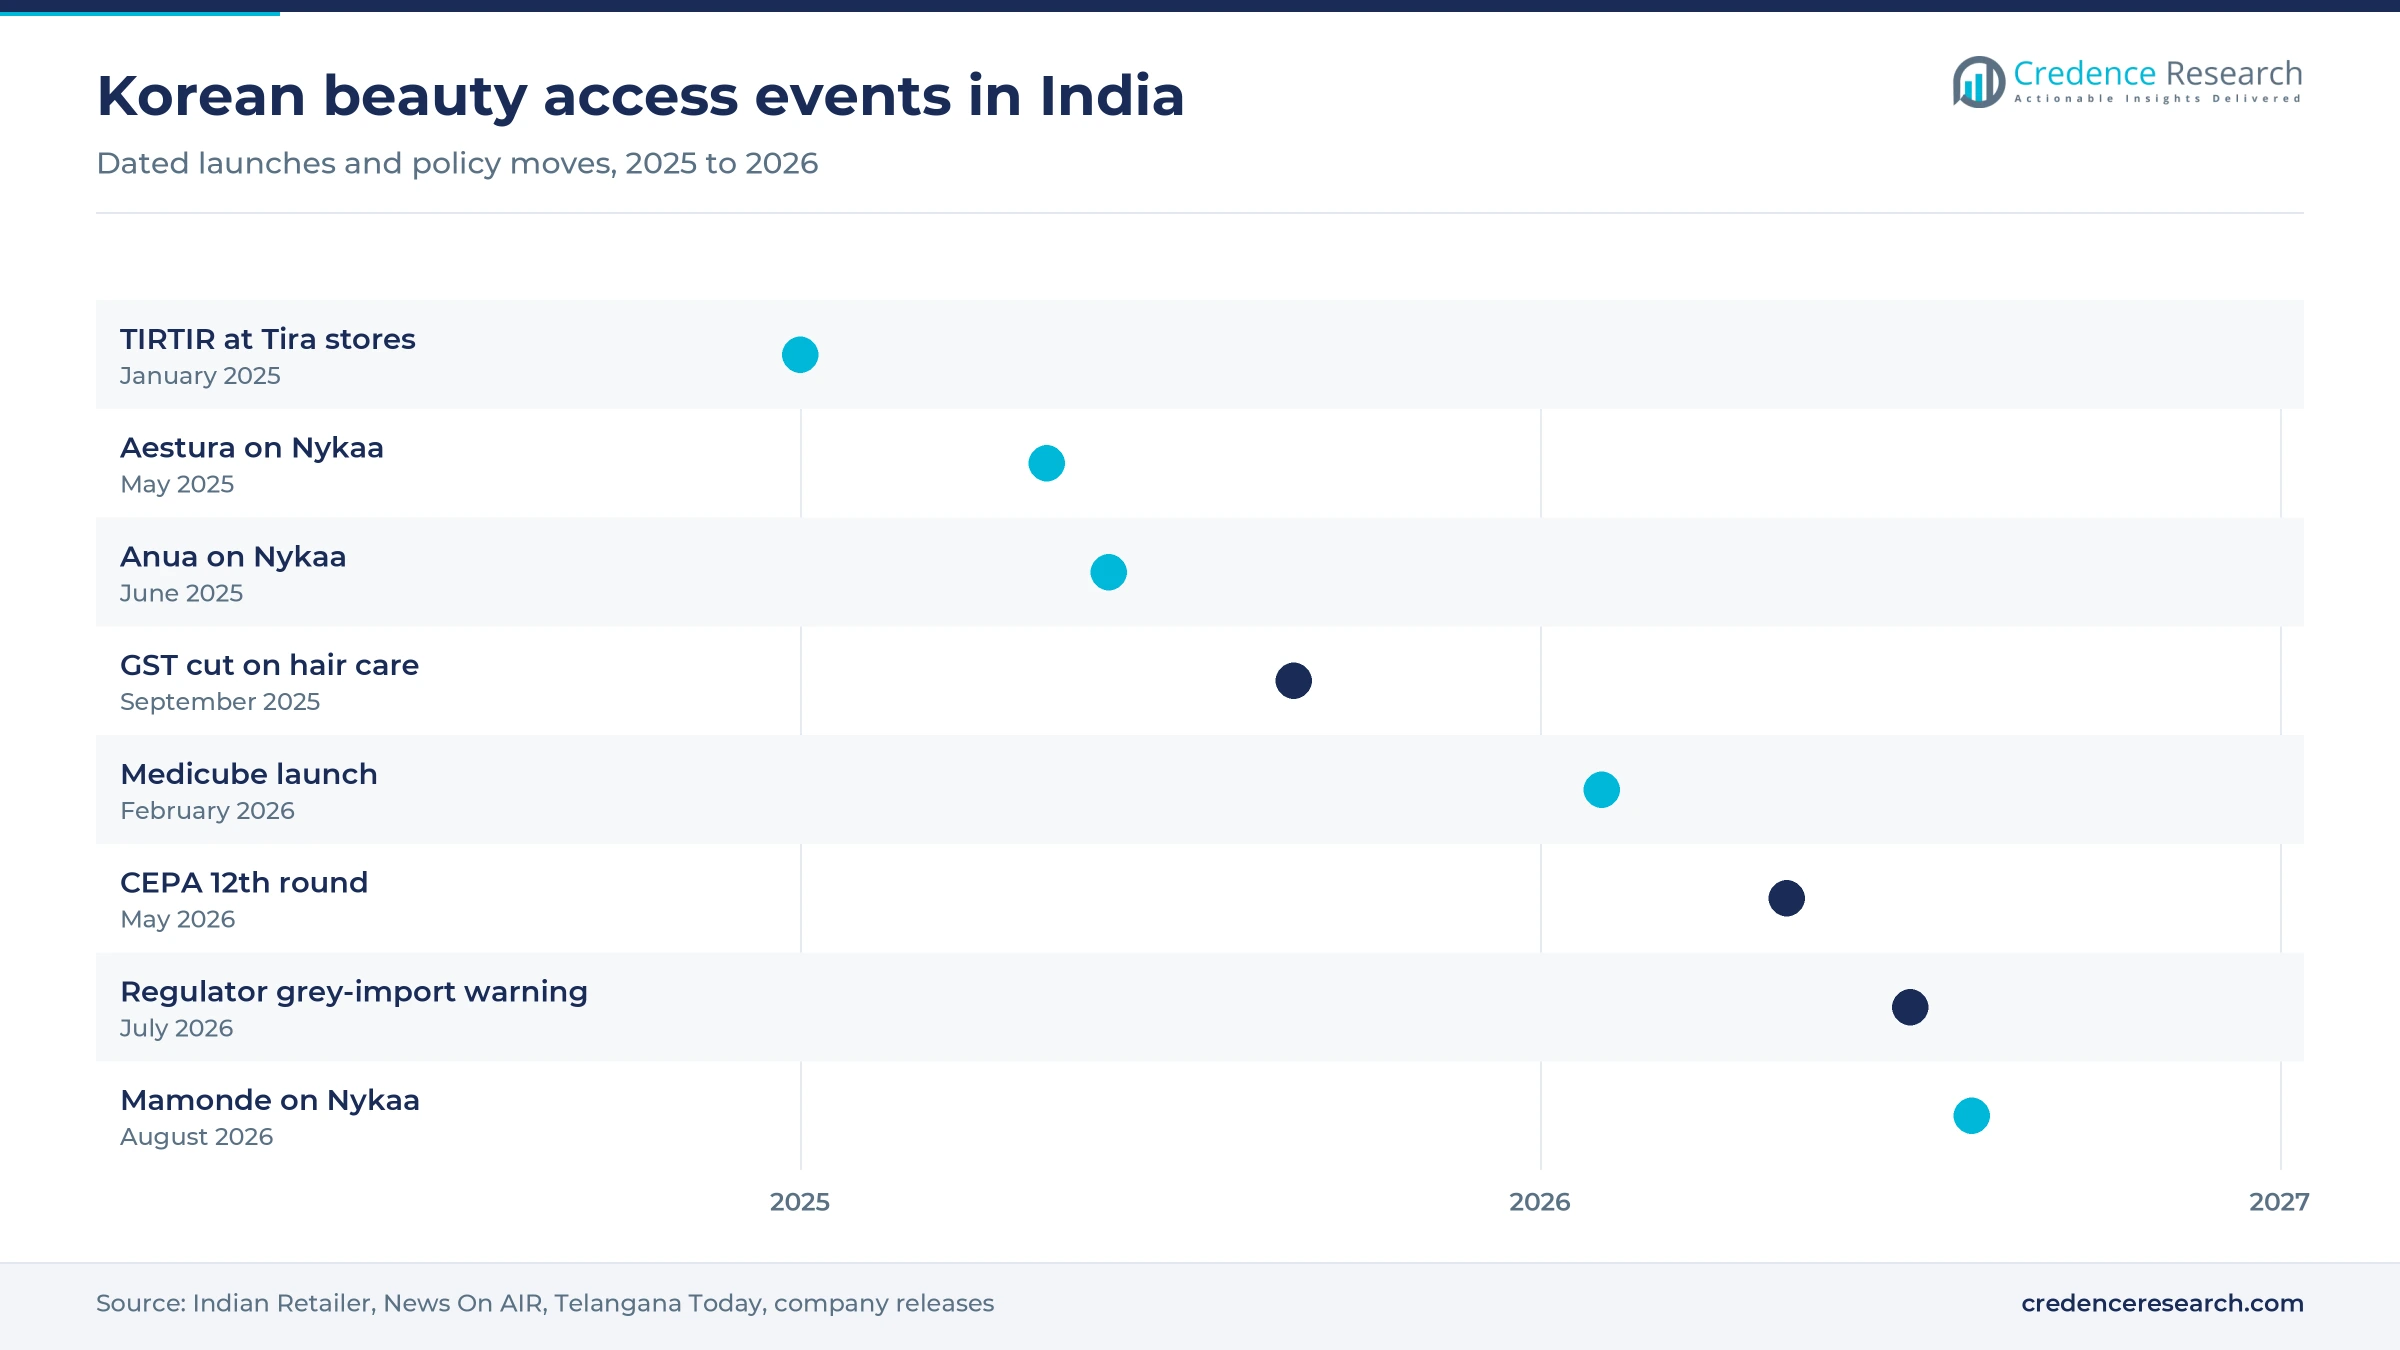
Based on type, the market is categorized into sheet masks, cleansers, moisturizers, serums and essences, exfoliators and others. Moisturizers led with 30.0% of 2025 value because barrier care anchors recent Korean launches, including Aestura's ATOBARRIER365 cream range in May 2025 and Illiyoon's ATO Lotion in March 2026, according to Indian Retailer and Indian Television. Serums & Essences grow fastest at 18.82% a year as active formulas carry higher ticket values, with Medicube's PDRN Pink Peptide Serum listed at Rs 2,300 in Nykaa's February 2026 launch release. These ranges increasingly compete with anti-aging serums, and many are bought alongside facial sheet masks.
How far does Korean skin care reach beyond home use?
Based on application, the market is categorized into personal, beauty business, medical/therapeutic and others. Personal use led with 84.0% of 2025 value because purchases remain individual and platform-led, with Myntra listing more than 1,000 Korean products from over 90 brands in its October 2026 report. Beauty business demand comes from professional users alongside hair salon services. Medical/Therapeutic use grows fastest at 19.98% a year as clinics begin selling Korean regimens, since Entrepreneur India reported over 3,000 KorinMi clients and a Rs 10 crore raise in June 2026, and Parsers.vc reports three Gurugram clinics.
Which shoppers fund the category today?
Based on end user, the market is categorized into male, female and children and teenage buyers. Female buyers led with 72.0% of 2025 value because more women are entering paid work, and the Periodic Labour Force Survey put female labor force participation at 41.7% in 2023-24, up from 37.0% a year earlier. Male buyers grow fastest at 19.25% a year as men's skin care orders on Myntra rose 78% year on year through August 2026. RYO's September 2025 launch through Nykaa reinforced this shift by offering separate hair-fall solutions for men and women.
Why does online still dominate as stores multiply?
Based on distribution channel, the market is categorized into online retail, supermarket/hypermarket and specialty/monobrand stores. Online Retail led with 68.0% of 2025 value because Nykaa, India's largest beauty platform, makes about 90% of its sales online and serves more than 42 million customers, according to Korea JoongAng Daily in March 2026. Specialty/Monobrand Stores grow fastest at 18.70% a year as Nykaa's estate rose from more than 230 stores in June 2025 to 338 by Sept. 30, 2026. Tira adds similar testing access, having placed TIRTIR in Mumbai, New Delhi and Bengaluru stores in January 2025.
| Segment Group | Leading Sub-segment | Share, 2025 | Fastest-growing Sub-segment | CAGR, 2026–2035 |
|---|---|---|---|---|
| By Type | Moisturizers | 30.0% | Serums & Essences | 18.82% |
| By Application | Personal | 84.0% | Medical/Therapeutic | 19.98% |
| By End User | Female | 72.0% | Male | 19.25% |
| By Distribution Channel | Online Retail | 68.0% | Specialty/Monobrand Stores | 18.70% |
Request a Free Sample
Fill in your details and we'll send you a free sample report.
- Sample data tables & charts
- Research methodology
Young buyers, wider shelves and Korean export push
How is Gen Z routine spending lifting Korean skin care?
Young shoppers are the main engine because they buy multi-step routines earlier and repeat them more often. The Myntra report covered by The Week in October 2026 shows K-beauty demand up 200% year on year, with searches up more than 300%. Gen Z also gives beauty a 75% higher share of wallet than other cohorts, according to the same report. About 47.5% of India's 1.4 billion people are under 25, and the median age of 29 compares with 45 in Korea, according to a September 2025 Pulse report carried by ANI. As a result, the buyer pool keeps refreshing, and Korean routines reach shoppers before older habits have formed. Serums & Essences benefit most at 18.82% a year, since these formulas are the entry point for ingredient-focused younger buyers.
Why are wider retail shelves converting Korean brand interest?
Retail access is turning online curiosity into repeat purchases because shoppers can now test Korean ranges before buying them. Nykaa's offline estate rose from more than 230 stores in June 2025, according to FashionUnited, to 338 by Sept. 30, 2026, according to Indian Retailer. Nykaa's Korean brand GMV also rose 58% year on year while Amazon's K-beauty sales climbed 75%, according to Outlook Respawn in June 2026. This breadth matters because Nykaa hosted eight Amorepacific brands by September 2025, according to Angel One. In turn, Online Retail held 68.0% of 2025 value, while physical formats add the supervised selling that premium serums and creams need to win first-time buyers.
What makes barrier and dermocosmetic claims resonate in India?
Sensitive-skin claims are lifting demand because Indian shoppers increasingly treat heat and humidity as skin barrier problems. Aestura launched in May 2025 with formulas developed alongside 49 dermatologists and a claim of up to 120 hours of hydration, according to Indian Retailer. Illiyoon followed in March 2026 as Amorepacific's second K-derma brand with Nykaa, according to Indian Television. Mamonde then entered in August 2026 with 10 products from its Rose HA and Peony BHA lines aimed at dehydration, excess sebum and pore care, according to Edaily. These launches show Korean owners tailoring claims to Indian conditions rather than simply exporting home-market bestsellers. Consequently, Moisturizers stayed the largest step, because daily creams sit at the center of a routine shoppers can justify repeating.
How does Korea's export drive feed Indian supply?
Korean exporters are prioritizing India because record shipments elsewhere leave them seeking newer growth markets. South Korea's cosmetics exports reached USD 11.43 billion in 2025, up 12.3%, according to the Ministry of Food and Drug Safety as reported by Personal Care Magazine. India's imports of Korean HS 330499 goods rose from 1.52 million kg in 2022 to 2.55 million kg in 2024, according to World Integrated Trade Solution data. APR then entered India in March 2026 after the United States, Japan and Europe, according to Digital Today. Cosmax also reported more than 50 Indian clients and over 30 new product development inquiries in 2025, according to Pulse. Together, these moves deepen supply beyond parallel imports and widen the ranges available.
Sun care, K-derma clinics and smaller-city openings
Shift toward Korean sun care and ingredient-led buying
Ingredient literacy is moving Korean sun care from an add-on to a daily habit, because shoppers now search for textures and actives rather than brands alone. Myntra reported sun protection purchases up 60% among Gen Z shoppers through August 2026. Searches rose 80% for spray sunscreens, 70% for ingredient-led sunscreens and 60% for tinted sunscreens over the same period, according to The Week. Nykaa's Bengaluru festival in September 2026 grouped 14 named Korean skin care brands around sun care, sheet masks and advanced formulations, according to Indian Retailer. As a result, launches increasingly lead with a named active, as Anua did with its Niacinamide 10% + TXA 4% Serum in June 2025, according to FashionUnited.
Rise of K-derma clinics and doctor-led skin plans
Clinical credibility is emerging as a second route to market, because some buyers want diagnosis before committing to a costly Korean regimen. KorinMi opened its first Gurugram clinic in October 2024 and plans sites in Mumbai, Bengaluru and Hyderabad, according to Entrepreneur India in June 2026, and Parsers.vc reports three Gurugram clinics. Its client journeys typically run 30 to 45 days and begin with 3D skin analysis and a doctor consultation, Entrepreneur India reported. Aestura and Illiyoon reinforce this positioning through dermocosmetic claims on Nykaa. Consequently, Medical/Therapeutic use grows at 19.98% a year from a small base, although retail shoppers will continue to account for most category value.
Opening in tier 2 and tier 3 cities for trial formats
Smaller cities offer the clearest opening, because demand is already visible there while Korean store coverage remains thin. Half of Myntra's Gen Z beauty buyers live in tier 2 and tier 3 cities, which also generate half of its international beauty demand, according to The Week in October 2026. Ludhiana, Patna, Bhopal, Indore, Guwahati, Surat, Varanasi and Imphal were named as key drivers in that report. Myntra also found that 53% of luxe makeup orders now include a mini, which supports low-risk trial formats. Brands that pair smaller packs with Nykaa's 338-store estate could therefore convert first-time buyers at lower prices, and South India shows how quickly a well-served region can move.
Opening for local formulation and lower Indian price points
Local formulation is an opening because import costs currently keep many Korean products above mass budgets. Medicube's February 2026 Nykaa range ran from Rs 1,600 to Rs 2,600 a product, according to its launch release, while Pulse found typical beauty spending of Rs 1,000 to Rs 3,000 a month. Cosmax planned a Mumbai subsidiary by the end of 2025 to serve its Indian clients, according to the same Pulse report. Mamonde is also pricing affordably for India, according to Edaily in August 2026. Meanwhile, the 12th round of India-Korea CEPA upgrade talks ended in New Delhi in May 2026, according to News On AIR, which could improve import economics if cosmetics benefit.
Duty, registration and grey imports test margins
How much does the import duty stack add?
Landed cost is the first barrier for goods without a trade preference, because Deepbeez lists 20% basic customs duty, a 10% surcharge on that duty and 18% IGST on HS 3304 goods, or about 43.96% of CIF value. EximPe lists a 0% basic rate for Korean goods that meet rules of origin, so documentation decides whether that stack applies in full. Smaller importers absorb the most pressure, since they lack volume discounts. Consequently, many premium serums reach shelves above mass budgets, and brand owners respond through smaller packs and selective ranges.
What does registering Korean cosmetics for India involve?
Registration slows smaller brands, because the cosmetics FAQ from the Central Drugs Standard Control Organisation sets fees of USD 1,000 per category, USD 500 per manufacturing site and USD 50 per variant. Applicants file Form COS-1 and receive Form COS-2, with a 90-day target and a six-month legal limit. Importers, Indian subsidiaries or authorized agents may all apply for it. Wide ranges therefore pay materially more than focused launches, so many brands enter with a short list of hero products.
How does the grey market damage compliant importers?
Unregistered supply undercuts compliant brands, because the regulator warned state drug control authorities about imported cosmetics sold without valid certificates, according to Telangana Today in July 2026. Officials cited risks from mercury, lead and unsafe preservatives, and they said the trend had grown over the past year. Enforcement is tightening, since a Nagpur applicant was debarred for one year over allegedly fabricated documents, according to Medical Dialogues in May 2026. Authorized sellers must therefore prove product provenance more clearly to shoppers.
Why does low per-head spending limit premium ranges?
Spending power caps premium growth, because India spends about USD 15 per head on beauty, against USD 38 in China and USD 383 in the United States, according to Myntra's October 2026 report. Domestic rivals also gained, since GST on hair oil, shampoo and face powder fell from 18% to 5% on Sept. 22, 2025, according to News On AIR. Mass hair and powder lines therefore became cheaper, which sharpens the price comparison for premium Korean ranges.
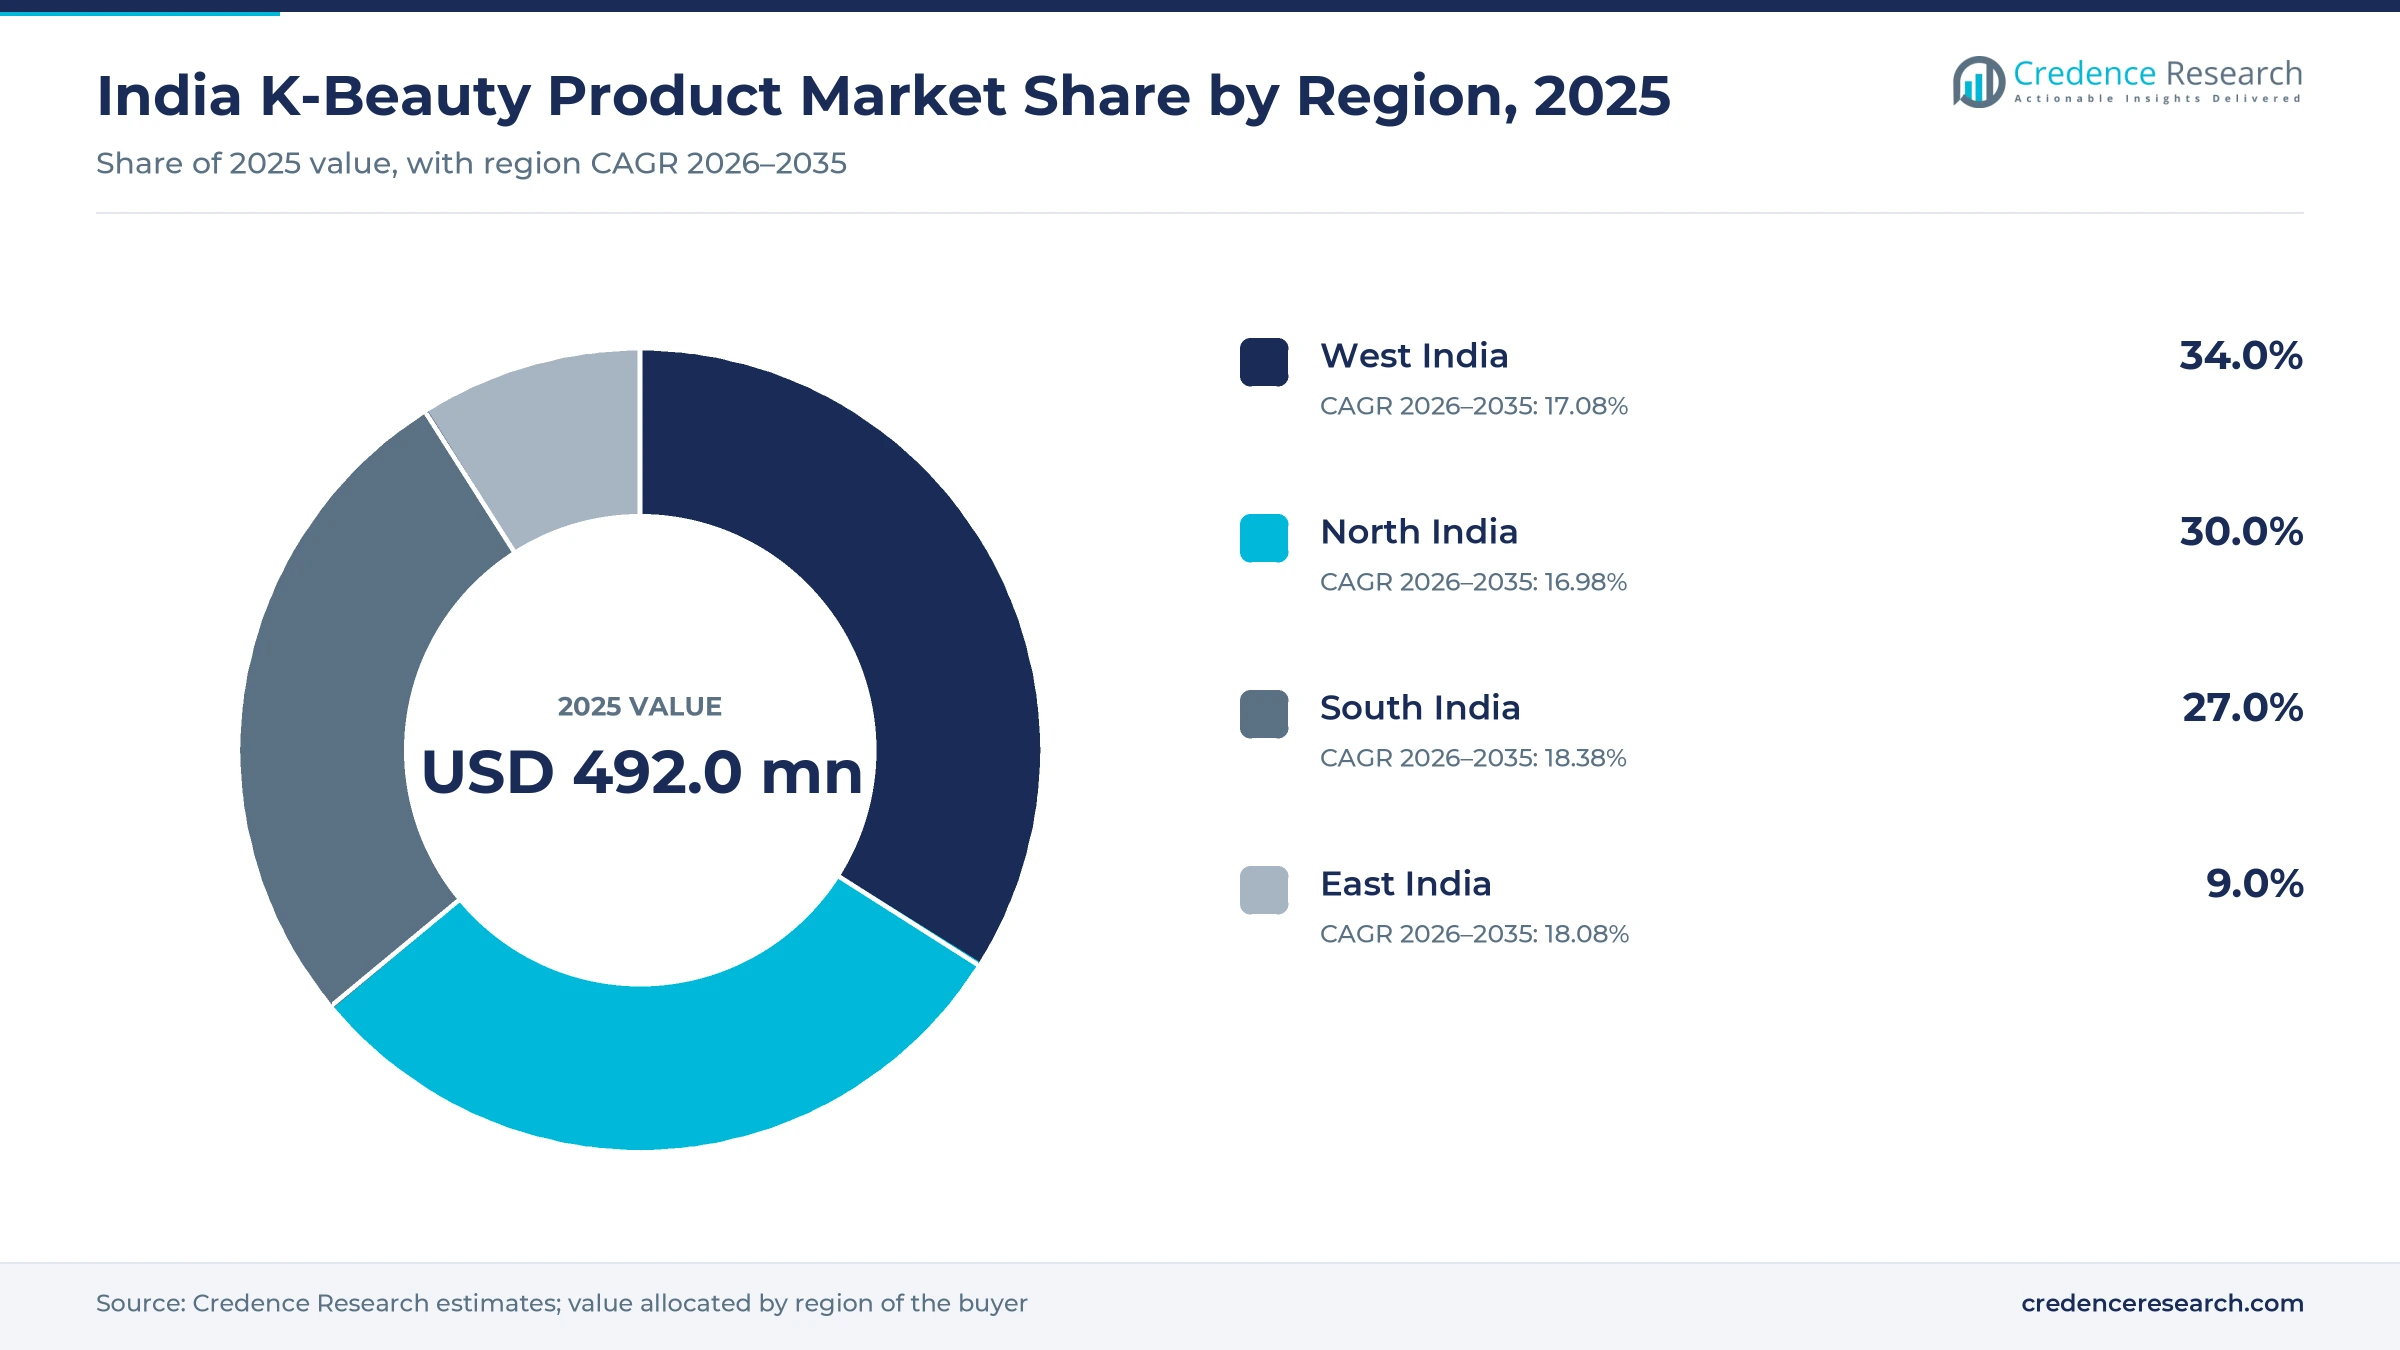
West India leads while South India grows fastest
| Region | Value, 2025 (USD million) | Share, 2025 | CAGR, 2026–2035 |
|---|---|---|---|
| West India | 167.3 | 34.0% | 17.08% |
| North India | 147.6 | 30.0% | 16.98% |
| South India | 132.8 | 27.0% | 18.38% |
| East India | 44.3 | 9.0% | 18.08% |
West India leads on Mumbai retail and contract links
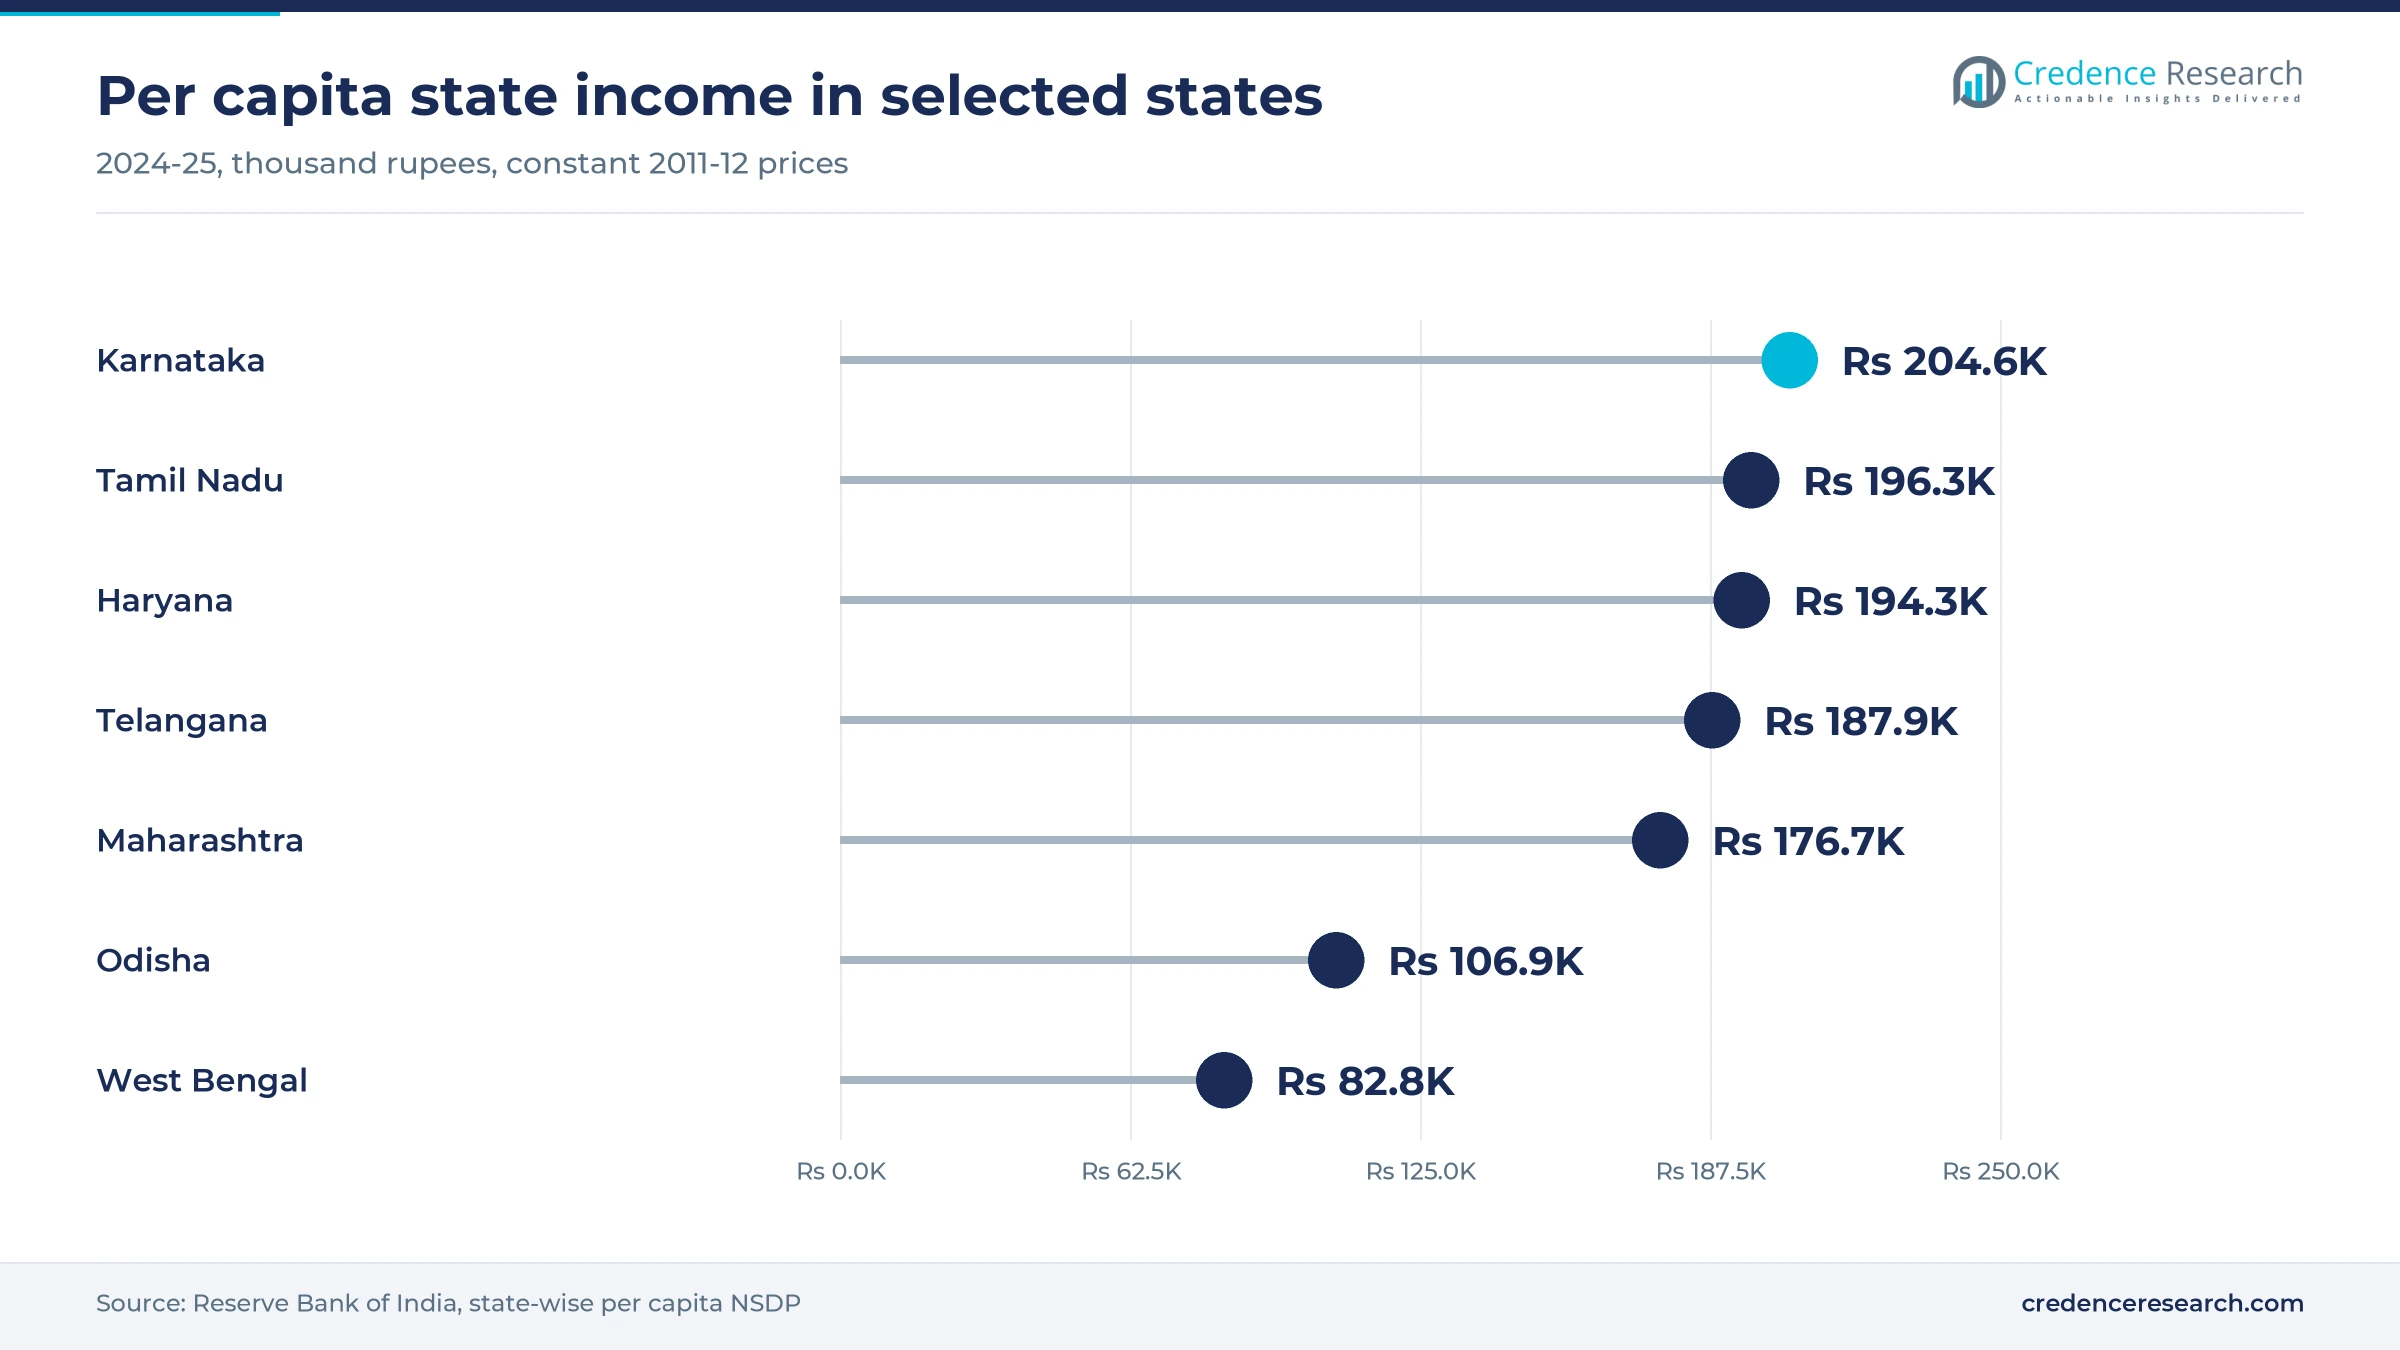
West India held 34.0% of 2025 value and grows at 17.08% a year, because Mumbai combines premium beauty retail, early store launches and supplier links. Cosmax planned its Indian subsidiary in Mumbai, and TIRTIR chose the city for its January 2025 Tira debut. Maharashtra's per capita state income reached Rs 176,678 in 2024-25 at constant 2011-12 prices, according to the Reserve Bank of India. Surat also appeared among Myntra's named demand centers, which suggests that interest extends well beyond Mumbai.
North India grows from Delhi and Gurugram demand
North India held 30.0% of 2025 value and grows at 16.98% a year, because the National Capital Region concentrates premium stores and clinic-led demand. KorinMi's three clinics all sit in Gurugram, and Haryana's per capita state income reached Rs 194,285 in 2024-25, according to the Reserve Bank of India. New Delhi also hosted TIRTIR's first Tira placement in January 2025. Atomy India, which entered in November 2020, was scouting land in the region in 2021, according to Business Today.
South India moves fastest on Bengaluru and Hyderabad
South India held 27.0% of 2025 value and grows fastest at 18.38% a year, because high state incomes meet strong platform use. Karnataka's per capita state income reached Rs 204,605 in 2024-25, ahead of Tamil Nadu at Rs 196,309, according to the Reserve Bank of India. Nykaa chose Forum Mall in Bengaluru for its September 2026 K-Beauty Festival, according to Indian Retailer. KorinMi has also named Bengaluru and Hyderabad as planned clinic cities, which adds a professional route.
East India starts small but shows reach through Imphal
East India held 9.0% of 2025 value and grows at 18.08% a year, because lower incomes limit premium baskets even where cultural interest is strong. West Bengal's per capita state income was Rs 82,781 in 2024-25, and Odisha's was Rs 106,918, according to the Reserve Bank of India. However, Patna, Guwahati and Imphal all appeared among the cities named in Myntra's October 2026 report. Online delivery therefore carries most of this zone's demand, and store coverage remains its main gap.
Launches and rules that reset Korean beauty access
| Development | Status and market relevance |
|---|---|
| In May 2025, Aestura launched in India exclusively through Nykaa with its ATOBARRIER365 collection. | Live, and the launch brought Korean dermocosmetics into mainstream Indian retail |
| In September 2025, Nykaa introduced Mise En Scène and RYO with Amorepacific, taking its Amorepacific roster to eight brands. | Live, and the launch widened Korean ranges into hair care |
| In February 2026, Medicube debuted in India on Nykaa and Tira through APR Corporation. | Live, with skin care first and devices held back |
| In May 2026, the 12th round of India-Korea CEPA upgrade talks ended in New Delhi. | Talks continue, and any cosmetics tariff change remains unconfirmed |
| In July 2026, the national drug regulator warned state authorities about unregistered imported cosmetics. | Enforcement is active and favors registered importers |
Ingredient science behind Korean skin care claims
- Ceramide barrier systems underpin the Aestura ATOBARRIER365 and Illiyoon ATO lines, which target dry and sensitive skin with soy-ceramide and capsule technologies.
- PDRN formulas feature in Medicube serums, cleansers and gel masks, and they represent the newer premium end of the Rs 1,600 to Rs 2,600 launch range.
- Niacinamide and tranexamic acid blends address dark spots in the Anua 10% + TXA 4% serum, which matches a pigmentation concern common among Indian buyers.
- Flower-derived actives define Mamonde, whose Rose HA and Peony BHA lines were chosen to address dehydration, sebum and pore concerns in India.
Need a Custom Version of This Report?
Tailor the scope, geography, or segments to your exact requirements.
- Custom geography or segment scope
- Direct access to our analyst team
Korean brand owners compete through Nykaa and Tira
Competition centers on platform access rather than standalone retail, because most Korean owners reach Indian shoppers through Nykaa and Tira first. Amorepacific has the broadest position, having worked with Nykaa since 2016 and added Illiyoon, Mise En Scène, RYO and Mamonde since 2025. LG H&H sells Ohui, Su:m37, The History of Whoo, Belif and The Face Shop, which entered online in 2016 and has since added offline presence. Craver's Skin1004 and TIRTIR use Tira as a key partner, while Goodai Global's Beauty of Joseon and The Founders' Anua built recognition online. APR arrived in 2026 with Medicube and four flagship products. Atomy India takes a different route through direct selling, having started in November 2020 with imported ranges, including The Fame skin care line. Maccaron adds a specialist marketplace offering about 30,000 products from 1,000 brands. Local cosmetics packaging and Cosmax contract capacity may matter more if localization advances.
Which companies shape Korean beauty access in India?
| Company | Type | Role in the market |
|---|---|---|
| Amorepacific Corporation | Brand owner | Sells Laneige, Innisfree, Sulwhasoo, Aestura, Illiyoon, COSRX and Mamonde through Nykaa |
| LG H&H Co. Ltd | Brand owner | Markets Ohui, Belif, The History of Whoo and The Face Shop in India |
| APR Corporation | Brand owner | Launched Medicube on Nykaa and Tira in February 2026, without devices |
| Goodai Global | Brand owner | Builds Beauty of Joseon recognition mainly through online platforms |
| The Founders Inc. | Brand owner | Launched Anua exclusively through Nykaa in June 2025 |
| Craver Corp. | Brand owner | Sells Skin1004 on Tira, Nykaa and Amazon |
| Nykaa | Retailer | Runs a dedicated Korean store online and 338 stores by September 2026 |
| Reliance Retail (Tira) | Retailer | Carries TIRTIR, Skin1004, Mixsoon and Medicube online and in stores |
| Atomy India | Direct seller | Sells imported Korean personal care through direct selling since November 2020 |
Why distribution matters more than hype
Credence Research's view is that distribution, not cultural interest, now decides who wins this market. Korean fandom opened the door, but Nykaa's 338 stores and Tira's exclusive brand deals determine which ranges shoppers can actually test and reorder. Price remains the sharpest weakness, since Medicube's Nykaa range starts at Rs 1,600 while Pulse found typical Korean cosmetics spending of Rs 1,000 to Rs 3,000 a month. Brands that register narrow ranges, keep paperwork clean and localize production will likely outlast those relying on viral demand alone. The largest uncertainty is whether grey imports shrink quickly, because compliant sellers cannot match unregistered prices without a clearer enforcement record.
How the Credence Research estimate was built
The report uses 2025 as the base year, 2026 as the first forecast year and 2035 as the end of the forecast. Market values come from the Credence Research model, which starts from the earlier estimate on this page and was checked against India's HS 330499 import data, duty and margin assumptions, and buyer counts. Zone, segment and channel splits are Credence Research estimates informed by state income, store presence and brand launch records. Sources used include World Integrated Trade Solution, the Reserve Bank of India, the national statistics ministry, the cosmetics regulator, company releases and trade press. No interviews or surveys were conducted for this edition of the report.
Local formulation will shape demand to 2035
Through 2035, the market should broaden from imported hero products toward locally relevant ranges, sold across more cities at a wider spread of prices. Nykaa and Tira will likely stay central, but Myntra's growth and Amazon's K-beauty sales suggest platform concentration may ease over time. A CEPA outcome covering cosmetics would improve import economics, although nothing has been confirmed so far. Device sales could add a later adjacent line if brands clear certification, as APR has signaled caution there. By the end of the period, Serums & Essences and clinic-led regimens should account for a larger part of category value.
Frequently Asked Questions
How big is the India K-beauty product market?
How large is the beauty products market in India overall?
What is the turnover of K-beauty exports?
Which Korean skin care brands are available in India?
How can cosmetics be imported from Korea to India?
Are beauty tools and devices included in this estimate?
Which segment leads the India K-beauty product market?
Which part of India buys the most Korean beauty products?
Table of Content
Chapter 1 Market Segmentation
- 1.1 Segmentation Framework
- 1.1.1 Product and Service Classification
- 1.1.2 Application and End-Use Classification
- 1.1.3 Technology and Solution Classification
- 1.1.4 Customer and Distribution Channel Classification
- 1.1.5 Geographic Segmentation
- 1.1.6 Market Segment Definitions and Boundaries
- 1.2 By Type
- 1.2.1 Moisturizers
- 1.2.2 Serums & Essences
- 1.2.3 Cleansers
- 1.2.4 Sheet Masks
- 1.2.5 Exfoliators
- 1.2.6 Others
- 1.3 By Application
- 1.3.1 Personal
- 1.3.2 Beauty Business
- 1.3.3 Medical/Therapeutic
- 1.3.4 Others
- 1.4 By End User
- 1.4.1 Female
- 1.4.2 Male
- 1.4.3 Children and Teenage
Chapter 2 Introduction
- 2.1 Report Objectives and Scope
- 2.2 Product Definition and Industry Terminology
- 2.3 Market Inclusions and Exclusions
- 2.4 Research Process
- 2.4.1 Primary Research and Expert Interviews
- 2.4.2 Secondary Research and Source Review
- 2.4.3 Top-Down and Bottom-Up Estimation
- 2.4.4 Data Triangulation and Verification
- 2.5 Market Size Measurement Basis
- 2.5.1 2025: USD 492.0 million → 2035: USD 2.47 billion
- 2.6 Historical and Forecast Reference Periods
- 2.6.1 Historical Period: 2018-2025
- 2.6.2 Base Year: 2025
- 2.6.3 Forecast Period: 2025-2035
- 2.7 Research Assumptions and Limitations
Chapter 3 Executive Summary
- 3.1 Market Snapshot and Key Findings
- 3.2 Base-Year Market Size, 2025
- 3.3 Forecast Market Size, 2035
- 3.4 Revenue and Volume Growth Outlook
- 3.5 Key Demand and Supply Indicators
- 3.6 Leading Market Segments
- 3.7 Fastest-Growing Market Opportunities
- 3.8 Regional Performance Highlights
- 3.9 Technology and Industry Transformation
- 3.10 Competitive Landscape Summary
- 3.11 Analyst View and Strategic Implications
Chapter 4 India K-Beauty Product Market Trends and Developments
- 4.1 Historical Industry Development, 2018-2025
- 4.2 Recent Market Trends and Developments
- 4.3 Demand and Customer Behavior Trends
- 4.4 Technology and Product Innovation
- 4.5 Artificial Intelligence, Automation and Digitalization
- 4.6 Local Manufacturing and Supply Chain Realignment
- 4.7 Industry Partnerships, Mergers and Acquisitions
- 4.8 Sustainability and Circular Economy Developments
- 4.9 Government and Private Sector Investment Trends
- 4.10 Emerging Business Models and Commercialization
- 4.11 Industry Developments and Announcements
Chapter 5 India K-Beauty Product Market Production, Supply and Demand Analysis
- 5.1 Demand Trend and Consumption Analysis, 2018-2025
- 5.2 Demand Forecast, 2025-2035
- 5.3 Production and Output Trend, 2018-2025
- 5.4 Production and Output Forecast, 2025-2035
- 5.5 Installed Capacity and Capacity Utilization
- 5.6 Company-Wise Production Plants and Statistics
- 5.6.1 Installed Production Capacity
- 5.6.2 Actual Production
- 5.6.3 Planned Capacity and Expansion Targets
- 5.7 Supply Chain Structure and Procurement Trends
- 5.8 Supply-Demand Gap and Bottlenecks
- 5.9 Import Dependence and Sourcing Structure
- 5.10 Contract Manufacturing and Outsourcing
- 5.11 Regional Supply and Demand Concentration
Chapter 6 India K-Beauty Product Market Pricing Analysis
- 6.1 Pricing Structure and Measurement
- 6.2 Historical Pricing Trends, 2018-2025
- 6.3 Pricing Outlook, 2025-2035
- 6.4 Average Selling Price and Unit Economics
- 6.5 Pricing by Product and Market Segment
- 6.6 Geographic Pricing Differences
- 6.7 Key Input, Energy, Labor and Logistics Costs
- 6.8 Contract Pricing and Purchasing Models
- 6.9 Pricing Sensitivity and Competitive Positioning
- 6.10 Price, Margin and Profitability Implications
Chapter 7 India K-Beauty Product Market Dynamics
- 7.1 Market Growth Drivers
- 7.1.1 Demand-Side Drivers
- 7.1.2 Technology and Innovation Drivers
- 7.1.3 Infrastructure and Investment Drivers
- 7.1.4 Regulatory and Policy Drivers
- 7.2 Market Restraints
- 7.2.1 Cost and Affordability Constraints
- 7.2.2 Technology and Adoption Barriers
- 7.2.3 Supply Chain and Operational Constraints
- 7.3 Market Challenges
- 7.3.1 Competitive Pressure and Margin Erosion
- 7.3.2 Skills, Infrastructure and Implementation Gaps
- 7.4 Emerging Market Opportunities
- 7.5 Market Dynamics Impact and Time-Horizon Assessment
Chapter 8 India K-Beauty Product Value Chain Analysis
- 8.1 Industry Value Chain Overview
- 8.2 Upstream Suppliers and Critical Inputs
- 8.3 Technology and Component Providers
- 8.4 Manufacturing or Service Delivery
- 8.5 Distribution, Channel Partners and Integrators
- 8.6 Downstream Applications and End Users
- 8.7 Value Addition and Profit Pools
- 8.8 Vertical Integration and Outsourcing
- 8.9 Supplier Concentration and Risk
- 8.10 Supply Chain Localization and Resilience
Chapter 9 India K-Beauty Product Market Regulations and Policies
- 9.1 Relevant Laws, Standards and Compliance Frameworks
- 9.2 Product, Service, Safety and Quality Requirements
- 9.3 Government Policies, Incentives and Subsidies
- 9.4 Imports, Exports and Trade Barriers
- 9.5 Public Procurement and Local Content Requirements
- 9.6 Environmental and Sustainability Compliance
- 9.7 Upcoming Policy Changes and Market Implications
Chapter 10 India K-Beauty Product Market Hotspots and Opportunities
- 10.1 Market Opportunity Mapping and Growth Hotspots
- 10.2 High-Growth Applications and Customer Groups
- 10.3 Underserved Markets and White-Space Opportunities
- 10.4 Emerging Technology and Product Opportunities
- 10.5 New Capacity and Investment Hotspots
- 10.6 Market Entry and Expansion Opportunities
- 10.7 Distribution and Partnership Opportunities
- 10.8 Near-Term and Long-Term Commercial Potential
- 10.9 Opportunity Attractiveness and Execution Risks
Chapter 11 India K-Beauty Product Market Outlook, 2025-2035
- 11.1 Market Size and Analysis
- 11.1.1 Revenue (Market Measurement: 2025: USD 492.0 million → 2035: USD 2.47 billion)
- 11.1.2 Market Volume and Quantity Sold
- 11.1.3 Historical Market Size, 2018-2025
- 11.1.4 Base-Year Market Size, 2025
- 11.2 Market Forecast, 2025-2035
- 11.2.1 Revenue Forecast to 2035
- 11.2.2 Volume Forecast to 2035
- 11.2.3 CAGR and Year-on-Year Growth
- 11.2.4 Incremental Revenue Opportunity
- 11.3 Forecast Assumptions and Scenario Analysis
- 11.3.1 Base-Case Forecast
- 11.3.2 Optimistic and Conservative Scenarios
- 11.3.3 Technology, Pricing and Policy Sensitivities
- 11.4 Market Attractiveness and Growth Outlook
Chapter 12 India K-Beauty Product Market Segmentation and Outlook
- 12.1 Segmentation Summary and Market Shares, 2025
- 12.2 Largest and Fastest-Growing Segments
- 12.3 By Type - Market Size and Forecast, 2025-2035
- 12.3.1 Segment Definition and Scope
- 12.3.2 Historical Market Size, 2018-2025
- 12.3.3 Revenue Forecast, 2025-2035
- 12.3.4 Volume Forecast, 2025-2035
- 12.3.5 Base-Year Market Share, 2025
- 12.3.6 Segment CAGR and Growth Drivers
- 12.3.7 Subsegment Market Size and Forecast
- 12.3.7.1 Moisturizers
- 12.3.7.2 Serums & Essences
- 12.3.7.3 Cleansers
- 12.3.7.4 Sheet Masks
- 12.3.7.5 Exfoliators
- 12.3.7.6 Others
- 12.3.8 Subsegment Pricing and Adoption Trends
- 12.3.9 Leading Suppliers and Competition
- 12.3.10 Regional Demand and Opportunities
- 12.4 By Application - Market Size and Forecast, 2025-2035
- 12.4.1 Segment Definition and Scope
- 12.4.2 Historical Market Size, 2018-2025
- 12.4.3 Revenue Forecast, 2025-2035
- 12.4.4 Volume Forecast, 2025-2035
- 12.4.5 Base-Year Market Share, 2025
- 12.4.6 Segment CAGR and Growth Drivers
- 12.4.7 Subsegment Market Size and Forecast
- 12.4.7.1 Personal
- 12.4.7.2 Beauty Business
- 12.4.7.3 Medical/Therapeutic
- 12.4.7.4 Others
- 12.4.8 Subsegment Pricing and Adoption Trends
- 12.4.9 Leading Suppliers and Competition
- 12.4.10 Regional Demand and Opportunities
- 12.5 By End User - Market Size and Forecast, 2025-2035
- 12.5.1 Segment Definition and Scope
- 12.5.2 Historical Market Size, 2018-2025
- 12.5.3 Revenue Forecast, 2025-2035
- 12.5.4 Volume Forecast, 2025-2035
- 12.5.5 Base-Year Market Share, 2025
- 12.5.6 Segment CAGR and Growth Drivers
- 12.5.7 Subsegment Market Size and Forecast
- 12.5.7.1 Female
- 12.5.7.2 Male
- 12.5.7.3 Children and Teenage
- 12.5.8 Subsegment Pricing and Adoption Trends
- 12.5.9 Leading Suppliers and Competition
- 12.5.10 Regional Demand and Opportunities
- 12.6 Segment Growth Comparison
- 12.7 Segment Attractiveness and Priority Matrix
Chapter 13 India K-Beauty Product End-Use and Application Market Outlook
- 13.1 End-Use Industry and Customer Demand Structure
- 13.2 Leading Applications and Customer Groups
- 13.3 End-Use Market Size, Share and Forecast
- 13.4 Major End-Use Industry Deep Dives
- 13.4.1 Customer Requirements and Use Cases
- 13.4.2 Demand and Replacement Cycles
- 13.4.3 Technical and Regulatory Considerations
- 13.4.4 Purchasing and Procurement Models
- 13.4.5 Leading Vendors and Distribution Channels
- 13.4.6 Forecast and Commercial Opportunities
- 13.5 Emerging Applications and Cross-Segment Demand
- 13.6 End-Use Industry Investment Priorities
Chapter 14 India K-Beauty Product Geographic Market Outlook, 2025-2035
- 14.1 Domestic Market Distribution and Demand Clusters
- 14.2 State- or Province-Wise Market Size and Forecast, 2025-2035
- 14.3 City and Metropolitan Market Outlook
- 14.4 Industrial, Manufacturing and Commercial Clusters
- 14.5 Geographic Concentration of Key End Users
- 14.6 Local Pricing and Purchasing Differences
- 14.7 Domestic Production Facilities and Capacity Map
- 14.8 Local Infrastructure and Project Pipeline
- 14.9 State-Level Policy and Incentive Differences
- 14.10 Subnational Investment Hotspots and Opportunities
- 14.11 Distribution and Logistics Networks
- 14.12 Domestic Competitive Footprint
Chapter 15 India K-Beauty Product Technology, Innovation and Sustainability Outlook
- 15.1 Technology Landscape and Maturity
- 15.2 Product, Process and Service Innovation
- 15.3 AI, Automation and Digital Tools in the Industry
- 15.4 Technology Adoption and Performance Benchmarking
- 15.5 Innovation Pipeline and R&D Investment
- 15.6 Patent and Intellectual Property Trends
- 15.7 Energy Efficiency and Resource Management
- 15.8 Sustainability, Recycling and Circularity
- 15.9 Technology Roadmap, 2025-2035
- 15.10 Risks of Obsolescence and Technology Substitution
Chapter 16 India K-Beauty Product Market Key Strategic Imperatives
- 16.1 Growth and Market Entry Priorities
- 16.2 High-Return Products and Segments
- 16.3 Pricing, Profitability and Cost Optimization
- 16.4 Technology Investment and Product Differentiation
- 16.5 Supply Chain Localization and Resilience
- 16.6 Distribution and Customer Acquisition
- 16.7 Partnership, Acquisition and Capacity Strategy
- 16.8 Regional Expansion Priorities
- 16.9 Short-, Medium- and Long-Term Actions
Chapter 17 Competition Outlook
- 17.1 Industry Competition Characteristics
- 17.2 Market Structure and Concentration
- 17.3 Market Share and Competitive Positioning, 2025
- 17.4 Company-Wise Revenue and Product Benchmarking
- 17.5 Production and Service Capacity Benchmarking
- 17.6 Technology, Pricing and Differentiation
- 17.7 Regional Footprint and Distribution Strength
- 17.8 Mergers, Acquisitions and Strategic Alliances
- 17.9 New Entrants and Competitive Threats
- 17.10 Porter's Five Forces and Industry Attractiveness
- 17.11 Competitive Outlook, 2025-2035
Chapter 18 Company Profiles
- 18.1 Company Coverage and Selection Criteria
- 18.2 Amorepacific Corporation
- 18.2.1 Business Description
- 18.2.2 Company Ownership and Geographic Presence
- 18.2.3 Product and Service Portfolio
- 18.2.4 Manufacturing and Operating Footprint
- 18.2.5 Production Capacity and Expansion Plans
- 18.2.6 Financial Performance and Investment
- 18.2.7 Market Share and Competitive Position
- 18.2.8 Technology and Innovation Capabilities
- 18.2.9 Strategic Alliances or Partnerships
- 18.2.10 Recent Developments
- 18.2.11 Growth Strategy and Outlook
- 18.3 LG H&H Co. Ltd
- 18.4 The Face Shop
- 18.5 Cosrx Inc
- 18.6 Nykaa
- 18.7 Reliance Retail (Tira)
- 18.8 APR Corporation
- 18.9 Goodai Global
- 18.10 The Founders Inc.
- 18.11 Craver Corp.
- 18.12 Atomy India
- 18.13 Other Relevant Market Participants
Note: Every listed company is profiled on the structure shown under the first company. The company list is preliminary and may change based on research findings, market developments, data availability and client requirements.
Chapter 19 Disclaimer
- 19.1 Research and Forecast Disclaimer
- 19.2 Data Source and Estimation Limitations
Note: The depth of individual sections depends on data availability for this market. Volume, capacity, trade and other unit-based metrics are included where applicable.