
Market Overview
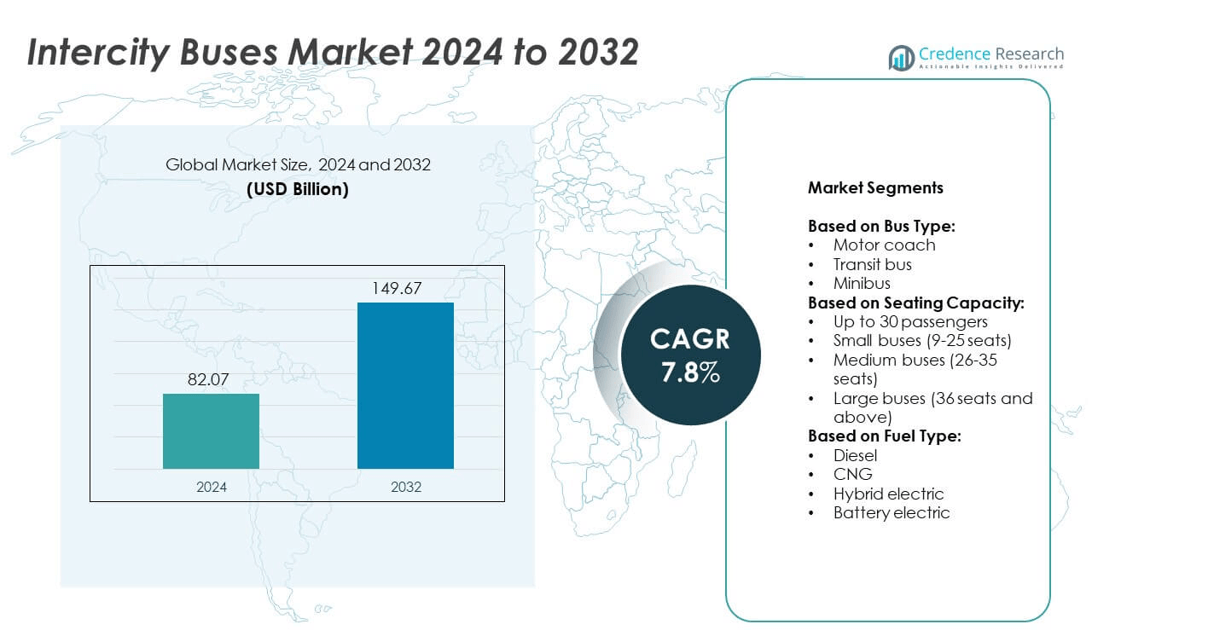
The Intercity Buses Market size was valued at USD 82.07 Billion in 2024 and is expected to reach USD 149.67 Billion by 2032, growing at a CAGR of 7.8% during the forecast period.
| REPORT ATTRIBUTE | DETAILS |
|---|---|
| Historical Period | 2020-2023 |
| Base Year | 2024 |
| Forecast Period | 2025-2032 |
| Intercity Buses Market Size 2024 | USD 82.07 Billion |
| Intercity Buses Market, CAGR | 7.8% |
| Intercity Buses Market Size 2032 | USD 149.67 Billion |
The Intercity Buses market grows through rising urbanization, demand for cost-effective travel, and supportive government policies promoting sustainable transport. Operators adopt electric and hybrid fleets to align with emission regulations and environmental targets. Digital platforms, including e-ticketing and real-time tracking, enhance passenger convenience and boost adoption. Rising tourism, regional trade, and expanding suburban areas further increase reliance on intercity buses. It benefits from ongoing infrastructure development and technological innovation, positioning the sector for steady growth across diverse regions.
North America and Europe demonstrate strong adoption of premium intercity services supported by advanced infrastructure and sustainability policies, while Asia Pacific leads with large-scale fleet expansions driven by urbanization and government investments. Latin America and the Middle East & Africa show steady growth supported by tourism and regional connectivity projects. Key players driving competition include Van Hool, Tata Motors, Yutong, and Scania. It reflects a diverse market landscape shaped by regional priorities, evolving passenger expectations, and regulatory frameworks.
Market Insights
- The Intercity Buses market was valued at USD 82.07 Billion in 2024 and is projected to reach USD 149.67 Billion by 2032 at a CAGR of 7.8%.
- Market drivers include rising urbanization, expansion of regional connectivity, and growing demand for affordable travel options.
- Key trends highlight adoption of electric and hybrid buses, integration of digital ticketing, and development of premium passenger services.
- Competitive analysis shows leading companies focus on sustainable fleet innovations, advanced safety features, and global expansion strategies.
- Market restraints include high operating costs, regulatory compliance expenses, and infrastructure limitations in emerging economies.
- Regional analysis indicates Asia Pacific leads growth through large-scale adoption supported by government policies, while North America and Europe focus on premium services and cleaner fleets.
- Latin America and the Middle East & Africa present steady opportunities driven by tourism, cross-border travel, and gradual infrastructure upgrades
Market Drivers
Rising Urbanization and Regional Connectivity Needs
The Intercity Buses market benefits from expanding urban populations and regional mobility demands. Governments prioritize efficient transportation between cities to reduce congestion on roads and rail. Buses provide a cost-effective solution for mid-range travel compared to private vehicles. Commuters prefer intercity buses for affordability and reliable schedules. It enables smoother access to employment, education, and healthcare in surrounding areas. Growing suburban development strengthens the need for flexible intercity routes that connect urban centers with smaller towns.
- For instance, The Van Hool EX11 coach was launched in 2019 at Busworld Europe. It is available in two heights and can be configured to accommodate up to 47 passengers, depending on the model and specifications.
Environmental Policies and Sustainable Transport Goals
The Intercity Buses market grows under stricter emissions regulations and climate-focused policies. Authorities support low-emission and electric bus fleets to reduce carbon footprints. Transit operators invest in greener fleets to align with sustainability targets. It allows governments to promote public transport over private vehicles to cut pollution. Cleaner technologies, including electric and hybrid buses, attract funding from public and private investors. Global initiatives encourage countries to prioritize sustainable mass transit infrastructure.
- For instance, BYD, a major manufacturer of electric vehicles, has a significant presence in Hungary and Europe. The company operates an electric bus factory in Komárom, Hungary, which has been in operation since 2017. The 700th electric bus from this factory was delivered in August 2024. The company continues to deliver electric buses and plans further expansions in Europe ..
Rising Demand for Affordable and Safe Travel Options
The Intercity Buses market expands with demand for cost-efficient travel alternatives. Travelers seek cheaper options compared to air or rail, especially for medium distances. Safety standards and advanced comfort features improve passenger trust and adoption. It creates strong appeal for families, students, and budget-conscious travelers. Operators integrate digital booking systems and real-time tracking to enhance travel experience. Improved affordability and convenience attract a wider consumer base in developing and developed regions.
Technological Advancements and Digital Integration in Operations
The Intercity Buses market strengthens through adoption of advanced digital platforms. Companies use smart ticketing, GPS-based fleet management, and automated scheduling tools. Technology improves route efficiency and reduces operational costs for bus operators. It increases passenger satisfaction through real-time updates and seamless booking. Enhanced connectivity enables integration with multimodal transport networks. Growing focus on digital transformation positions intercity buses as a competitive mode of travel.
Market Trends
Adoption of Electric and Alternative Fuel Buses
The Intercity Buses market witnesses a shift toward electric and alternative fuel vehicles. Operators replace diesel fleets with electric, hybrid, and natural gas buses. Governments support this transition through subsidies, tax benefits, and infrastructure projects. It creates long-term operational savings while addressing environmental concerns. Manufacturers invest in developing high-capacity batteries and charging solutions for long-distance routes. Demand for sustainable transport grows steadily across both developed and emerging economies.
- For instance, FlixBus utilizes a network of partner bus operators across Europe, with a global fleet of more than 5,000 buses as of 2024. All coaches in the FlixBus network are required to be equipped with GPS tracking to provide real-time updates for customers and enhance safety.
Integration of Digital Platforms for Customer Experience
The Intercity Buses market advances with growing use of digital platforms. Online booking apps, e-ticketing, and cashless payments dominate service offerings. Operators deploy real-time tracking and digital alerts to improve convenience. It ensures higher customer satisfaction and smoother travel planning. Rising internet penetration supports wider adoption of mobile-based transport solutions. Digital ecosystems encourage loyalty through seamless travel management
- For instance, In February 2023, Greyhound partnered with FlixBus, its parent company, to offer tickets for both Greyhound and FlixBus services through the FlixBus app and website. This expanded network enables travelers to book tickets for over 1,600 destinations across the United States
Focus on Comfort, Safety, and Premium Services
The Intercity Buses market adapts to changing passenger expectations for better service quality. Operators invest in luxury seating, entertainment systems, and onboard connectivity. Enhanced safety features such as collision avoidance and surveillance systems build passenger confidence. It creates stronger differentiation in competitive travel markets. Premium intercity services attract professionals, tourists, and high-income commuters. Growing demand for reliable, safe, and comfortable buses reshapes operator strategies.
Expansion of Regional and Cross-Border Connectivity
The Intercity Buses market develops with regional integration projects and trade-driven mobility. Governments invest in better highways and cross-border transport corridors. Operators expand long-haul routes to link urban and rural regions effectively. It strengthens accessibility in areas where rail or air connectivity remains limited. Partnerships between public and private players enhance operational reach. Rising inter-regional travel demand boosts investment in fleet expansion and route development.
Market Challenges Analysis
High Operating Costs and Infrastructure Limitations
The Intercity Buses market faces persistent challenges from high fuel costs, maintenance expenses, and fleet renewal needs. Operators struggle with rising prices of spare parts and technology upgrades required to meet modern standards. Limited charging and refueling infrastructure restricts wider adoption of electric and alternative fuel buses. It reduces the ability of smaller operators to compete effectively with larger companies. In many regions, road quality and traffic congestion further increase operational inefficiencies. Unpredictable costs limit profitability and discourage investment in new routes or advanced vehicles.
Regulatory Pressures and Competition from Other Modes of Transport
The Intercity Buses market encounters strict government regulations on emissions, safety, and passenger rights. Compliance requires significant investment in fleet modifications and monitoring systems. It creates financial strain for operators managing thin margins. Competition from low-cost airlines and improved rail networks reduces passenger demand in certain regions. Rapid technological shifts demand continuous adaptation to maintain service appeal. Operators unable to align with policy changes and evolving consumer expectations risk market share erosion.
Market Opportunities
Growth Potential in Electric and Sustainable Transport Solutions
The Intercity Buses market holds strong opportunities through the shift toward electric and low-emission fleets. Governments provide financial incentives and policy support to accelerate green transport adoption. It creates room for operators to invest in next-generation buses with advanced energy efficiency. Infrastructure expansion for charging stations and renewable energy integration strengthens the business case. Manufacturers can tap into demand for high-capacity electric buses tailored for long-distance travel. Expanding eco-conscious consumer preferences further enhances the potential for sustainable fleet deployment.
Expansion into Underserved Routes and Digital Service Models
The Intercity Buses market can expand by addressing underserved rural and semi-urban areas. Operators have opportunities to launch new routes that improve regional accessibility. It enables stronger integration with tourism and regional trade growth. Digital ticketing, real-time fleet management, and customer-centric platforms present added opportunities for differentiation. Partnerships with governments and private investors support the development of modern, technology-driven services. Growing adoption of data-driven operations helps improve efficiency and capture evolving passenger expectations.
Market Segmentation Analysis:
By Bus Type:
The Intercity Buses market is divided into motor coaches, transit buses, and minibuses. Motor coaches dominate long-distance travel due to high comfort, luggage capacity, and reliability. Transit buses serve mid-range city-to-city routes with frequent stops and affordable fares. Minibuses gain traction in rural and semi-urban regions where demand for flexible and low-cost transport is rising. It allows operators to tailor services based on route density and passenger volume. Growth across all three types reflects diverse mobility needs across global regions.
- For instance, In 2024, VDL Bus & Coach experienced a significant increase in turnover within its bus division, which rose by 67% to €509 million, though this followed a substantial drop in the previous year.
By Seating Capacity:
The Intercity Buses market segments include up to 30 passengers, small buses with 9–25 seats, medium buses with 26–35 seats, and large buses with 36 seats and above. Large buses dominate due to their ability to move high passenger volumes efficiently. Medium buses remain popular on regional routes where demand is moderate but consistent. Small buses cater to shorter intercity travel and rural connectivity. It creates strong adoption where infrastructure may not support larger fleets. Seating capacity segmentation enables operators to align services with both high-density corridors and niche markets.
- For instance, The Mercedes-Benz Tourrider motorcoach was unveiled in September 2021 as a new model designed specifically for the North American market. It is available in two versions, the Tourrider Business and the Tourrider Premium, both of which offer a standard seating configuration for 56 passengers, with an option to expand to 60 with reduced leg space
By Fuel Type:
The Intercity Buses market is segmented into diesel, CNG, hybrid electric, and battery electric. Diesel buses maintain a major share due to established infrastructure and cost advantages, especially in developing regions. CNG buses gain popularity for cleaner emissions and favorable fuel economics. Hybrid electric options grow where operators seek efficiency and reduced emissions without full electrification. Battery electric buses represent the fastest-growing segment driven by environmental policies and technological advances in charging. It positions sustainable fuel types as long-term growth drivers while diesel continues to serve immediate operational needs.
Segments:
Based on Bus Type:
- Motor coach
- Transit bus
- Minibus
Based on Seating Capacity:
- Up to 30 passengers
- Small buses (9-25 seats)
- Medium buses (26-35 seats)
- Large buses (36 seats and above)
Based on Fuel Type:
- Diesel
- CNG
- Hybrid electric
- Battery electric
Based on the Geography:
- North America
- U.S.
- Canada
- Mexico
- Europe
- UK
- France
- Germany
- Italy
- Spain
- Russia
- Belgium
- Netherlands
- Austria
- Sweden
- Poland
- Denmark
- Switzerland
- Rest of Europe
- Asia Pacific
- China
- Japan
- South Korea
- India
- Australia
- Thailand
- Indonesia
- Vietnam
- Malaysia
- Philippines
- Taiwan
- Rest of Asia Pacific
- Latin America
- Brazil
- Argentina
- Peru
- Chile
- Colombia
- Rest of Latin America
- Middle East
- UAE
- KSA
- Israel
- Turkey
- Iran
- Rest of Middle East
- Africa
- Egypt
- Nigeria
- Algeria
- Morocco
- Rest of Africa
Regional Analysis
North America
North America accounts for 27% of the Intercity Buses market, supported by strong demand for regional and cross-border travel. The region benefits from advanced road infrastructure and a highly organized network of intercity bus operators. Motor coaches dominate the market, offering comfortable and affordable alternatives to air and rail travel for medium distances. It gains momentum from the growing adoption of electric buses in the United States and Canada, where governments provide incentives for cleaner fleets. Digital ticketing, GPS-based tracking, and enhanced passenger amenities create stronger consumer appeal. North American operators also invest in premium long-distance routes to attract business and leisure travelers. Market growth is further fueled by suburban expansion and cross-border traffic between the U.S. and Canada, creating steady opportunities for fleet expansion.
Europe
Europe holds 24% of the Intercity Buses market, driven by well-developed cross-country road networks and strong sustainability policies. The region emphasizes low-emission buses, with EU directives pushing operators toward hybrid and electric fleets. It experiences high passenger adoption due to affordable services connecting secondary cities and rural regions. Germany, France, and the UK lead adoption of luxury and long-distance bus services. Technological upgrades in booking systems and integration with multimodal networks strengthen efficiency. Tourist demand also supports higher ridership across popular destinations in Southern and Eastern Europe. The region’s emphasis on reducing carbon footprints positions battery electric buses as a major growth area.
Asia Pacific
Asia Pacific contributes 31% of the Intercity Buses market, making it the largest regional segment. Rapid urbanization, population growth, and rising disposable incomes drive strong demand for affordable and reliable intercity transport. China and India dominate, with large-scale government investments in public transit systems and clean bus fleets. It records expanding adoption of CNG and battery electric buses, supported by regional policies to cut pollution. Operators in Japan and South Korea focus on advanced digital platforms and safety technologies to attract passengers. The region also benefits from extensive tourism industries, which require robust intercity connectivity. Growing integration of rural and urban regions through intercity buses ensures sustained growth momentum across diverse economies.
Latin America
Latin America represents 10% of the Intercity Buses market, shaped by the importance of buses in regional mobility. Countries such as Brazil, Mexico, and Argentina rely heavily on intercity buses as cost-effective transport options. It plays a crucial role where air and rail infrastructure remain limited. Operators focus on improving service quality through luxury coaches, digital ticketing, and safety features. Rising tourism and cross-border trade within South America create new opportunities for route expansion. Governments encourage fleet modernization by introducing policies for cleaner fuels and sustainable buses. Market growth in the region is steady, though economic fluctuations and infrastructure challenges remain limiting factors.
Middle East and Africa
The Middle East and Africa account for 8% of the Intercity Buses market, reflecting slower adoption compared to other regions but rising potential. Gulf countries such as Saudi Arabia and the UAE drive growth through investments in intercity and cross-border connectivity projects. It benefits from government-backed infrastructure development, particularly new highways linking major urban centers. In Africa, intercity buses remain essential due to limited rail and aviation networks. Operators face challenges from underdeveloped infrastructure and inconsistent regulatory environments but continue to see stable demand. Investments in luxury coaches and technology-based ticketing platforms are beginning to improve passenger appeal. Tourism expansion in the Middle East further strengthens demand for premium intercity bus services.
Key Player Analysis
- Van Hool
- Scania
- Tata Motors
- Setra
- Motor Coach Industries (MCI)
- Alexander Dennis
- Yutong
- VDL Bus & Coach
- King Long
- Prevost
Competitive Analysis
The Intercity Buses market features strong competition among leading players including Van Hool, Scania, Tata Motors, Setra, Motor Coach Industries (MCI), Alexander Dennis, Yutong, VDL Bus & Coach, King Long, and Prevost. These companies compete on technological innovation, service quality, and expanding fleets tailored to diverse passenger needs. Their focus lies in introducing sustainable bus models, enhancing digital integration, and improving passenger comfort to strengthen global positioning. The market is shaped by rising demand for low-emission and electric buses, driving investments in hybrid and battery-electric models. Leading manufacturers actively develop advanced safety features, digital ticketing systems, and connected fleet solutions to differentiate in competitive landscapes. Operators favor suppliers that deliver reliable after-sales support, energy-efficient engines, and long-term cost advantages. Strategic partnerships with governments and infrastructure providers enable companies to scale sustainable fleets in both developed and emerging regions. Market competition intensifies through product launches, fleet expansions, and cross-border collaborations. Strong brand presence and consistent innovation help players capture regional opportunities while addressing strict emission regulations. Companies that align with evolving passenger expectations for affordability, safety, and digital services secure stronger growth potential. Continuous R&D investment, coupled with geographic expansion, ensures their resilience in a highly dynamic market environment.
Recent Developments
- In May 2025, Motor Coach Industries (MCI) delivered six new J4500 coaches to GO Riteway, and the coaches featured advanced driver-assistance safety systems, premium interiors, and automated audio-visual systems.
- In 2024, Alexander Dennis announced it will pause coach production in 2025 due to declining volumes since the pandemic.
- In March 2023, Daimler launched the Setra MultiClass 500 LE intercity bus. It was announced with advanced features, including the Predictive Powertrain Control (PPC), which functions in conjunction with an automated manual transmission. The Preventive Brake Assist 2 (PBA 2) was also announced but was not made available until spring 2024
Report Coverage
The research report offers an in-depth analysis based on Bus Type, Seating Capacity, Fuel Type and Geography. It details leading market players, providing an overview of their business, product offerings, investments, revenue streams, and key applications. Additionally, the report includes insights into the competitive environment, SWOT analysis, current market trends, as well as the primary drivers and constraints. Furthermore, it discusses various factors that have driven market expansion in recent years. The report also explores market dynamics, regulatory scenarios, and technological advancements that are shaping the industry. It assesses the impact of external factors and global economic changes on market growth. Lastly, it provides strategic recommendations for new entrants and established companies to navigate the complexities of the market.
Future Outlook
- The Intercity Buses market will expand with rising demand for cost-effective regional travel.
- Electric and hybrid buses will gain wider adoption due to stricter emission norms.
- Operators will invest in premium services to attract high-income and business travelers.
- Digital platforms will dominate with online booking, real-time tracking, and cashless payments.
- Infrastructure development will support growth of cross-border and long-distance bus routes.
- Governments will promote fleet modernization through incentives for cleaner technologies.
- Tourism growth will drive demand for luxury and high-capacity motor coaches.
- Emerging economies will see strong adoption of small and medium intercity buses.
- Safety technologies and connected systems will become standard features in fleets.
- The market will witness stronger collaboration between public and private transport operators.

Request a Free Sample
Fill in your details and we'll send you a free sample report.
- Sample data tables & charts
- Research methodology
Need a Custom Version of This Report?
Tailor the scope, geography, or segments to your exact requirements.
- Custom geography or segment scope
- Direct access to our analyst team
Frequently Asked Questions
What is the current market size for Intercity Buses market, and what is its projected size in 2032?
Which Intercity Buses market segment held the largest share in 2024?
What are the primary factors fueling the growth of the Intercity Buses market?
Who are the leading companies in the Intercity Buses Market?
Table of Content
Chapter 1. Report Introduction
- 1.1 Report Description & Purpose
- 1.1.1 Report Title & Market Definition
- 1.1.2 Unique Selling Propositions (USP) & Key Differentiators
- 1.1.3 Value Proposition for Stakeholders
- 1.2 Research Objectives
- 1.2.1 Market Sizing Objectives (Volume & Revenue) (Volume Where Applicable)
- 1.2.2 Segmentation Objectives
- 1.2.3 Competitive Intelligence Objectives
- 1.2.4 Forecast & Scenario Objectives
- 1.3 Report Scope
- 1.3.1 Intercity Buses Scope – Segments & Subsegments Covered
- 1.3.2 Geographic Scope – Regions & Countries Covered
- 1.3.3 Historical Period, Base Year & Forecast Period (2024; forecast to 2032)
- 1.3.4 Inclusions & Exclusions
- 1.4 Industry Classification & Applicable Codes
- 1.5 Currency, Measurement Units & Valuation Basis
- 1.6 Target Stakeholders
- 1.7 Limitations & Assumptions
Chapter 2. Executive Summary
- 2.1 Global Intercity Buses Market Snapshot
- 2.1.1 Market Size – Historical (2024) & Forecast (2024-2032) (2024: USD 82.07 Billion → 2032: USD 149.67 Billion)
- 2.1.2 Volume & Revenue – Global Totals (Volume Where Applicable)
- 2.1.3 Key Market Highlights – Top Five Facts
- 2.2 Intercity Buses Market Segmentation Snapshot
- 2.2.1 Market Split by Region – 2024 vs. 2032
- 2.3 Competitive Snapshot
- 2.3.1 Top 10 Players by Revenue Share – 2024
- 2.3.2 Top 10 Players by Volume Share – 2024 (Volume Where Applicable)
- 2.3.3 Recent Strategic Developments (18-Month Summary)
- 2.4 Key Investment Highlights & Strategic Conclusions
Chapter 3. Intercity Buses Market Dynamics & Industry Analysis
- 3.1 Market Overview & Context
- 3.1.1 Intercity Buses Market Position in the Broader Industry Value Chain
- 3.1.2 Demand Structure & Purchasing Dynamics
- 3.1.3 Market Maturity & Development Stage by Region
- 3.2 Intercity Buses Market Drivers
- 3.3 Intercity Buses Market Restraints & Challenges
- 3.4 Intercity Buses Market Opportunities
- 3.5 Porter's Five Forces Analysis
- 3.5.1 Threat of New Entrants
- 3.5.2 Bargaining Power of Suppliers
- 3.5.3 Bargaining Power of Buyers
- 3.5.4 Threat of Substitutes
- 3.5.5 Competitive Rivalry – Intensity Assessment
- 3.6 Intercity Buses Value Chain Analysis
- 3.6.1 Upstream – Key Inputs, Resources & Suppliers
- 3.6.1.1 Key Input/Resource 1
- 3.6.1.2 Key Input/Resource 2
- 3.6.1.3 Key Input/Resource 3
- 3.6.2 Midstream – Core Operations & Value Creation
- 3.6.2.1 Operating Model & Process Overview
- 3.6.2.2 Key Operating Locations & Capabilities by Company
- 3.6.3 Downstream – Market Channels & End Users
- 3.6.3.1 Direct Sales & Customer Engagement Channels
- 3.6.3.2 Indirect Sales, Intermediaries & Partner Channels
- 3.6.4 Value Chain Profitability Analysis
- 3.6.1 Upstream – Key Inputs, Resources & Suppliers
- 3.7 PESTEL Analysis
- 3.7.1 Political Factors
- 3.7.2 Economic Factors
- 3.7.3 Social Factors
- 3.7.4 Technological Factors
- 3.7.5 Environmental Factors
- 3.7.6 Legal Factors
- 3.8 Intercity Buses Supply Chain Analysis
- 3.8.1 Critical Input & Resource Availability Risk Assessment
- 3.8.2 Supplier & Operational Concentration Risk (Geographic Exposure)
- 3.8.3 Supply & Service Disruption Impact Analysis
- 3.9 Regulatory & Policy Landscape
Note: The regulatory and policy landscape section covers regulations based on their applicability to the market, Intercity Buses category, geography, and scope of the study. Only regulatory frameworks with a material impact on operations, compliance, trade, sustainability, or market access are analyzed in detail.
Chapter 4. Key Investment Pockets & Opportunity Analysis
- 4.1 Intercity Buses Market Attractiveness Analysis
- 4.1.1 By Region – Investment Attractiveness Matrix (Market Size × CAGR)
- 4.2 Absolute Revenue Growth Opportunity
- 4.2.1 By Region – Absolute Revenue Growth Through 2032
- 4.3 Incremental Demand Opportunity
- 4.3.1 By Region – Incremental Demand Through 2032
- 4.3.2 Segment – Incremental Demand
- 4.4 Emerging Submarket Opportunity Deep Dive (Subject to Applicability)
- 4.5 Priority Market Opportunity Scorecards
- 4.5.1 United States
- 4.5.2 Europe
- 4.5.3 Asia
- 4.5.4 Middle East & Africa
Note: Priority market opportunity scorecards reflect the geographic scope and strategic relevance of the study. Listed markets are indicative and may be adapted to the industry.
Chapter 5. Intercity Buses Cross-Border Trade & Market Access Analysis
- 5.1 International Trade & Cross-Border Activity Overview
- 5.1.1 Global Export Value by Country (2024)
- 5.1.2 Global Export Volume by Country (2024) (Volume Where Applicable)
- 5.1.3 Global Import Value by Country (2024)
- 5.1.4 Global Import Volume by Country (2024) (Volume Where Applicable)
- 5.1.5 Net Trade Balance by Country (2024)
- 5.2 Export Analysis – Segment
- 5.2.1 Category 1 (Applicable Classification Code)
- 5.2.2 Category 2 (Applicable Classification Code)
- 5.2.3 Category 3 (Applicable Classification Code)
- 5.2.4 Category 4 (Applicable Classification Code)
- 5.2.5 Category 5 (Applicable Classification Code)
- 5.3 Import Analysis – Segment
- 5.3.1 Category 1 (Applicable Classification Code)
- 5.3.2 Category 2 (Applicable Classification Code)
- 5.3.3 Category 3 (Applicable Classification Code)
- 5.3.4 Category 4 (Applicable Classification Code)
- 5.3.5 Category 5 (Applicable Classification Code)
- 5.4 Cross-Border Pricing & Transaction Benchmarks
- 5.4.1 Export Pricing – Segment & Country
- 5.4.2 Import Pricing – Segment & Source Country
- 5.4.3 Price Trends (2024)
- 5.5 Key Cross-Border Trade & Delivery Routes
- 5.5.1 Cross-Border Trade/Delivery Route 1
- 5.5.2 Cross-Border Trade/Delivery Route 2
- 5.5.3 Cross-Border Trade/Delivery Route 3
- 5.5.4 Cross-Border Trade/Delivery Route 4
- 5.5.5 Cross-Border Trade/Delivery Route 5
- 5.6 Trade Policy & Market Access Impact Assessment
- 5.6.1 Tariff & Non-Tariff Barriers
- 5.6.2 Regional Trade & Economic Integration Frameworks
- 5.6.3 Bilateral & Multilateral Trade Agreements
- 5.6.4 Cross-Border Operating, Licensing & Localization Requirements
Note: This chapter applies where cross-border trade or delivery is relevant to Intercity Buses. Goods, services, and digital offerings are assessed using applicable classifications and transaction measures. Import-export volumes, trade balances, and route analyses are included only where meaningful to the market.
Chapter 6. Competitive Landscape & Company Benchmarking
- 6.1 Intercity Buses Market Concentration & Structure
- 6.1.1 Herfindahl-Hirschman Index (HHI) – vs. 2024
- 6.1.2 Leading, Mid-Sized & Emerging Player Structure
- 6.1.3 Global, Regional & Local Player Dynamics
- 6.2 Intercity Buses Market Share Analysis – 2024
- 6.2.1 Global Revenue Share by Company
- 6.2.2 Global Volume Share by Company (Volume Where Applicable)
- 6.2.3 Regional Revenue Share
- 6.2.4 Market Share Evolution ( vs. 2024)
- 6.2.5 Company Market Share by Key Segment
- 6.2.6 Company Market Share by Customer Group
- 6.3 Operating Scale, Capacity & Infrastructure Analysis
- 6.3.1 Global Operating Scale & Supply Capacity
- 6.3.2 Resource Utilization & Operating Efficiency
- 6.3.3 Output, Service Delivery & Activity Metrics
- 6.3.4 Operating Footprint & Infrastructure Map
- 6.3.5 Planned Operational & Capacity Expansion
- 6.4 Intercity Buses Competitive Benchmarking Matrix
- 6.4.1 Revenue, Growth, Profitability & Operating Metric Comparison
- 6.4.2 Channel Revenue Mix
- 6.4.3 Geographic Revenue Exposure
- 6.4.4 R&D Intensity
- 6.4.5 Sustainability Maturity
- 6.5 Strategic Developments in Intercity Buses (Last 24 Months)
- 6.5.1 Mergers, Acquisitions & Divestments
- 6.5.2 New Products, Services & Solutions in Intercity Buses
- 6.5.3 Operational & Infrastructure Expansions
- 6.5.4 Strategic Alliances, Joint Ventures & Partnerships
- 6.5.5 Distribution Expansion & Market Entry
- 6.5.6 Sustainability & ESG Initiatives
- 6.6 Competitive Strategy Mapping
- 6.6.1 Leader, Challenger, Follower & Niche Classification
- 6.6.2 Pricing Strategy Comparison
- 6.6.3 Channel Strategy Matrix
Note: Strategic developments are included based on their materiality and the availability of reliable information.
Chapter 7. Global Intercity Buses Market – By Sales & Delivery Channel
- 7.1 Segment Overview
- 7.1.1 Volume & Revenue Split by Channel (2024 & 2032) (Volume Where Applicable)
- 7.1.2 Channel Mix Evolution (2024-2032)
Chapter 8. Regional Market Analysis – Global Overview
- 8.1 Global Regional Overview
- 8.1.1 Regional Volume Share (Volume Where Applicable)
- 8.1.2 Regional Revenue Share
- 8.1.3 Regional Volume by Region (Volume Where Applicable)
- 8.1.4 Regional Revenue by Region
- 8.1.5 Regional Forecast Through 2032
- 8.2 Cross-Regional Segment Analysis
- 8.2.1 By Sales & Delivery Channel
- 8.2.2 By Competitive Positioning & Price Tier
Chapter 9. North America Intercity Buses Market
- 9.1 United States
- 9.2 Canada
- 9.3 Mexico
Chapter 10. Europe Intercity Buses Market
- 10.1 Germany
- 10.2 France
- 10.3 Italy
- 10.4 United Kingdom
- 10.5 Spain
- 10.6 Poland
- 10.7 Russia
- 10.8 Netherlands
- 10.9 Belgium
- 10.10 Sweden
- 10.11 Denmark
- 10.12 Norway
- 10.13 Rest of Europe
Chapter 11. Asia Pacific Intercity Buses Market
- 11.1 China
- 11.2 India
- 11.3 Japan
- 11.4 South Korea
- 11.5 Thailand
- 11.6 Indonesia
- 11.7 Vietnam
- 11.8 Malaysia
- 11.9 Australia
- 11.10 Rest of Asia Pacific
Chapter 12. Latin America Intercity Buses Market
- 12.1 Brazil
- 12.2 Argentina
- 12.3 Colombia
- 12.4 Chile
- 12.5 Rest of Latin America
Chapter 13. Middle East Intercity Buses Market
- 13.1 Saudi Arabia
- 13.2 United Arab Emirates
- 13.3 Turkey
- 13.4 Israel
- 13.5 Iran
- 13.6 Rest of the Middle East
Chapter 14. Africa Intercity Buses Market
- 14.1 South Africa
- 14.2 Egypt
- 14.3 Nigeria
- 14.4 Morocco
- 14.5 Rest of Africa
Chapter 15. Intercity Buses Company Profiles
- 15.1 [Company 01]
- 15.1.1 Company Overview
- 15.1.2 Key Management Personnel
- 15.1.3 Products & Services Portfolio
- 15.1.4 Financial Performance
- 15.1.5 Key Market Focus & Geographic Presence
- 15.1.6 Recent Developments & Strategic Initiatives
Note: The company profile list is preliminary and may change based on research findings, market developments, data availability, and client requirements.
Chapter 16. Appendices
- Appendix A – List of Abbreviations & Acronyms
- Appendix B – Industry Classification Code Reference – Full Series
- Appendix C – Supply, Output & Operating Capacity Data Tables
- Appendix D – End-Use & Demand Base Tables
- Appendix E – Demand, Adoption & Usage Assumptions
- Appendix F – Pricing & Revenue Metric Reference Tables
- Appendix G – Company Operations & Infrastructure Database
- Appendix H – Cross-Border Trade & Activity Data Tables (Where Applicable)
- Appendix I – Regulatory Summary Tables
- Appendix J – Primary Research Participant List (Anonymized)
- Appendix K – Primary Research Questionnaire Framework
- Appendix L – Data Sources & Bibliography
- Appendix M – Market Size Divergence & Source Comparison
Chapter 17. Research Methodology
- 17.1 Research Framework & Philosophy
- 17.2 Secondary Research – Sources, Hierarchy & Data Extraction
- 17.3 Data Modeling – Bottom-Up & Top-Down Market Sizing
- 17.4 Primary Research – Stakeholder Framework, LOI & Sample Sizes
- 17.5 Forecast Methodology – Regression, Scenario & Sensitivity Analysis
- 17.6 Quality Control – Four-Layer Validation Framework
- 17.7 Limitations & Standard Assumptions
- 17.8 Disclaimer
