Market Overview
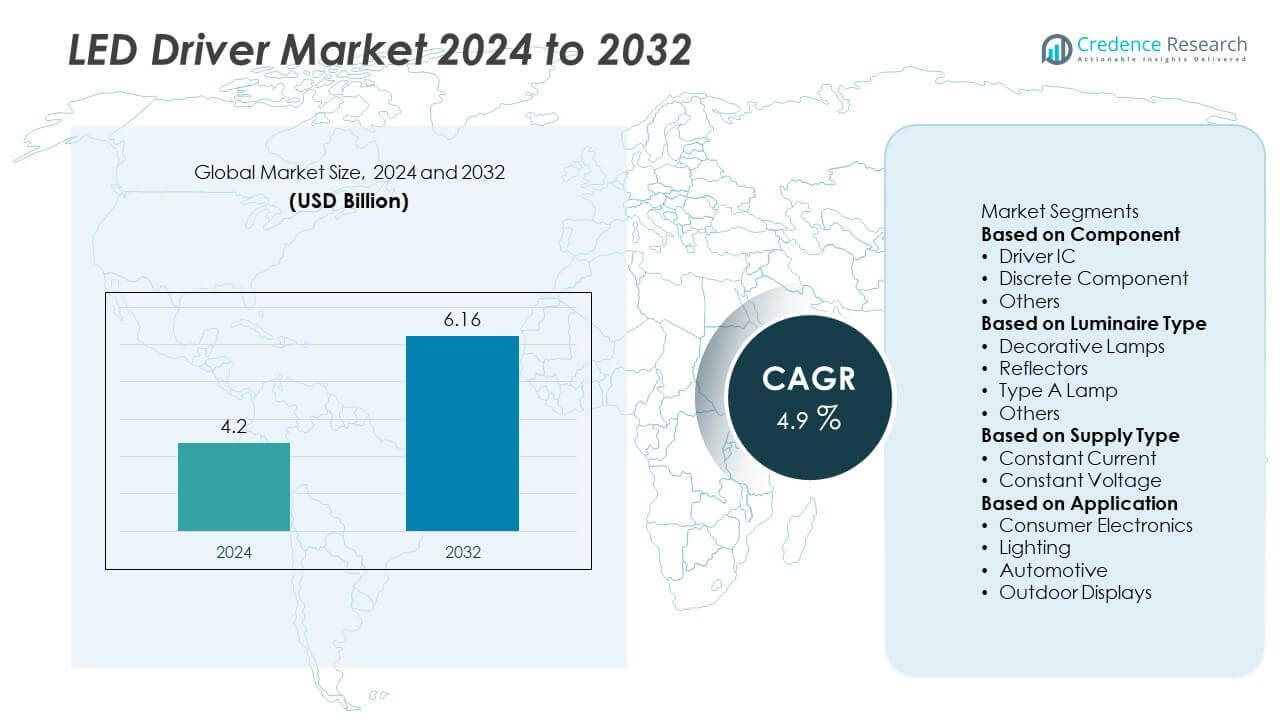
The global LED Driver Market was valued at USD 4.2 billion in 2024. It is projected to reach USD 6.16 billion by 2032, expanding at a CAGR of 4.9% during the forecast period.
| REPORT ATTRIBUTE | DETAILS |
|---|---|
| Historical Period | 2020-2023 |
| Base Year | 2024 |
| Forecast Period | 2025-2032 |
| LED Driver Market Size 2024 | USD 4.2 Billion |
| LED Driver Market, CAGR | 4.9% |
| LED Driver Market Size 2032 | USD 6.16 Billion |
The LED driver market is led by major players such as Signify Holding, Macroblock, Inc., NXP Semiconductors, Cree LED, SAMSUNG, Microchip Technology Inc., Lutron Electronics Co., Inc., Semiconductor Components Industries, LLC, Analog Devices, Inc., and HLI SOLUTIONS, INC. These companies emphasize product innovation, smart connectivity, and high-efficiency solutions to cater to diverse applications, including residential, commercial, automotive, and industrial lighting. Regionally, North America dominated the market in 2024 with 34% share, driven by strong smart lighting adoption and regulatory policies. Europe accounted for 29% share, supported by sustainability initiatives and automotive demand, while Asia Pacific held 26% share, fueled by rapid urbanization, large-scale infrastructure projects, and expanding manufacturing capacity.
 Market Insights
- The global LED driver market was valued at USD 4.2 billion in 2024 and is projected to reach USD 6.16 billion by 2032, expanding at a CAGR of 4.9% during the forecast period.
- Growth is fueled by rising demand for energy-efficient lighting, with the driver IC segment holding 46% share in 2024, supported by widespread use in residential, automotive, and industrial applications.
- Market trends highlight the adoption of constant current drivers, which accounted for 55% share, and increasing integration of IoT and wireless technologies in smart lighting systems.
- The market is highly competitive, with key players such as Signify Holding, SAMSUNG, Cree LED, Microchip Technology Inc., and NXP Semiconductors focusing on innovation, connectivity, and regulatory compliance.
- Regionally, North America led with 34% share, followed by Europe at 29% and Asia Pacific at 26%, while Latin America and the Middle East & Africa contributed 6% and 5% shares, respectively.
Market Segmentation Analysis:
By Component
The driver IC segment dominated the LED driver market in 2024 with 46% share. Driver ICs are widely adopted due to their compact size, efficiency, and ability to regulate power with precision. They are essential in applications requiring high reliability, such as automotive lighting, consumer electronics, and industrial luminaires. Growing demand for energy-efficient lighting and advanced dimming functions further drives adoption. Discrete components continue to serve cost-sensitive markets but are losing share to integrated IC solutions that offer superior performance and reduced design complexity.
- For instance, Macroblock’s MBI6034Q automotive driver IC supports 12 channels with 16-bit grayscale and delivers output currents up to 45 mA per channel, enabling adaptive ambient lighting in vehicles with precise dimming control.
By Luminaire Type
The decorative lamps segment held the largest share of the LED driver market in 2024 with 41% share. These lamps are increasingly used in residential, commercial, and hospitality spaces where aesthetic appeal and energy efficiency are critical. Rising adoption of LED-based decorative fixtures in smart homes and retail establishments has strengthened this segment. Reflectors and Type A lamps also contribute significantly, supported by retrofitting projects and widespread replacement of traditional lighting. Decorative lamps remain dominant due to continuous innovation in design, integration with smart lighting controls, and consumer demand for efficient yet visually appealing solutions.
- For instance, Signify’s Philips Hue decorative smart lamps integrate driver technology that supports over 16 million color options with dimming down to 1% light output, ensuring both aesthetic flexibility and energy efficiency in residential and hospitality settings.
By Supply Type
The constant current segment led the market in 2024 with 55% share, driven by its superior capability to regulate current flow and enhance LED lifespan. It is the preferred choice for applications requiring consistent brightness and reliability, such as streetlights, industrial lighting, and automotive headlamps. The growing need for high-performance lighting solutions in both indoor and outdoor applications has strengthened its dominance. Constant voltage drivers, while holding a smaller share, continue to see adoption in strip lights and signage where flexibility and parallel connections are needed.
Key Growth Drivers
Rising Demand for Energy-Efficient Lighting
The global shift toward energy efficiency is driving LED driver adoption. Governments are phasing out incandescent and halogen lamps, creating demand for LEDs and supporting components. LED drivers enable consistent performance and long lifespan, making them essential in residential, commercial, and industrial applications. The surge in urban development, smart cities, and green building initiatives further boosts the market. With energy-saving requirements becoming more stringent, LED drivers play a critical role in meeting sustainability goals and reducing electricity consumption across sectors.
- For instance, Samsung's LM301H Evo LED package, integrated with advanced driver technology, achieves a photosynthetic photon efficacy (PPE) of up to 3.14 µmol/J at 65 mA, enabling horticultural lighting systems to exceed stringent energy performance standards.
Expansion of Smart Lighting and IoT Integration
The rise of smart homes and connected infrastructure is fueling demand for advanced LED drivers. These drivers support dimming, color tuning, and wireless connectivity, enabling seamless integration with IoT platforms. Consumers and businesses are increasingly adopting smart lighting systems for automation, convenience, and energy savings. Demand is particularly strong in commercial buildings and smart city projects, where intelligent lighting systems improve efficiency. This integration trend positions LED drivers as a key enabler of digital lighting solutions, enhancing both functionality and user experience.
- For instance, Lutron's Athena control system integrates LED drivers with wireless IoT modules, offering smooth dimming down to 0.1%, and is scalable for large-scale commercial building deployments with the potential for thousands of controllable zones by using multiple processors.
Growth in Automotive and Industrial Applications
Automotive lighting and industrial illumination are expanding opportunities for LED drivers. The shift to LED headlights, daytime running lights, and interior lighting in vehicles requires reliable drivers with thermal management and durability. In the industrial sector, demand for high-performance drivers is rising in warehouses, factories, and outdoor facilities where lighting reliability is critical. Safety standards and regulations are accelerating this adoption. Automotive electrification and industrial automation further strengthen growth, as LED drivers ensure long-term efficiency and reduced maintenance in demanding environments.
Key Trends & Opportunities
Adoption of Constant Current Drivers for Reliability
Constant current LED drivers are gaining traction due to their ability to extend LED life and ensure uniform brightness. They dominate applications such as street lighting, industrial facilities, and automotive systems, where consistency and reliability are essential. The rising need for durable and high-performance lighting in infrastructure and smart city projects supports this trend. Manufacturers are also innovating with compact, efficient designs that reduce energy losses and improve overall performance, making constant current drivers a core focus in product development.
- For instance, Cree LED's XLamp XP-G3 S Line integrates constant current driver compatibility and delivers up to 225 lm/W at 350 mA (at 25°C), remaining a popular choice for long-lifetime, highly efficient outdoor lighting due to its efficacy and best-in-class sulfur resistance
Integration with Wireless and Dimming Technologies
LED drivers are increasingly incorporating wireless communication and advanced dimming features. Technologies like Zigbee, Bluetooth, and Wi-Fi enable remote control, smart scheduling, and adaptive brightness. This trend aligns with consumer demand for personalized lighting in homes, as well as energy optimization in commercial and industrial facilities. Opportunities are emerging in integrating drivers with smart building management systems, offering enhanced convenience and efficiency. Such innovations are creating strong market potential, particularly as lighting shifts from simple functionality to intelligent energy management solutions.
- For instance, Signify’s Xitanium SR LED drivers with Zigbee and DALI-2 support allow dimming down to 1% light output while enabling remote diagnostics across networks of up to 500 luminaires, making them widely deployed in smart office and retail environments.
Key Challenges
High Cost of Advanced Drivers
Advanced LED drivers with smart features and connectivity come at higher costs compared to conventional drivers. This pricing challenge restricts adoption in cost-sensitive markets, particularly in developing regions. While long-term energy savings justify the investment, the upfront expense remains a deterrent for budget-conscious consumers and small businesses. Manufacturers face pressure to balance innovation with affordability, requiring scalable production methods and cost-optimized designs to expand market reach effectively.
Complexity in Design and Compatibility Issues
Designing LED drivers that meet diverse application needs and comply with global standards is a challenge. Drivers must match different LED modules, dimming protocols, and voltage requirements, often creating compatibility issues. This complexity increases development costs and limits interoperability across systems. Inconsistent standards between regions also add hurdles for global manufacturers. Overcoming these challenges requires investment in modular, standardized driver designs and collaborative efforts to ensure seamless integration across lighting ecosystems.
Regional Analysis
North America
North America led the LED driver market in 2024 with 34% share, driven by rapid adoption of energy-efficient lighting solutions across commercial, industrial, and residential sectors. The United States dominates demand with government-backed initiatives to reduce energy consumption and strong integration of smart lighting in urban infrastructure. Canada also contributes significantly through rising adoption of LED drivers in smart homes and public projects. Robust presence of leading manufacturers and early adoption of IoT-based lighting systems support the region’s growth. Rising investments in connected infrastructure continue to position North America as a key driver of global demand.
Europe
Europe accounted for 29% share of the LED driver market in 2024, supported by stringent EU energy regulations and the widespread shift toward sustainable lighting. Countries such as Germany, the United Kingdom, and France are leading adopters due to smart city initiatives and extensive replacement of traditional lighting. Automotive applications also drive demand, with LED drivers used in advanced headlights and interior lighting systems. Strong investments in renewable energy integration and advanced dimming technologies enhance growth. Europe’s regulatory environment and focus on decarbonization ensure continued adoption of LED drivers across multiple end-use sectors.
Asia Pacific
Asia Pacific held 26% share of the LED driver market in 2024, fueled by large-scale urbanization and expanding infrastructure projects. China dominates regional demand with government-driven energy efficiency programs and growing manufacturing capacity. India and Southeast Asian countries are witnessing rapid adoption due to increasing electricity demand and replacement of conventional lighting in residential and commercial spaces. Japan contributes with advanced automotive and industrial applications. Expanding smart city projects and rising consumer adoption of smart homes strengthen growth. Asia Pacific remains the fastest-growing region, supported by cost advantages, rising investments, and strong policy support for efficient lighting.
Latin America
Latin America represented 6% share of the LED driver market in 2024, supported by ongoing electrification and rising demand for energy-efficient lighting solutions. Brazil and Mexico drive most of the demand, with adoption in commercial facilities, street lighting, and residential projects. Government initiatives to improve energy efficiency and reduce grid stress also support market growth. However, high upfront costs of advanced drivers remain a challenge in cost-sensitive areas. Despite these constraints, growing urban populations and increasing awareness of energy savings are expected to strengthen the role of LED drivers across the region in the coming years.
Middle East & Africa
The Middle East & Africa accounted for 5% share of the LED driver market in 2024. Rising investments in infrastructure modernization and urban development projects in Gulf countries, particularly Saudi Arabia and the UAE, are driving adoption. Demand is also supported by initiatives to replace conventional lighting with LEDs in commercial and residential sectors. South Africa contributes through applications in street lighting and industrial facilities, though limited affordability and lack of awareness hinder broader adoption. Growing integration of smart city projects and focus on energy efficiency are expected to provide long-term opportunities in the region.
Market Segmentations:
By Component
- Driver IC
- Discrete Component
- Others
By Luminaire Type
- Decorative Lamps
- Reflectors
- Type A Lamp
- Others
By Supply Type
- Constant Current
- Constant Voltage
By Application
- Consumer Electronics
- Lighting
- Automotive
- Outdoor Displays
By Geography
- North America
- U.S.
- Canada
- Mexico
- Europe
- UK
- France
- Germany
- Italy
- Spain
- Russia
- Belgium
- Netherlands
- Austria
- Sweden
- Poland
- Denmark
- Switzerland
- Rest of Europe
- Asia Pacific
- China
- Japan
- South Korea
- India
- Australia
- Thailand
- Indonesia
- Vietnam
- Malaysia
- Philippines
- Taiwan
- Rest of Asia Pacific
- Latin America
- Brazil
- Argentina
- Peru
- Chile
- Colombia
- Rest of Latin America
- Middle East
- UAE
- KSA
- Israel
- Turkey
- Iran
- Rest of Middle East
- Africa
- Egypt
- Nigeria
- Algeria
- Morocco
- Rest of Africa
Competitive Landscape
The competitive landscape of the LED driver market is shaped by leading players including Signify Holding, Macroblock, Inc., NXP Semiconductors, Cree LED, SAMSUNG, Microchip Technology Inc., Lutron Electronics Co., Inc., Semiconductor Components Industries, LLC, Analog Devices, Inc., and HLI SOLUTIONS, INC. These companies focus on developing innovative driver solutions that enhance energy efficiency, enable smart connectivity, and support diverse lighting applications across residential, commercial, automotive, and industrial sectors. Strategies center on expanding portfolios with constant current and constant voltage drivers, integrating IoT and wireless technologies, and meeting global efficiency standards. Partnerships with lighting manufacturers and infrastructure developers strengthen their market reach, while R&D investments drive advancements in dimming, miniaturization, and thermal management. Asia Pacific remains a key manufacturing hub, while North America and Europe provide strong demand from smart home and automotive markets. Intense competition pushes companies toward cost optimization, regulatory compliance, and next-generation driver solutions tailored for smart lighting ecosystems.
Key Player Analysis
- Signify Holding
- Macroblock, Inc.
- NXP Semiconductors
- Cree LED
- SAMSUNG
- Microchip Technology Inc.
- Lutron Electronics Co., Inc.
- Semiconductor Components Industries, LLC
- Analog Devices, Inc.
- HLI SOLUTIONS, INC.
Recent Developments
- In February 2025, Macroblock launched its DaVinci Series LED driver ICs (e.g. MBI5292) featuring 19-bit grayscale, adaptive refresh, and low-knee voltage designs.
- In 2025, Samsung announced its “Micro RGB” display technology using micro-scale RGB LEDs (each less than 100 µm in size), showcasing fine control over each red, green, blue LED.
- In 2025, Macroblock introduced the MBI6034Q 12-channel driver IC supporting 16-bit grayscale, now used in ambient lighting systems for automobile interiors.
- In 2025, Samsung System LSI began mass production of a 22 nm display driver IC (for mobile displays), emphasizing low-power operation and improved efficiency.
Report Coverage
The research report offers an in-depth analysis based on Component, Luminaire Type, Supply Type, Application and Geography. It details leading market players, providing an overview of their business, product offerings, investments, revenue streams, and key applications. Additionally, the report includes insights into the competitive environment, SWOT analysis, current market trends, as well as the primary drivers and constraints. Furthermore, it discusses various factors that have driven market expansion in recent years. The report also explores market dynamics, regulatory scenarios, and technological advancements that are shaping the industry. It assesses the impact of external factors and global economic changes on market growth. Lastly, it provides strategic recommendations for new entrants and established companies to navigate the complexities of the market.
Future Outlook
- Demand for LED drivers will increase with rising adoption of energy-efficient lighting worldwide.
- Constant current drivers will continue to dominate due to their reliability and performance benefits.
- Integration of IoT and wireless technologies will strengthen the role of drivers in smart lighting.
- Automotive lighting will expand as LED drivers support advanced headlamps and interior systems.
- Miniaturization and compact driver designs will gain traction in portable and consumer electronics.
- Europe will see strong growth due to sustainability regulations and green building initiatives.
- Asia Pacific will record the fastest expansion supported by urbanization and large-scale infrastructure projects.
- North America will maintain leadership with strong demand from smart homes and commercial projects.
- High production and design costs will remain a challenge in price-sensitive markets.
- Competition will intensify as companies focus on innovation, connectivity, and advanced thermal management.

Request a Free Sample
Fill in your details and we'll send you a free sample report.
- Sample data tables & charts
- Research methodology
Need a Custom Version of This Report?
Tailor the scope, geography, or segments to your exact requirements.
- Custom geography or segment scope
- Direct access to our analyst team
Frequently Asked Questions
What is the current market size for LED Driver market, and what is its projected size in 2032?
At what Compound Annual Growth Rate is the LED Driver market projected to grow between 2025 and 2032?
Which LED Driver market segment held the largest share in 2024?
What are the primary factors fueling the growth of the LED Driver market?
Who are the leading companies in the LED Driver market?
Which region commanded the largest share of the LED Driver market in 2024?
Table of Content
Chapter 1. Report Introduction
- 1.1 Report Description & Purpose
- 1.1.1 Report Title & Market Definition
- 1.1.2 Unique Selling Propositions (USP) & Key Differentiators
- 1.1.3 Value Proposition for Stakeholders
- 1.2 Research Objectives
- 1.2.1 Market Sizing Objectives (Volume & Revenue) (Volume Where Applicable)
- 1.2.2 Segmentation Objectives
- 1.2.3 Competitive Intelligence Objectives
- 1.2.4 Forecast & Scenario Objectives
- 1.3 Report Scope
- 1.3.1 LED Driver Scope – Segments & Subsegments Covered
- 1.3.2 Geographic Scope – Regions & Countries Covered
- 1.3.3 Historical Period, Base Year & Forecast Period (2024; forecast to 2032)
- 1.3.4 Inclusions & Exclusions
- 1.4 Industry Classification & Applicable Codes
- 1.5 Currency, Measurement Units & Valuation Basis
- 1.6 Target Stakeholders
- 1.7 Limitations & Assumptions
Chapter 2. Executive Summary
- 2.1 Global LED Driver Market Snapshot
- 2.1.1 Market Size – Historical (2024) & Forecast (2024-2032) (2024: USD 4.2 billion → 2032: USD 6.16 billion)
- 2.1.2 Volume & Revenue – Global Totals (Volume Where Applicable)
- 2.1.3 Key Market Highlights – Top Five Facts
- 2.2 LED Driver Market Segmentation Snapshot
- 2.2.1 Market Split by Region – 2024 vs. 2032
- 2.3 Competitive Snapshot
- 2.3.1 Top 10 Players by Revenue Share – 2024
- 2.3.2 Top 10 Players by Volume Share – 2024 (Volume Where Applicable)
- 2.3.3 Recent Strategic Developments (18-Month Summary)
- 2.4 Key Investment Highlights & Strategic Conclusions
Chapter 3. LED Driver Market Dynamics & Industry Analysis
- 3.1 Market Overview & Context
- 3.1.1 LED Driver Market Position in the Broader Industry Value Chain
- 3.1.2 Demand Structure & Purchasing Dynamics
- 3.1.3 Market Maturity & Development Stage by Region
- 3.2 LED Driver Market Drivers
- 3.3 LED Driver Market Restraints & Challenges
- 3.4 LED Driver Market Opportunities
- 3.5 Porter's Five Forces Analysis
- 3.5.1 Threat of New Entrants
- 3.5.2 Bargaining Power of Suppliers
- 3.5.3 Bargaining Power of Buyers
- 3.5.4 Threat of Substitutes
- 3.5.5 Competitive Rivalry – Intensity Assessment
- 3.6 LED Driver Value Chain Analysis
- 3.6.1 Upstream – Key Inputs, Resources & Suppliers
- 3.6.1.1 Key Input/Resource 1
- 3.6.1.2 Key Input/Resource 2
- 3.6.1.3 Key Input/Resource 3
- 3.6.2 Midstream – Core Operations & Value Creation
- 3.6.2.1 Operating Model & Process Overview
- 3.6.2.2 Key Operating Locations & Capabilities by Company
- 3.6.3 Downstream – Market Channels & End Users
- 3.6.3.1 Direct Sales & Customer Engagement Channels
- 3.6.3.2 Indirect Sales, Intermediaries & Partner Channels
- 3.6.4 Value Chain Profitability Analysis
- 3.6.1 Upstream – Key Inputs, Resources & Suppliers
- 3.7 PESTEL Analysis
- 3.7.1 Political Factors
- 3.7.2 Economic Factors
- 3.7.3 Social Factors
- 3.7.4 Technological Factors
- 3.7.5 Environmental Factors
- 3.7.6 Legal Factors
- 3.8 LED Driver Supply Chain Analysis
- 3.8.1 Critical Input & Resource Availability Risk Assessment
- 3.8.2 Supplier & Operational Concentration Risk (Geographic Exposure)
- 3.8.3 Supply & Service Disruption Impact Analysis
- 3.9 Regulatory & Policy Landscape
Note: The regulatory and policy landscape section covers regulations based on their applicability to the market, LED Driver category, geography, and scope of the study. Only regulatory frameworks with a material impact on operations, compliance, trade, sustainability, or market access are analyzed in detail.
Chapter 4. Key Investment Pockets & Opportunity Analysis
- 4.1 LED Driver Market Attractiveness Analysis
- 4.1.1 By Region – Investment Attractiveness Matrix (Market Size × CAGR)
- 4.2 Absolute Revenue Growth Opportunity
- 4.2.1 By Region – Absolute Revenue Growth Through 2032
- 4.3 Incremental Demand Opportunity
- 4.3.1 By Region – Incremental Demand Through 2032
- 4.3.2 Segment – Incremental Demand
- 4.4 Emerging Submarket Opportunity Deep Dive (Subject to Applicability)
- 4.5 Priority Market Opportunity Scorecards
- 4.5.1 United States
- 4.5.2 Europe
- 4.5.3 Asia
- 4.5.4 Middle East & Africa
Note: Priority market opportunity scorecards reflect the geographic scope and strategic relevance of the study. Listed markets are indicative and may be adapted to the industry.
Chapter 5. LED Driver Cross-Border Trade & Market Access Analysis
- 5.1 International Trade & Cross-Border Activity Overview
- 5.1.1 Global Export Value by Country (2024)
- 5.1.2 Global Export Volume by Country (2024) (Volume Where Applicable)
- 5.1.3 Global Import Value by Country (2024)
- 5.1.4 Global Import Volume by Country (2024) (Volume Where Applicable)
- 5.1.5 Net Trade Balance by Country (2024)
- 5.2 Export Analysis – Segment
- 5.2.1 Category 1 (Applicable Classification Code)
- 5.2.2 Category 2 (Applicable Classification Code)
- 5.2.3 Category 3 (Applicable Classification Code)
- 5.2.4 Category 4 (Applicable Classification Code)
- 5.2.5 Category 5 (Applicable Classification Code)
- 5.3 Import Analysis – Segment
- 5.3.1 Category 1 (Applicable Classification Code)
- 5.3.2 Category 2 (Applicable Classification Code)
- 5.3.3 Category 3 (Applicable Classification Code)
- 5.3.4 Category 4 (Applicable Classification Code)
- 5.3.5 Category 5 (Applicable Classification Code)
- 5.4 Cross-Border Pricing & Transaction Benchmarks
- 5.4.1 Export Pricing – Segment & Country
- 5.4.2 Import Pricing – Segment & Source Country
- 5.4.3 Price Trends (2024)
- 5.5 Key Cross-Border Trade & Delivery Routes
- 5.5.1 Cross-Border Trade/Delivery Route 1
- 5.5.2 Cross-Border Trade/Delivery Route 2
- 5.5.3 Cross-Border Trade/Delivery Route 3
- 5.5.4 Cross-Border Trade/Delivery Route 4
- 5.5.5 Cross-Border Trade/Delivery Route 5
- 5.6 Trade Policy & Market Access Impact Assessment
- 5.6.1 Tariff & Non-Tariff Barriers
- 5.6.2 Regional Trade & Economic Integration Frameworks
- 5.6.3 Bilateral & Multilateral Trade Agreements
- 5.6.4 Cross-Border Operating, Licensing & Localization Requirements
Note: This chapter applies where cross-border trade or delivery is relevant to LED Driver. Goods, services, and digital offerings are assessed using applicable classifications and transaction measures. Import-export volumes, trade balances, and route analyses are included only where meaningful to the market.
Chapter 6. Competitive Landscape & Company Benchmarking
- 6.1 LED Driver Market Concentration & Structure
- 6.1.1 Herfindahl-Hirschman Index (HHI) – the historical period vs. 2024
- 6.1.2 Leading, Mid-Sized & Emerging Player Structure
- 6.1.3 Global, Regional & Local Player Dynamics
- 6.2 LED Driver Market Share Analysis – 2024
- 6.2.1 Global Revenue Share by Company
- 6.2.2 Global Volume Share by Company (Volume Where Applicable)
- 6.2.3 Regional Revenue Share
- 6.2.4 Market Share Evolution (the historical period vs. 2024)
- 6.2.5 Company Market Share by Key Segment
- 6.2.6 Company Market Share by Customer Group
- 6.3 Operating Scale, Capacity & Infrastructure Analysis
- 6.3.1 Global Operating Scale & Supply Capacity
- 6.3.2 Resource Utilization & Operating Efficiency
- 6.3.3 Output, Service Delivery & Activity Metrics
- 6.3.4 Operating Footprint & Infrastructure Map
- 6.3.5 Planned Operational & Capacity Expansion
- 6.4 LED Driver Competitive Benchmarking Matrix
- 6.4.1 Revenue, Growth, Profitability & Operating Metric Comparison
- 6.4.2 Channel Revenue Mix
- 6.4.3 Geographic Revenue Exposure
- 6.4.4 R&D Intensity
- 6.4.5 Sustainability Maturity
- 6.5 Strategic Developments in LED Driver (Last 24 Months)
- 6.5.1 Mergers, Acquisitions & Divestments
- 6.5.2 New Products, Services & Solutions in LED Driver
- 6.5.3 Operational & Infrastructure Expansions
- 6.5.4 Strategic Alliances, Joint Ventures & Partnerships
- 6.5.5 Distribution Expansion & Market Entry
- 6.5.6 Sustainability & ESG Initiatives
- 6.6 Competitive Strategy Mapping
- 6.6.1 Leader, Challenger, Follower & Niche Classification
- 6.6.2 Pricing Strategy Comparison
- 6.6.3 Channel Strategy Matrix
Note: Strategic developments are included based on their materiality and the availability of reliable information.
Chapter 7. Global LED Driver Market – By Sales & Delivery Channel
- 7.1 Segment Overview
- 7.1.1 Volume & Revenue Split by Channel (2024 & 2032) (Volume Where Applicable)
- 7.1.2 Channel Mix Evolution (2024-2032)
Chapter 8. Regional Market Analysis – Global Overview
- 8.1 Global Regional Overview
- 8.1.1 Regional Volume Share (Volume Where Applicable)
- 8.1.2 Regional Revenue Share
- 8.1.3 Regional Volume by Region (Volume Where Applicable)
- 8.1.4 Regional Revenue by Region
- 8.1.5 Regional Forecast Through 2032
- 8.2 Cross-Regional Segment Analysis
- 8.2.1 By Sales & Delivery Channel
- 8.2.2 By Competitive Positioning & Price Tier
Chapter 9. North America LED Driver Market
- 9.1 United States
- 9.2 Canada
- 9.3 Mexico
Chapter 10. Europe LED Driver Market
- 10.1 Germany
- 10.2 France
- 10.3 Italy
- 10.4 United Kingdom
- 10.5 Spain
- 10.6 Poland
- 10.7 Russia
- 10.8 Netherlands
- 10.9 Belgium
- 10.10 Sweden
- 10.11 Denmark
- 10.12 Norway
- 10.13 Rest of Europe
Chapter 11. Asia Pacific LED Driver Market
- 11.1 China
- 11.2 India
- 11.3 Japan
- 11.4 South Korea
- 11.5 Thailand
- 11.6 Indonesia
- 11.7 Vietnam
- 11.8 Malaysia
- 11.9 Australia
- 11.10 Rest of Asia Pacific
Chapter 12. Latin America LED Driver Market
- 12.1 Brazil
- 12.2 Argentina
- 12.3 Colombia
- 12.4 Chile
- 12.5 Rest of Latin America
Chapter 13. Middle East LED Driver Market
- 13.1 Saudi Arabia
- 13.2 United Arab Emirates
- 13.3 Turkey
- 13.4 Israel
- 13.5 Iran
- 13.6 Rest of the Middle East
Chapter 14. Africa LED Driver Market
- 14.1 South Africa
- 14.2 Egypt
- 14.3 Nigeria
- 14.4 Morocco
- 14.5 Rest of Africa
Chapter 15. LED Driver Company Profiles
- 15.1 [Company 01]
- 15.1.1 Company Overview
- 15.1.2 Key Management Personnel
- 15.1.3 Products & Services Portfolio
- 15.1.4 Financial Performance
- 15.1.5 Key Market Focus & Geographic Presence
- 15.1.6 Recent Developments & Strategic Initiatives
Note: The company profile list is preliminary and may change based on research findings, market developments, data availability, and client requirements.
Chapter 16. Appendices
- Appendix A – List of Abbreviations & Acronyms
- Appendix B – Industry Classification Code Reference – Full Series
- Appendix C – Supply, Output & Operating Capacity Data Tables
- Appendix D – End-Use & Demand Base Tables
- Appendix E – Demand, Adoption & Usage Assumptions
- Appendix F – Pricing & Revenue Metric Reference Tables
- Appendix G – Company Operations & Infrastructure Database
- Appendix H – Cross-Border Trade & Activity Data Tables (Where Applicable)
- Appendix I – Regulatory Summary Tables
- Appendix J – Primary Research Participant List (Anonymized)
- Appendix K – Primary Research Questionnaire Framework
- Appendix L – Data Sources & Bibliography
- Appendix M – Market Size Divergence & Source Comparison
Chapter 17. Research Methodology
- 17.1 Research Framework & Philosophy
- 17.2 Secondary Research – Sources, Hierarchy & Data Extraction
- 17.3 Data Modeling – Bottom-Up & Top-Down Market Sizing
- 17.4 Primary Research – Stakeholder Framework, LOI & Sample Sizes
- 17.5 Forecast Methodology – Regression, Scenario & Sensitivity Analysis
- 17.6 Quality Control – Four-Layer Validation Framework
- 17.7 Limitations & Standard Assumptions
- 17.8 Disclaimer