
Market Overview
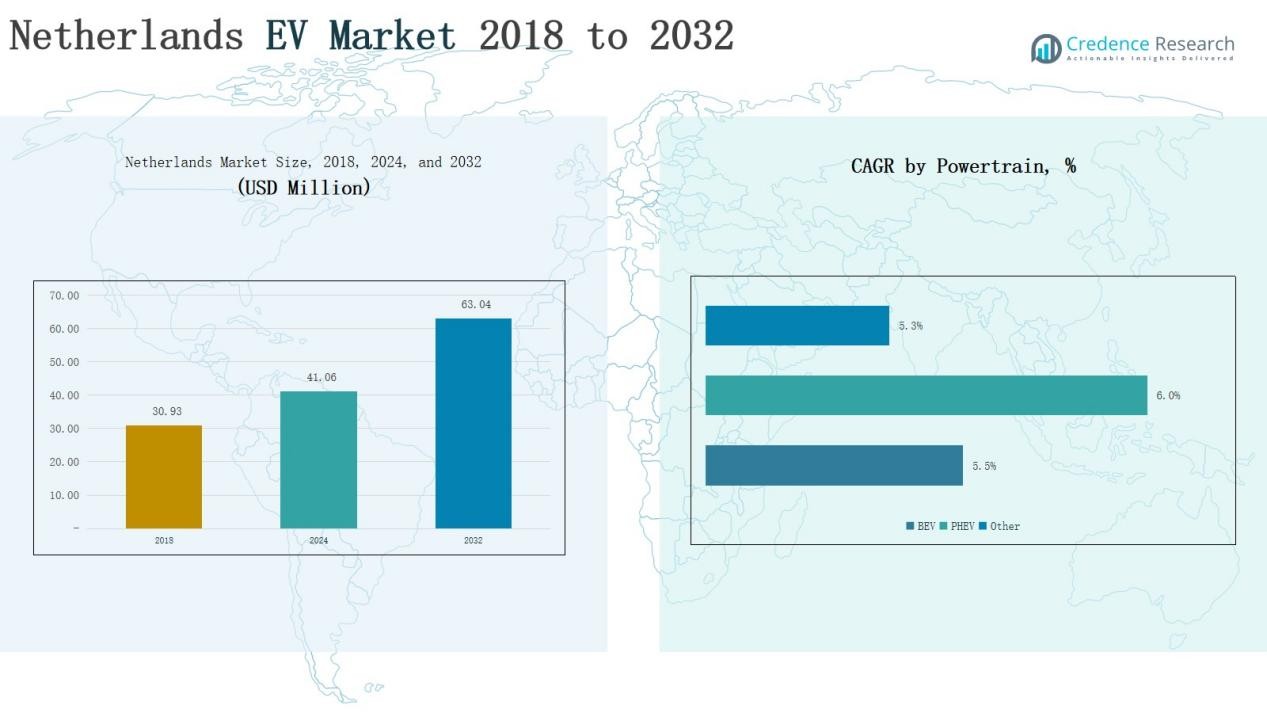
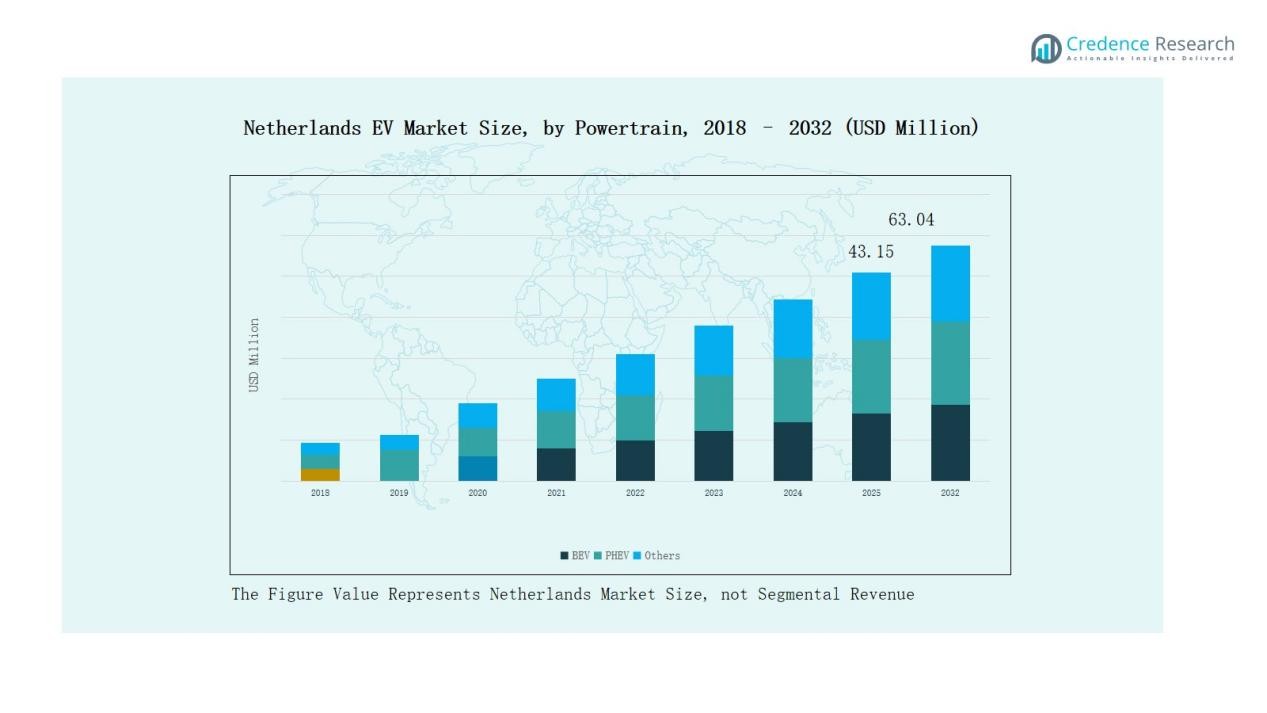
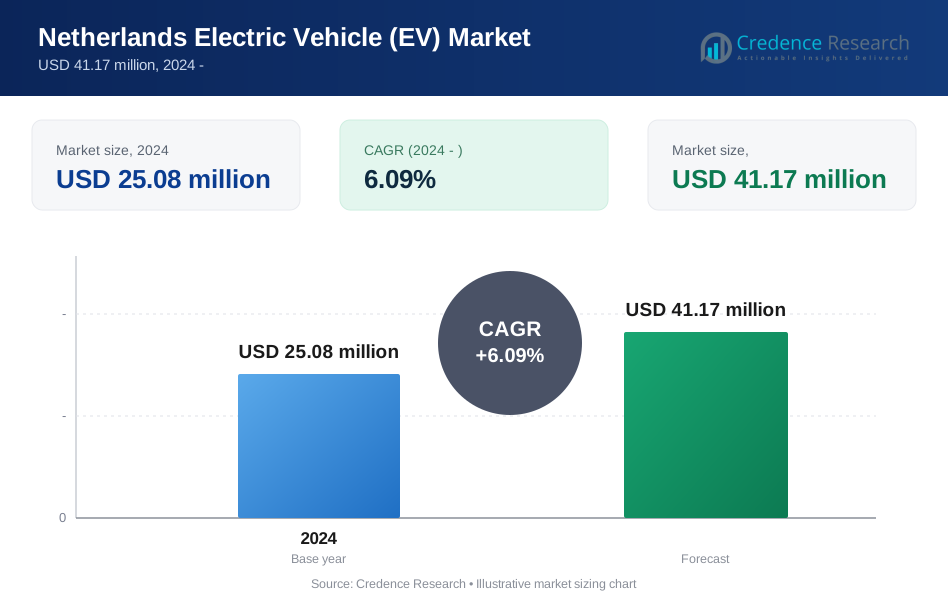
Netherlands Electric Vehicle (EV) Market size was valued at USD 17.99 million in 2018 to USD 25.08 million in 2024 and is anticipated to reach USD 41.17 million by 2032, at a CAGR of 6.09% during the forecast period.
| REPORT ATTRIBUTE | DETAILS |
|---|---|
| Historical Period | 2020-2023 |
| Base Year | 2024 |
| Forecast Period | 2025-2032 |
| Netherlands EV Market Size 2024 | USD 25.08 Million |
| Netherlands EV Market, CAGR | 6.09% |
| Netherlands EV Market Size 2032 | USD 41.17 Million |
The Netherlands EV Market is shaped by strong competition among leading automakers, each driving adoption through innovation, affordability, and sustainability. Volkswagen, BMW AG, Mercedes-Benz, Tesla, Volvo, Audi, Skoda, Dott, and Geely Holding dominate the landscape with diversified product portfolios and strategic investments in charging infrastructure. Tesla leads the premium BEV category with advanced technology and an extensive supercharger network, while Volkswagen and Volvo drive mass-market penetration with affordable, reliable models. Luxury brands such as BMW, Mercedes-Benz, and Audi reinforce their presence through performance-focused EVs, while Geely Holding and Skoda expand accessibility with cost-efficient offerings. Local operator Dott complements adoption by advancing micro-mobility solutions. Regionally, Eastern Netherlands commanded the largest share at 45% in 2024, supported by dense urbanization, advanced charging networks, and strong policy frameworks that continue to accelerate consumer and corporate adoption.
Market Insights
- The Netherlands EV Market grew from USD 17.99 million in 2018 to USD 25.08 million in 2024 and is expected to reach USD 41.17 million by 2032 at a CAGR of 6.09%.
- Battery Electric Vehicles held the largest share with 68% in 2024, while Plug-in Hybrid Electric Vehicles captured 24% and other powertrain types accounted for 8%.
- Private buyers dominated end-user adoption with 71% share in 2024, supported by incentives and tax benefits, while corporate buyers contributed 29% through fleet electrification programs.
- Eastern Netherlands led regionally with 45% share in 2024, followed by Western Netherlands at 32%, Northern Netherlands at 13%, and Southern Netherlands at 10%.
- Key players include Volkswagen, BMW AG, Mercedes-Benz, Tesla, Volvo, Audi, Skoda, Dott, and Geely Holding, each competing through innovation, affordability, and charging infrastructure expansion.
Market Segment Insights
By Powertrain
Battery Electric Vehicles (BEVs) dominate the Netherlands EV Market, holding 68% share in 2024. Growth is driven by strong government incentives, zero-emission targets, and an extensive charging network supporting nationwide adoption. Plug-in Hybrid Electric Vehicles (PHEVs) accounted for 24% share, supported by buyers seeking range flexibility for both short commutes and longer trips. The remaining 8% share comes from other powertrain options, including fuel cell EVs and hybrid technologies, appealing to niche buyers focused on alternative solutions.
- For instance, BYD launched its Dolphin hatchback in the Dutch market, expanding its affordable BEV portfolio and meeting growing demand from first-time EV buyers.
By End User
Private buyers represent the dominant segment, capturing 71% share in 2024. Their uptake is fueled by financial incentives, tax exemptions, and a growing preference for sustainable personal mobility. Corporate buyers hold 29% share, with demand led by fleet electrification programs, sustainability commitments, and cost-efficient operations. The corporate segment continues to expand steadily as businesses align with national emission-reduction policies and low-emission zone requirements in Dutch cities.
- For instance, in the Netherlands, 48% of new car registrations in 2024 were attributed to businesses, with 55.9% of company-cars being rechargeable (BEVs or PHEVs).
Key Growth Drivers
Strong Government Incentives and Regulations
Government policies remain a major driver of EV adoption in the Netherlands. Tax benefits, registration fee exemptions, and subsidies for EV purchases encourage private and corporate buyers. The Dutch government also enforces strict emission standards and plans to phase out fossil fuel vehicles by 2035. These regulatory frameworks create a strong push toward electric mobility. Together, financial incentives and legislative measures provide stability for automakers and consumers, reinforcing BEV adoption as the dominant powertrain segment.
- For instance, Tesla’s Model 3 benefitted from the Dutch subsidy scheme launched in July 2020, making new BEVs priced between €12,000-€45,000 eligible for a €4,000 rebate.
Expanding Charging Infrastructure
The Netherlands leads Europe in charging station density, significantly boosting EV adoption. The country has invested heavily in public and private charging networks, ensuring easy access for urban and rural users. Fast-charging corridors across highways reduce range anxiety and support long-distance travel. Home and workplace charging initiatives further enhance convenience for private and fleet buyers. This robust infrastructure provides a foundation for sustained EV penetration and reinforces consumer confidence, making the transition to electric mobility more practical and attractive.
- For instance, Shell Recharge announced it had installed over 500 public fast-charging points across the Netherlands, expanding its nationwide network to support highway and city driving.
Rising Consumer Preference for Sustainability
Environmental awareness among Dutch consumers drives demand for zero-emission vehicles. Growing concerns about climate change and air pollution are shifting preferences from traditional cars to electric alternatives. Younger demographics, in particular, view EVs as lifestyle choices aligned with sustainable living. Corporate buyers also integrate EVs into fleets to meet sustainability targets and enhance brand reputation. This cultural shift, supported by eco-friendly values, strengthens long-term market growth. Consumer-driven sustainability ensures demand continues even beyond financial incentives, reinforcing a steady expansion of the EV ecosystem.
Key Trends & Opportunities
Corporate Fleet Electrification
Fleet electrification presents a significant opportunity in the Netherlands EV Market. Corporations increasingly adopt EVs to cut operational costs, comply with emission regulations, and meet environmental commitments. Leasing companies also drive this trend, offering flexible packages for businesses. With low-emission zones expanding in major cities, corporate adoption is expected to accelerate. This shift not only boosts PHEV and BEV sales but also strengthens demand for charging hubs and fleet management solutions, creating opportunities for automakers, infrastructure providers, and service companies.
- For instance, the Netherlands hosts around 180,000 public charging points, the highest number in Europe, which supports expanding corporate fleets and incentivizes adoption through improved infrastructure.
Integration of Smart and Connected Technologies
Smart technologies represent a growing trend in the Dutch EV ecosystem. Automakers are integrating advanced driver-assistance systems, AI-driven energy management, and vehicle-to-grid (V2G) technologies. These innovations allow EVs to serve as mobile energy storage, supporting the national grid. Consumers benefit from enhanced safety, convenience, and cost savings through optimized energy use. With the Netherlands’ strong digital infrastructure, connected EV solutions are poised to grow quickly. This creates opportunities for technology providers, energy companies, and automakers to deliver innovative mobility services.
- For instance, Renault Group launched "Utrecht energized," Europe's first large-scale Vehicle-to-Grid (V2G) car-sharing service in Utrecht. This initiative uses 50 Renault 5 E-Tech electric cars equipped with Mobilize V2G technology to feed electricity back to the grid during peak demand, supporting the city's renewable energy system with 35% of rooftops fitted with solar panels.
Key Challenges
High Upfront Costs
Despite subsidies, the initial purchase price of EVs remains higher than conventional vehicles. Battery costs, though declining, still contribute significantly to pricing challenges. For many middle-income households, affordability limits adoption, especially for larger BEVs. This barrier impacts mass-market penetration, as buyers weigh total ownership costs against short-term expenses. While leasing and financing models provide some relief, the upfront cost challenge continues to hinder broader accessibility in the Netherlands EV Market.
Charging Network Strain
While the Netherlands boasts dense charging coverage, rising EV adoption creates pressure on infrastructure. Peak demand at public stations often leads to waiting times, especially in urban centers. Grid capacity constraints also pose challenges, as high-volume charging strains local networks. Expansion and upgrading of grid infrastructure are critical to sustain growth. Without timely investment, charging bottlenecks may undermine consumer confidence, reducing adoption rates. Efficient planning and smart grid integration are necessary to overcome this structural challenge.
Competition from Alternative Technologies
Alternative powertrain technologies pose a challenge to the Netherlands EV Market. Fuel cell vehicles and hybrid systems continue to attract niche buyers seeking greater range and flexibility. Meanwhile, ongoing advancements in synthetic fuels and biofuels offer competing pathways for decarbonization. These options may divert investment and slow full EV adoption. Automakers must balance development across multiple technologies, creating uncertainty in the market. While BEVs currently lead, competition from alternatives remains a critical barrier to achieving long-term EV dominance.
Regional Analysis
Eastern Netherlands
Eastern Netherlands held the largest share of 45% in 2024, making it the leading regional market. The dominance is supported by high urban density, extensive charging infrastructure, and strong policy implementation. Cities such as Arnhem and Nijmegen drive adoption with eco-mobility projects and green transport initiatives. The Netherlands EV Market benefits from concentrated consumer demand and corporate fleet electrification in this region. It continues to attract investment in public charging and smart grid integration. Eastern Netherlands sets the pace for national adoption trends.
Western Netherlands
Western Netherlands accounted for 32% share in 2024, driven by the economic strength of Amsterdam, Rotterdam, and The Hague. The region benefits from early technology adoption, strong municipal incentives, and a high concentration of corporate buyers. It is a hub for innovative mobility pilots and sustainable urban transport programs. The Netherlands EV Market in this region expands through partnerships between automakers, leasing firms, and local governments. Charging networks are advanced, supporting both private and commercial EVs. Western Netherlands reinforces its position as a critical growth corridor.
Northern Netherlands
Northern Netherlands represented 13% share in 2024, supported by regional policies promoting clean energy and sustainable living. Groningen plays a key role with its strong renewable energy projects, aligning EV growth with green electricity. It demonstrates rising adoption among private buyers encouraged by local incentives. The Netherlands EV Market in this region is shaped by small cities and rural areas, where public charging initiatives bridge accessibility gaps. Corporate adoption is lower but growing as logistics firms expand EV fleets. Northern Netherlands continues to evolve as a secondary growth region.
Southern Netherlands
Southern Netherlands captured 10% share in 2024, reflecting steady but slower adoption compared to other regions. Eindhoven and Maastricht anchor demand with research hubs and cross-border initiatives promoting e-mobility. It contributes to the Netherlands EV Market by integrating innovation from the automotive technology sector, especially through smart charging solutions. Private buyers are increasingly engaged due to government tax incentives and local programs. Corporate uptake grows in logistics and service fleets. Southern Netherlands remains a supportive region with potential for higher adoption.
Market Segmentations:
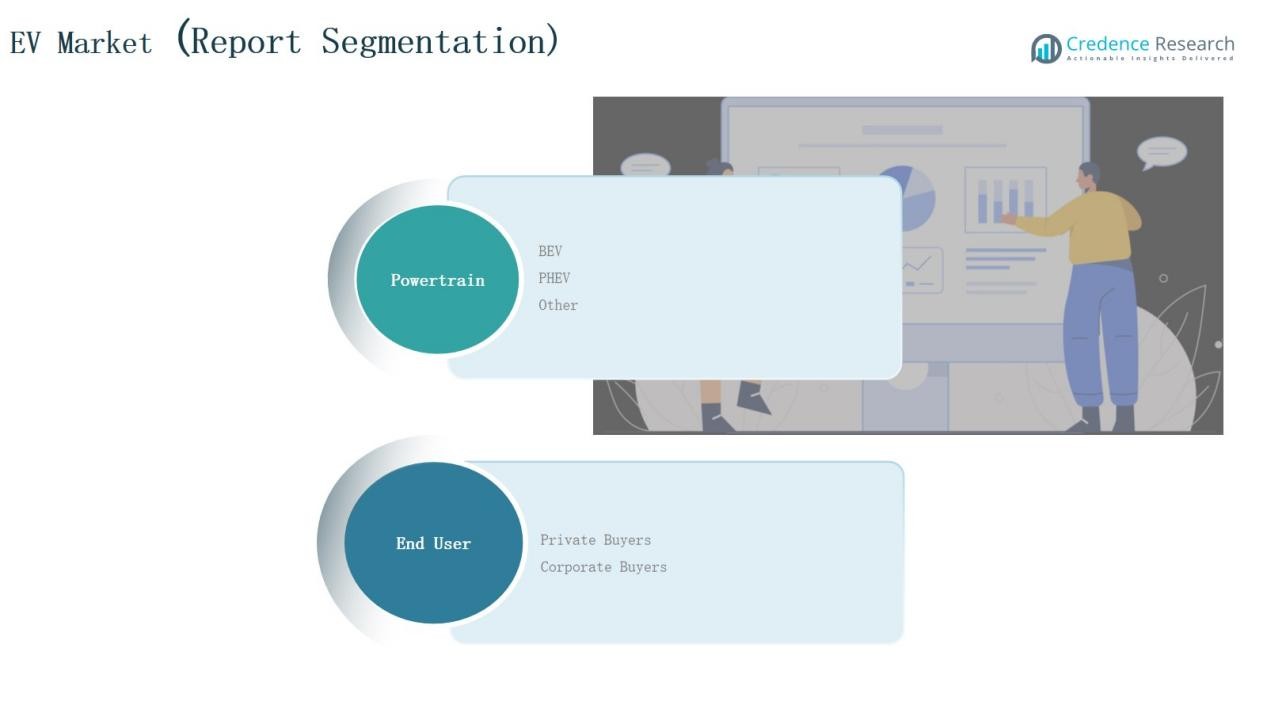
By Powertrain
- Battery Electric Vehicles (BEV)
- Plug-in Hybrid Electric Vehicles (PHEV)
- Others
By End User
- Private Buyers
- Corporate Buyers
By Region
- Eastern Netherlands
- Western Netherlands
- Northen Netherlands
- Southern Netherlands
Competitive Landscape
The Netherlands EV Market is highly competitive, shaped by global automakers and regional players focusing on innovation, affordability, and sustainability. Leading companies such as Volkswagen, BMW, Mercedes-Benz, Tesla, Volvo, Audi, and Skoda maintain strong positions through diverse product portfolios and significant investments in charging infrastructure partnerships. Tesla dominates the premium BEV category with advanced technology and a strong supercharger network, while Volkswagen and Volvo drive mass-market adoption with affordable and reliable models. Mercedes-Benz, BMW, and Audi strengthen their presence by offering performance-oriented EVs to affluent buyers, reinforcing the luxury segment. Geely Holding expands accessibility through cost-efficient EVs appealing to middle-income consumers. Local operators such as Dott contribute by focusing on micro-mobility solutions that complement broader EV adoption. Competitive intensity is reinforced by sustainability commitments, product innovation, and fleet electrification strategies, making the market dynamic and highly attractive for both established players and new entrants.
Key Players
- Volkswagen
- BMW AG
- Mercedes-Benz
- Tesla
- Volvo
- Audi
- Skoda
- Dott
- Geely Holding
- Others
Recent Developments
- On August 14, 2025, Nio began delivering its Firefly compact EVs in the Netherlands and Norway.
- On June 4, 2025, MyWheels added 500 grid-connectable Renault EVs to its fleet to enable vehicle-to-grid (V2G) operations across the Netherlands.
- In early May 2025, VinFast partnered with LKQ Netherlands to expand its post-sales and maintenance service network, starting with nine workshops.
- On September 2, 2025, Q-Park Netherlands teamed up with GreenFlux to migrate its EV supply equipment under GreenFlux’s management system.
Report Coverage
The research report offers an in-depth analysis based on Powertrain, End User and Region. It details leading market players, providing an overview of their business, product offerings, investments, revenue streams, and key applications. Additionally, the report includes insights into the competitive environment, SWOT analysis, current market trends, as well as the primary drivers and constraints. Furthermore, it discusses various factors that have driven market expansion in recent years. The report also explores market dynamics, regulatory scenarios, and technological advancements that are shaping the industry. It assesses the impact of external factors and global economic changes on market growth. Lastly, it provides strategic recommendations for new entrants and established companies to navigate the complexities of the market.
Future Outlook
- Government policies will continue to accelerate EV adoption across private and corporate buyers.
- Expansion of fast-charging corridors will strengthen long-distance travel and reduce range concerns.
- Automakers will introduce more affordable EV models to target middle-income households.
- Fleet electrification programs will grow as corporations align with sustainability goals.
- Integration of smart grid and vehicle-to-grid solutions will enhance energy efficiency.
- Luxury EV demand will rise, supported by innovation in performance and design.
- Local mobility operators will expand micro-mobility EV options in urban centers.
- Consumer preference for zero-emission mobility will remain a strong growth driver.
- Cross-border cooperation with neighboring countries will support infrastructure development.
- Partnerships between automakers and energy companies will shape future charging ecosystems.
Request a Free Sample
Fill in your details and we'll send you a free sample report.
- Sample data tables & charts
- Research methodology
Need a Custom Version of This Report?
Tailor the scope, geography, or segments to your exact requirements.
- Custom geography or segment scope
- Direct access to our analyst team
Frequently Asked Questions
What is the current market size for Netherlands EV Market, and what is its projected size in 2032?
At what Compound Annual Growth Rate is the Netherlands EV Market projected to grow between 2025 and 2032?
Which Netherlands EV Market segment held the largest share in 2024?
What are the primary factors fueling the growth of the Netherlands EV Market?
Who are the leading companies in the Netherlands EV Market?
Which region commanded the largest share of the Netherlands EV Market in 2024?
Table of Content
Chapter 1. Report Introduction
- 1.1 Report Description & Purpose
- 1.1.1 Report Title & Market Definition
- 1.1.2 Unique Selling Propositions (USP) & Key Differentiators
- 1.1.3 Value Proposition for Stakeholders
- 1.2 Research Objectives
- 1.2.1 Market Sizing Objectives (Volume & Revenue)
- 1.2.2 Segmentation Objectives
- 1.2.3 Competitive Intelligence Objectives
- 1.2.4 Forecast & Scenario Objectives
- 1.3 Report Scope
- 1.3.1 Netherlands Electric Vehicle (EV) Scope – Types & Subtypes Covered
- 1.3.2 Geographic Scope – Regions & Countries Covered
- 1.3.3 Historical Period, Base Year & Forecast Period (2024; forecast to the forecast period)
- 1.3.4 Inclusions & Exclusions
- 1.4 HS Code & Classification Framework
- 1.5 Currency, Units & Pricing Basis
- 1.6 Target Stakeholders
- 1.7 Limitations & Assumptions
Chapter 2. Executive Summary
- 2.1 Global Netherlands Electric Vehicle (EV) Market Snapshot
- 2.1.1 Market Size – Historical (2024) & Forecast (the forecast period) (2024: USD 25.08 million → forecast year: USD 41.17 million)
- 2.1.2 Volume & Revenue – Global Totals
- 2.1.3 Key Market Highlights – Top Five Facts
- 2.2 Netherlands Electric Vehicle (EV) Market Segmentation Snapshot
- 2.2.1 Market Split by Region – 2024 vs.
- 2.3 Competitive Snapshot
- 2.3.1 Top 10 Players by Revenue Share – 2024
- 2.3.2 Top 10 Players by Volume Share – 2024
- 2.3.3 Recent Strategic Developments (18-Month Summary)
- 2.4 Key Investment Highlights & Strategic Conclusions
Chapter 3. Netherlands Electric Vehicle (EV) Market Dynamics & Industry Analysis
- 3.1 Market Overview & Context
- 3.1.1 Netherlands Electric Vehicle (EV) Market Position in the Broader Automotive Value Chain
- 3.1.2 OEM vs. Replacement Market Dynamics
- 3.1.3 Market Maturity & Development Stage by Region
- 3.2 Netherlands Electric Vehicle (EV) Market Drivers
- 3.3 Netherlands Electric Vehicle (EV) Market Restraints & Challenges
- 3.4 Netherlands Electric Vehicle (EV) Market Opportunities
- 3.5 Porter's Five Forces Analysis
- 3.5.1 Threat of New Entrants
- 3.5.2 Bargaining Power of Suppliers
- 3.5.3 Bargaining Power of Buyers
- 3.5.4 Threat of Substitutes
- 3.5.5 Competitive Rivalry – Intensity Assessment
- 3.6 Netherlands Electric Vehicle (EV) Value Chain Analysis
- 3.6.1 Upstream – Raw Material/Input Suppliers
- 3.6.1.1 Raw Material/Input 1
- 3.6.1.2 Raw Material/Input 2
- 3.6.1.3 Raw Material/Input 3
- 3.6.2 Midstream – Production/Manufacturing/Service Delivery
- 3.6.2.1 Production/Process Overview
- 3.6.2.2 Key Facility Locations & Capacity by Manufacturer
- 3.6.3 Downstream – Distribution & End Consumer
- 3.6.3.1 Primary Channel – B2B/OEM
- 3.6.3.2 Secondary Channels – Dealer, Retail, Online, Direct
- 3.6.4 Value Chain Profitability Analysis
- 3.6.1 Upstream – Raw Material/Input Suppliers
- 3.7 PESTEL Analysis
- 3.7.1 Political Factors
- 3.7.2 Economic Factors
- 3.7.3 Social Factors
- 3.7.4 Technological Factors
- 3.7.5 Environmental Factors
- 3.7.6 Legal Factors
- 3.8 Netherlands Electric Vehicle (EV) Supply Chain Analysis
- 3.8.1 Raw Material/Input Supply Risk Assessment
- 3.8.2 Manufacturing Concentration Risk (Geographic Exposure)
- 3.8.3 Trade Disruption Impact Analysis
- 3.9 Regulatory & Policy Landscape
Note: The regulatory and policy landscape section covers regulations based on their applicability to the market, Netherlands Electric Vehicle (EV) category, geography, and scope of the study. Only regulatory frameworks with a material impact on operations, compliance, trade, sustainability, or market access are analyzed in detail.
Chapter 4. Key Investment Pockets & Opportunity Analysis
- 4.1 Netherlands Electric Vehicle (EV) Market Attractiveness Analysis
- 4.1.1 By Region – Investment Attractiveness Matrix (Volume × CAGR)
- 4.2 Absolute Revenue Growth Opportunity
- 4.2.1 By Region – Absolute USD Growth Through the forecast period
- 4.3 Incremental Volume Opportunity
- 4.3.1 By Region – Incremental Volume Through the forecast period
- 4.3.2 Segment – Incremental Volume
- 4.4 Emerging Submarket Opportunity Deep Dive (Subject to Applicability)
- 4.5 Emerging Market Opportunity Scorecards
- 4.5.1 United States
- 4.5.2 Europe
- 4.5.3 Asia
- 4.5.4 Middle East & Africa
Note: Emerging Market Opportunity Scorecards will be included based on relevance and strategic importance. Regions listed are indicative and may vary depending on data availability and market dynamics.
Chapter 5. Netherlands Electric Vehicle (EV) Import-Export Analysis & Trade Flows
- 5.1 Global Trade Overview
- 5.1.1 Global Export Value by Country (2024)
- 5.1.2 Global Export Volume by Country (2024)
- 5.1.3 Global Import Value by Country (2024)
- 5.1.4 Global Import Volume by Country (2024)
- 5.1.5 Net Trade Balance by Country (2024)
- 5.2 Export Analysis – Segment
- 5.2.1 Type 1 (HS Code)
- 5.2.2 Type 2 (HS Code)
- 5.2.3 Type 3 (HS Code)
- 5.2.4 Type 4 (HS Code)
- 5.2.5 Type 5 (HS Code)
- 5.3 Import Analysis – Segment
- 5.3.1 Type 1 (HS Code)
- 5.3.2 Type 2 (HS Code)
- 5.3.3 Type 3 (HS Code)
- 5.3.4 Type 4 (HS Code)
- 5.3.5 Type 5 (HS Code)
- 5.4 Average Unit Trade Prices
- 5.4.1 Average Export Price – Segment & Country
- 5.4.2 Average Import Price – Segment & Source Country
- 5.4.3 Price Trends (2024)
- 5.5 Key Trade Route Analysis
- 5.5.1 Trade Route 1
- 5.5.2 Trade Route 2
- 5.5.3 Trade Route 3
- 5.5.4 Trade Route 4
- 5.5.5 Trade Route 5
- 5.6 Trade Policy Impact Assessment
- 5.6.1 US Anti-Dumping & Section 301 Tariffs
- 5.6.2 EU Customs Union Impact
- 5.6.3 Major Free Trade Agreements
- 5.6.4 USMCA Rules of Origin
Note: Trade policy analysis will be included only where relevant to the Netherlands Electric Vehicle (EV) market.
Chapter 6. Competitive Landscape & Company Benchmarking
- 6.1 Netherlands Electric Vehicle (EV) Market Concentration & Structure
- 6.1.1 Herfindahl-Hirschman Index (HHI) – vs. 2024
- 6.1.2 Tier 1, Tier 2 & Tier 3 Market Structure
- 6.1.3 Global, Regional & Local Player Dynamics
- 6.2 Netherlands Electric Vehicle (EV) Market Share Analysis – 2024
- 6.2.1 Global Revenue Share by Company
- 6.2.2 Global Volume Share by Company
- 6.2.3 Regional Revenue Share
- 6.2.4 Market Share Evolution ( vs. 2024)
- 6.2.5 OEM Segment Share by Company
- 6.2.6 Replacement Segment Share by Company
- 6.3 Production/Delivery Capacity & Facility Analysis
- 6.3.1 Global Installed Capacity
- 6.3.2 Capacity Utilization Rates
- 6.3.3 Production/Output Volume
- 6.3.4 Facility Locations & Capacity Map
- 6.3.5 Planned Capacity Additions
- 6.4 Netherlands Electric Vehicle (EV) Competitive Benchmarking Matrix
- 6.4.1 Revenue, Volume, CAGR & Profitability Comparison
- 6.4.2 Channel Revenue Mix
- 6.4.3 Geographic Revenue Exposure
- 6.4.4 R&D Intensity
- 6.4.5 Sustainability Maturity
- 6.5 Strategic Developments in Netherlands Electric Vehicle (EV) (Last 24 Months)
- 6.5.1 Mergers, Acquisitions & Divestments
- 6.5.2 New Netherlands Electric Vehicle (EV) Launches
- 6.5.3 Facility Expansions
- 6.5.4 Strategic Alliances, Joint Ventures & Partnerships
- 6.5.5 Distribution Expansion & Market Entry
- 6.5.6 Sustainability & ESG Initiatives
- 6.6 Competitive Strategy Mapping
- 6.6.1 Leader, Challenger, Follower & Niche Classification
- 6.6.2 Pricing Strategy Comparison
- 6.6.3 Channel Strategy Matrix
Note: Strategic developments are included based on their materiality and the availability of reliable information.
Chapter 7. Global Netherlands Electric Vehicle (EV) Market – By Distribution Channel
- 7.1 Segment Overview
- 7.1.1 Volume & Revenue Split by Channel (2024 & )
- 7.1.2 Channel Mix Evolution (the forecast period)
Chapter 8. Regional Market Analysis – Global Overview
- 8.1 Global Regional Overview
- 8.1.1 Regional Volume Share
- 8.1.2 Regional Revenue Share
- 8.1.3 Regional Volume by Region
- 8.1.4 Regional Revenue by Region
- 8.1.5 Regional Forecast Through the forecast period
- 8.2 Cross-Regional Segment Analysis
- 8.2.1 By Distribution Channel
- 8.2.2 By Brand/Price Tier
Chapter 9. North America Netherlands Electric Vehicle (EV) Market
- 9.1 United States
- 9.2 Canada
- 9.3 Mexico
Chapter 10. Europe Netherlands Electric Vehicle (EV) Market
- 10.1 Germany
- 10.2 France
- 10.3 Italy
- 10.4 United Kingdom
- 10.5 Spain
- 10.6 Poland
- 10.7 Russia
- 10.8 Netherlands
- 10.9 Belgium
- 10.10 Sweden
- 10.11 Denmark
- 10.12 Norway
- 10.13 Rest of Europe
Chapter 11. Asia Pacific Netherlands Electric Vehicle (EV) Market
- 11.1 China
- 11.2 India
- 11.3 Japan
- 11.4 South Korea
- 11.5 Thailand
- 11.6 Indonesia
- 11.7 Vietnam
- 11.8 Malaysia
- 11.9 Australia
- 11.10 Rest of Asia Pacific
Chapter 12. Latin America Netherlands Electric Vehicle (EV) Market
- 12.1 Brazil
- 12.2 Argentina
- 12.3 Colombia
- 12.4 Chile
- 12.5 Rest of Latin America
Chapter 13. Middle East Netherlands Electric Vehicle (EV) Market
- 13.1 Saudi Arabia
- 13.2 United Arab Emirates
- 13.3 Turkey
- 13.4 Israel
- 13.5 Iran
- 13.6 Rest of the Middle East
Chapter 14. Africa Netherlands Electric Vehicle (EV) Market
- 14.1 South Africa
- 14.2 Egypt
- 14.3 Nigeria
- 14.4 Morocco
- 14.5 Rest of Africa
Chapter 15. Netherlands Electric Vehicle (EV) Company Profiles
- 15.1 [Company 01]
- 15.1.1 Company Overview
- 15.1.2 Key Management Personnel
- 15.1.3 Products & Services Portfolio
- 15.1.4 Financial Performance
- 15.1.5 Key Market Focus & Geographic Presence
- 15.1.6 Recent Developments & Strategic Initiatives
Note: The company profile list is preliminary and may change based on research findings, market developments, data availability, and client requirements.
Chapter 16. Appendices
- Appendix A – List of Abbreviations & Acronyms
- Appendix B – Industry Classification Code Reference – Full Series
- Appendix C – Production & Capacity Data Tables
- Appendix D – End-Use & Demand Base Tables
- Appendix E – Consumption & Replacement Rate Assumptions
- Appendix F – ASP Reference Tables
- Appendix G – Manufacturing & Facility Database
- Appendix H – Import-Export Data Tables
- Appendix I – Regulatory Summary Tables
- Appendix J – Primary Research Participant List (Anonymized)
- Appendix K – Primary Research Questionnaire Framework
- Appendix L – Data Sources & Bibliography
- Appendix M – Market Size Divergence & Source Comparison
Chapter 17. Research Methodology
- 17.1 Research Framework & Philosophy
- 17.2 Secondary Research – Sources, Hierarchy & Data Extraction
- 17.3 Data Modeling – Bottom-Up & Top-Down Market Sizing
- 17.4 Primary Research – Stakeholder Framework, LOI & Sample Sizes
- 17.5 Forecast Methodology – Regression, Scenario & Sensitivity Analysis
- 17.6 Quality Control – Four-Layer Validation Framework
- 17.7 Limitations & Standard Assumptions
- 17.8 Disclaimer