
| REPORT ATTRIBUTE | DETAILS |
|---|---|
| Historical Period | 2020-2023 |
| Base Year | 2024 |
| Forecast Period | 2025-2032 |
| Non-Surgical Bio-Implants Market Size 2024 | USD 149.8 million |
| Non-Surgical Bio-Implants Market, CAGR | 7.1% |
| Non-Surgical Bio-Implants Market Size 2032 | USD 259.31 million |
Market Overview:
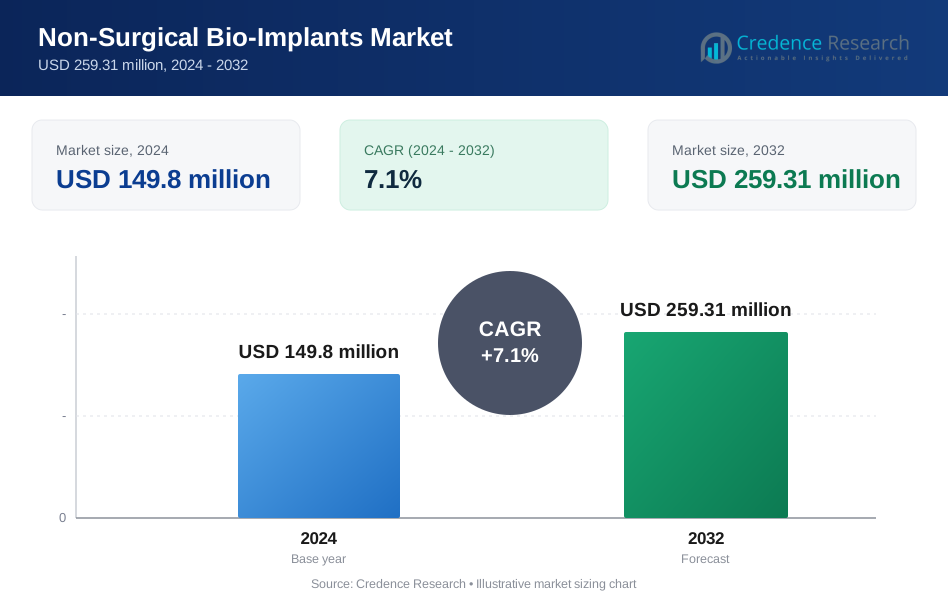
The non-surgical bio-implants market size was valued at USD 149.8 million in 2024 and is anticipated to reach USD 259.31 million by 2032, at a CAGR of 7.1% during the forecast period (2024-2032).
This growth is driven by the increasing adoption of bio-implant procedures and advancements in bioengineering technologies. The market's expansion is further supported by the rising demand for minimally invasive procedures and the growing aging population worldwide. Several factors are driving the growth of the Non-Surgical Bio-Implants Market. The major drivers include the growing concern for chronic disorders, a high level of healthcare awareness, and a growing geriatric population. Additionally, the advancements in technology in bio-implants and the affordable cost with easy availability of bio-implants are expected to have strong growth in the market. Furthermore, the demand for bio-implants in several medical applications is fueling market growth. The increasing prevalence of chronic diseases such as cardiovascular disorders, osteoarthritis, and dental problems is also contributing to the market's growth. Technological advancements in biomaterials and implant design are driving market growth, as innovations in materials such as polymers, ceramics, and biomaterials have enhanced the durability, biocompatibility, and functionality of non-surgical implants.
Regionally, North America is expected to dominate the Non-Surgical Bio-Implants Market due to the presence of well-established healthcare infrastructure, high R&D investments, and favorable reimbursement scenarios. Europe is the largest market for non-surgical bio-implants after North America due to the technological advancements in the region, along with increasing government support and funding and rising research and development activities. The Asia-Pacific region is anticipated to witness significant growth during the forecast period, driven by the expanding healthcare sector and increasing investments in the medical devices industry. Latin America, the Middle East, and Africa are also expected to contribute to the market's growth, supported by the rising adoption of advanced medical technologies and growing consumer awareness of healthcare solutions.
Market Insights:
- The non-surgical bio-implants market is projected to grow from USD 149.8 million in 2024 to USD 259.31 million by 2032, driven by increasing demand for minimally invasive treatments.
- Growing incidences of musculoskeletal disorders, cardiovascular diseases, and neurological conditions are accelerating demand for biocompatible and bioresorbable implants.
- The adoption of 3D printing, biomaterials, and tissue engineering is enhancing customization, durability, and functionality of bio-implants, improving patient outcomes.
- Favorable government policies and funding for biomedical research and regenerative medicine are promoting market expansion, particularly in developed regions.
- High development costs, complex regulatory approvals, and limited awareness in emerging markets remain key challenges to industry growth.
- The United States leads the market, supported by strong healthcare infrastructure, advanced R&D, and increasing adoption of AI-based implant technology.
- The fastest-growing region, driven by rising medical tourism, expanding healthcare investments, and increasing geriatric population in China, India, and Japan.
Market Drivers:
Increasing Geriatric Population:
The global geriatric population is expanding rapidly, creating a substantial demand for non-surgical bio-implants. As life expectancy increases, the prevalence of age-related conditions also rises, necessitating effective and safe treatments. Non-surgical bio-implants offer minimally invasive solutions for various age-related ailments, enhancing the quality of life for the elderly. For instance, the Centers for Medicare and Medicaid Services project that national health spending will continue to increase highlighting the growing investment in healthcare solutions for the aging population. This surge in healthcare expenditure is expected to create opportunities for developing and adopting non-surgical bio-implants tailored to the needs of older adults.
Growing Prevalence of Chronic Disorders:
The rising incidence of chronic disorders, such as cardiovascular diseases, diabetes, and arthritis, is a significant driver for the non-surgical bio-implants market. These conditions often require long-term management and treatment, making non-surgical bio-implants an attractive option due to their reduced invasiveness and quicker recovery times. For instance, the CDC reported that coronary heart disease is the most common type of heart disease, affecting approximately 20.1 million adults aged 20 and older in the United States. Adding to this, the American Heart Association reports that about 836,000 Americans die of cardiovascular disease each year, underscoring the urgent need for effective cardiovascular treatments, including bio-implants.
Technological Advancements in Bioengineering:
Continuous advancements in bioengineering technologies are fueling the growth of the non-surgical bio-implants market. Innovations in materials science, 3D printing, and regenerative medicine are leading to the development of more biocompatible, durable, and effective implants. These technological breakthroughs enhance the functionality and reduce the risk of complications associated with bio-implants. For instance, 3D printing technology enables the creation of customized implants that perfectly align with a patient's unique anatomy, improving surgical outcomes and patient satisfaction. A study published in the journal Advanced Healthcare Materials highlighted that 3D-printed bio-implants showed a 60% improvement in integration with surrounding tissues compared to traditionally manufactured implants. These advancements not only improve the efficacy of treatments but also drive down manufacturing costs, making bio-implants more accessible.
Rising Healthcare Awareness and Disposable Incomes:
Increasing healthcare awareness and rising disposable incomes are contributing to the growth of the non-surgical bio-implants market. As people become more informed about available treatment options and have greater financial resources, they are more likely to opt for advanced medical solutions like bio-implants. For instance, a growing number of individuals are seeking alternatives to traditional surgical implants, driving the demand for non-surgical options. According to a survey by the Kaiser Family Foundation, approximately 75% of Americans are concerned about the potential risks associated with surgery, leading them to explore less invasive alternatives. This heightened awareness and willingness to invest in healthcare are particularly evident in developing countries, where improving healthcare infrastructure and economic growth are making bio-implants more accessible to a larger segment of the population.
Market Trends:
Increasing Preference for Minimally Invasive Procedures:
The global non-surgical bio-implants market is significantly influenced by the growing patient preference for minimally invasive procedures. This trend is largely driven by the numerous advantages these procedures offer over traditional surgical methods. Patients often favor minimally invasive options because they typically involve less pain, smaller incisions, and shorter recovery periods. This not only enhances the overall patient experience but also reduces the length of hospital stays and associated healthcare costs. For instance, aesthetic procedures are increasingly popular, with a total of nearly 35 million surgical and non-surgical procedures performed in 2023. According to the American Society of Plastic Surgeons, minimally invasive cosmetic procedures, such as Botox injections and dermal fillers, saw a 4% increase in popularity in the past year, accounting for a significant portion of the overall aesthetic market. This growing demand highlights a clear shift towards less invasive methods that align with patient desires for quicker recovery and minimal disruption to their lives.
Technological Advancements in Materials and Manufacturing:
Advancements in medical technology also play a crucial role in enhancing the appeal of minimally invasive procedures. The development of high-precision instruments and imaging technologies has significantly improved the accuracy and effectiveness of these procedures. This technological progress has made it possible to perform complex medical interventions with greater ease and success, further boosting patient confidence in non-surgical options. For instance, CollPlant Biotechnologies reported promising results from a pre-clinical study using 3D-printed, commercial-sized breast implants based on their bioinks, demonstrating significant implant vascularization and rapid ingrowth of native tissue. A study published in Biomaterials journal indicated that 3D-printed scaffolds for tissue engineering show a 50% higher cell viability compared to traditional methods, supporting the efficacy of advanced manufacturing techniques in bio-implants. This showcases how innovations in bioengineering are creating more effective and patient-friendly bio-implants.
Personalized Medicine and Customized Implants:
Personalized medicine in the global non-surgical bio-implants market represents a significant opportunity for growth and innovation. This approach tailor’s medical treatment to the individual characteristics of each patient, which is particularly beneficial for bio-implants. Personalized medicine involves the use of genetic, biomarker, and phenotypic data to create implants that are uniquely suited to an individual's body, thereby improving the effectiveness and compatibility of the implants. 3D printing technology allows for the creation of custom-designed implants that precisely match the anatomical and physiological needs of the patient. A report by the National Institutes of Health (NIH) highlighted that personalized implants could reduce the risk of implant failure by up to 30% due to enhanced biocompatibility and integration. This capability ensures better integration with their biological systems, leading to quicker recovery times and improved overall functionality. For instance, customized orthopedic implants offer remarkable precision and fit, decreasing problems and improving implant performance. According to the FDA, personalized medicine aims to elevate benefits and reduce risks to patients by targeting prevention and treatment more effectively.
Focus on Bio-Instructive and Smart Implants:
The non-surgical bio-implants market sees rising popularity in bio-instructive implants that blend biomaterials with bioactive compounds or cells. These "smart implants" can monitor physiological parameters, target medications, encourage tissue growth, and more, resulting in more individualized and successful therapies. For instance, the increasing focus on biocompatible materials leads to the development of more durable and safer implants for patients. Research from the journal Advanced Materials showed that smart implants with integrated sensors improved patient outcomes by providing real-time feedback on implant performance and tissue response, leading to earlier intervention if complications arose. These advancements significantly enhance the quality of non-surgical implants, making them more appealing to both healthcare providers and patients.
Market Challenges Analysis:
Stringent Regulatory Requirements:
The non-surgical bio-implants market faces significant restraints due to stringent regulatory requirements imposed by authorities such as the Food and Drug Administration (FDA) in the United States and the European Medicines Agency (EMA) in Europe. These regulations mandate rigorous testing and approval processes to ensure the safety and efficacy of bio-implants before they can be commercialized. Compliance with these standards requires substantial investments in research, development, and clinical trials, thereby increasing the time and cost associated with bringing new products to market. For instance, the approval process for a new bio-implant can take several years and cost millions of dollars, creating a barrier to entry for smaller companies and startups. This rigorous oversight, while essential for patient safety, can slow down the pace of innovation and limit the availability of advanced treatment options.
High Costs of Bio-Implant Procedures:
The high costs associated with non-surgical bio-implant procedures present a significant challenge to market accessibility and growth. These costs encompass the price of the implants themselves, as well as the expenses related to the implantation procedure, including physician fees, facility charges, and post-operative care. The financial burden can be particularly prohibitive for patients in developing countries or those without adequate health insurance coverage. For instance, a single viscosupplementation injection for osteoarthritis can cost several hundred dollars, and a full course of treatment may require multiple injections, placing a considerable strain on patients' finances. This cost sensitivity limits the adoption of non-surgical bio-implants, particularly for non-essential or elective procedures, impacting overall market expansion.
Limited Awareness and Adoption:
Limited awareness among both patients and healthcare providers regarding the benefits and availability of non-surgical bio-implants poses a notable challenge to market penetration. Many individuals are unfamiliar with the range of conditions that can be effectively treated with these implants, as well as their advantages over traditional surgical interventions. This lack of knowledge can lead to underutilization of non-surgical options and a preference for more invasive procedures. For instance, a survey indicated that only a small percentage of patients with joint pain were aware of viscosupplementation as a treatment option, highlighting the need for increased education and outreach efforts. Addressing this awareness gap through targeted marketing campaigns, educational programs for healthcare professionals, and patient advocacy initiatives is crucial for driving greater adoption of non-surgical bio-implants.
Market Opportunities:
The non-surgical bio-implants market presents significant growth opportunities driven by the increasing preference for minimally invasive procedures and advancements in biomaterials and regenerative medicine. The rising prevalence of chronic conditions, including musculoskeletal disorders, cardiovascular diseases, and dental issues, is fueling demand for biocompatible and bioresorbable implants. Additionally, the adoption of 3D printing technology is revolutionizing bio-implant manufacturing, allowing for patient-specific customization, improved durability, and reduced rejection rates. This technological evolution is expected to enhance treatment outcomes, making bio-implants a more viable and long-lasting alternative to traditional surgical implants. Furthermore, ongoing research in stem cell therapy and tissue engineering is expanding the potential applications of non-surgical bio-implants, driving further market expansion.
The Asia-Pacific region presents a lucrative opportunity due to rising healthcare investments, increasing medical tourism, and a growing geriatric population. Governments in countries such as China, India, and Japan are prioritizing healthcare modernization and research funding, fostering rapid advancements in biomedical technology. Additionally, the increasing awareness of non-surgical treatment options and the presence of cost-effective local manufacturers are making bio-implants more accessible to a wider patient base. Emerging markets in Latin America and the Middle East are also investing in advanced healthcare infrastructure, creating new avenues for market expansion. As medical technology continues to evolve, companies focusing on product innovation, regulatory compliance, and strategic collaborations will gain a competitive edge, unlocking substantial growth potential in the global non-surgical bio-implants market.
Market Segmentation Analysis:
By Type
The non-surgical bio-implants market is segmented based on type into orthopedic bio-implants, cardiovascular bio-implants, dental bio-implants, ophthalmic bio-implants, and others. Among these, orthopedic bio-implants hold the largest market share due to the rising prevalence of musculoskeletal disorders, osteoarthritis, and sports injuries. The increasing adoption of biodegradable and bioresorbable implants in orthopedics is enhancing patient recovery, reducing the need for revision procedures, and driving demand for minimally invasive treatments.
Cardiovascular bio-implants are witnessing significant growth, driven by the high incidence of cardiovascular diseases (CVDs) worldwide. According to the World Health Organization (WHO), CVDs account for nearly 32% of global deaths, increasing the demand for biocompatible implants such as heart valves, vascular grafts, and stents. The development of next-generation polymer-based and tissue-engineered bio-implants is further fueling market expansion in this segment.
Dental bio-implants are gaining traction due to the rising geriatric population and increasing prevalence of tooth loss. The demand for zirconia and titanium-based non-surgical implants is increasing as more patients seek aesthetic and functional restoration without invasive procedures.
Ophthalmic bio-implants are also experiencing rapid growth, with advancements in corneal implants, intraocular lenses, and retinal prosthetics enhancing vision restoration options. The growing global burden of visual impairments and cataract cases is driving demand in this segment.
Segmentations:
By Type:
- Non-surgical Bio-implants
- Viscoaugmentation Bio-implants
- Viscosupplementation Bio-implants
- Injectable Biomaterials
- Collagen
- Hyaluronan
- Biopolymers
- Hydrogels
- Hydroxyapatite
- Alloplastic Biomaterials
- Acrylic Hydrogel
By Region:
- North America
- U.S.
- Canada
- Mexico
- Europe
- UK
- France
- Germany
- Italy
- Spain
- Russia
- Belgium
- Netherlands
- Austria
- Sweden
- Poland
- Denmark
- Switzerland
- Rest of Europe
- Asia Pacific
- China
- Japan
- South Korea
- India
- Australia
- Thailand
- Indonesia
- Vietnam
- Malaysia
- Philippines
- Taiwan
- Rest of Asia Pacific
- Latin America
- Brazil
- Argentina
- Peru
- Chile
- Colombia
- Rest of Latin America
- Middle East
- UAE
- KSA
- Israel
- Turkey
- Iran
- Rest of Middle East
- Africa
- Egypt
- Nigeria
- Algeria
- Morocco
- Rest of Africa
Regional Analysis:
North America:
North America dominates the non-surgical bio-implants market, accounting for 40% of the global market share. The region’s leadership is driven by high healthcare expenditure, strong research infrastructure, and early adoption of advanced biomaterials. For instance, the Centers for Disease Control and Prevention (CDC) reports that over 54 million adults in the U.S. suffer from arthritis, increasing the demand for orthopedic bio-implants. Additionally, the high prevalence of cardiovascular diseases (CVDs), which affect nearly 48% of the U.S. adult population, is fueling demand for biocompatible cardiovascular implants such as heart valves and vascular grafts. The presence of major medical device manufacturers, including Abbott, Medtronic, and Zimmer Biomet, further strengthens the market. Favorable reimbursement policies and stringent FDA approvals ensuring product safety are also driving market expansion in the United States and Canada.
Europe:
Europe holds 30% of the global non-surgical bio-implants market, with key contributions from Germany, France, the United Kingdom, and Italy. The region benefits from rising healthcare funding, an aging population, and increasing awareness of non-surgical treatment options. For instance, the European Society of Cardiology (ESC) states that over 85 million people in Europe suffer from cardiovascular diseases, driving the demand for advanced bio-implants in cardiology. Government initiatives, such as the European Union’s Horizon 2020 research program, have allocated over USD 80 billion in healthcare R&D, fostering advancements in bioengineered implants. Additionally, Germany leads the European market due to its well-established medical device industry and strong regulatory framework, while France and the U.K. are making significant investments in biomaterials and regenerative medicine. The growing demand for dental bio-implants in Europe is also fueled by an aging population and rising preference for aesthetic dental restoration procedures.
Asia-Pacific:
The Asia-Pacific region is projected to witness the fastest growth, holding 20% of the global market share, with China, India, and Japan emerging as key contributors. For instance, China’s healthcare expenditure surpassed USD 1.2 trillion in 2023, with government-led initiatives focusing on medical device innovation and local manufacturing. The rising geriatric population in Japan, where over 28% of citizens are aged 65 and older, is significantly driving demand for orthopedic and cardiovascular bio-implants. Additionally, India is experiencing a surge in medical tourism, with an increasing number of international patients seeking cost-effective and high-quality bio-implant treatments. The presence of local bio-implant manufacturers offering affordable solutions and growing investments in regenerative medicine are further strengthening the regional market. The adoption of 3D-printed bio-implants in research hospitals across China and South Korea is also contributing to rapid market growth.
Latin America and the Middle East & Africa
The Rest of the World (RoW) segment, including Latin America, the Middle East, and Africa, holds 10% of the global market share. Although the adoption of non-surgical bio-implants remains lower in these regions, increasing government investments in healthcare infrastructure and medical technology are creating new opportunities. For instance, Brazil’s healthcare sector receives over USD 50 billion annually, with a focus on advancing medical device manufacturing. Similarly, the United Arab Emirates (UAE) and Saudi Arabia are investing heavily in state-of-the-art healthcare facilities, promoting the adoption of innovative bio-implants. Additionally, the rising prevalence of diabetes in Latin America, affecting over 32 million people, is increasing demand for dental and ophthalmic bio-implants. Over the next decade, improving healthcare accessibility, regulatory support, and collaborations with international medical device manufacturers are expected to accelerate bio-implant adoption across emerging markets.
Key Player Analysis:
- Albiorex International
- FibroGen, Inc
- Kythera Pharmaceuticals, Inc
- Moma Therapeutics, Inc
- Novatex Bioengineering SA
- Anika Therapeutics, Inc.
- Johnson & Johnson
- Fidia Farmaceutici
- LCA Pharmaceuticals
- Hangzhou Gallop Biological Products Co., Ltd.
Competitive Analysis:
The non-surgical bio-implants market is highly competitive, with key players focusing on technological advancements, strategic partnerships, and research-driven innovations to strengthen their market presence. Leading companies, including Abbott Laboratories, Medtronic, Zimmer Biomet, Stryker Corporation, and Johnson & Johnson, collectively hold over 60% of the global market share. For instance, Abbott has expanded its portfolio with biocompatible cardiovascular implants, addressing the rising global burden of heart disease, which affects nearly 523 million people worldwide. Medtronic is actively investing in tissue-engineered and biodegradable implants, enhancing patient safety and treatment outcomes. Companies are also adopting 3D printing and AI-driven biomaterial research to improve customization, durability, and integration of bio-implants with human tissues. Additionally, emerging players in Asia-Pacific and Latin America are gaining traction by offering cost-effective bio-implant solutions, increasing competition and fostering market expansion in developing economies. The market is expected to see continued innovation and consolidation as companies strive to enhance implant performance and global accessibility.
Recent Developments:
- In January 2025, MOMA Therapeutics in-licensed MOMA-989, a next-generation selective PARP1 inhibitor, with plans for single agent and combination development. MOMA will assume responsibility for all further research, development, and commercialization of the asset and related follow-on molecules.
- In November 2024, FibroGen reported total revenue for the third quarter of 2024 was $46.3 million, compared to $40.1 million for the third quarter of 2023, a 15% year-over-year increase. In the second quarter of 2024, FibroGen's total revenue was $50.6 million, compared to $44.3 million for the second quarter of 2023, a 14% year-over-year increase.
- Fidia Farmaceutici is developing a treatment based on hyaluronic acid and collagenase from Vibrio alginolyticus for Dupuytren's contracture, proposed as a safe, non-surgical option. Fidia is also involved in regenerative medicine, offering technologies for autologous biological therapies. Fidia's global presence in 2023 provided a turnover of over 463.5 million Euros, almost 50% of which was generated in foreign markets.
Market Concentration & Characteristics:
The non-surgical bio-implants market exhibits a moderate to high market concentration, with a few dominant players holding a significant share due to their strong R&D investments, advanced biomaterial technologies, and extensive global distribution networks. Industry leaders such as Abbott Laboratories, Medtronic, and Zimmer Biomet account for over 60% of the total market share, leveraging patented technologies and regulatory approvals to maintain their competitive edge. The market is characterized by continuous innovation in biomaterials, increasing adoption of 3D printing, and growing demand for patient-specific bio-implants. Additionally, regulatory frameworks, high development costs, and stringent approval processes create barriers for new entrants, limiting competition to well-established firms and a few emerging players in Asia-Pacific and Latin America. The trend toward biodegradable and bioresorbable implants, coupled with AI-driven material research, is shaping the future of the industry, driving technological advancements and market expansion.
Report Coverage:
The research report offers an in-depth analysis based on Type and Region. It details leading market players, providing an overview of their business, product offerings, investments, revenue streams, and key applications. Additionally, the report includes insights into the competitive environment, SWOT analysis, current market trends, as well as the primary drivers and constraints. Furthermore, it discusses various factors that have driven market expansion in recent years. The report also explores market dynamics, regulatory scenarios, and technological advancements that are shaping the industry. It assesses the impact of external factors and global economic changes on market growth. Lastly, it provides strategic recommendations for new entrants and established companies to navigate the complexities of the market.
Future Outlook:
- The demand for non-surgical bio-implants will continue to rise due to the growing aging population and increasing prevalence of chronic diseases such as cardiovascular disorders, musculoskeletal conditions, and dental issues.
- Advancements in biomaterials, including biodegradable and bioresorbable implants, will enhance biocompatibility, durability, and patient outcomes, reducing the need for revision procedures.
- The integration of 3D printing and AI-driven biomaterial research will enable patient-specific implants, improving precision, customization, and overall treatment success rates.
- Government investments in biomedical research and regenerative medicine will drive innovation, expanding applications for tissue-engineered bio-implants in orthopedics, cardiology, and ophthalmology.
- Emerging markets in Asia-Pacific, Latin America, and the Middle East will present lucrative opportunities due to rising healthcare expenditures, medical tourism, and expanding access to advanced medical treatments.
- Mergers, acquisitions, and strategic collaborations among key players will shape market competition, fostering technological advancements and expanding global distribution networks.
- The demand for aesthetic and functional restoration solutions will accelerate growth in dental and ophthalmic bio-implants, particularly in cosmetic dentistry and vision correction.
- Regulatory bodies will play a crucial role in shaping market growth by streamlining approval processes, ensuring product safety, and supporting innovative implant technologies.
- The adoption of wearable bio-implants and smart implant technology will introduce real-time health monitoring capabilities, enhancing patient care and post-implant recovery.
- Cost-effective bio-implants from emerging manufacturers will increase market accessibility, promoting wider adoption of non-surgical implant solutions across developing regions.
Request a Free Sample
Fill in your details and we'll send you a free sample report.
- Sample data tables & charts
- Research methodology
Need a Custom Version of This Report?
Tailor the scope, geography, or segments to your exact requirements.
- Custom geography or segment scope
- Direct access to our analyst team
Frequently Asked Questions
What is the current size of the Non-Surgical Bio-Implants Market?
What factors are driving the growth of the Non-Surgical Bio-Implants Market?
Who are the major players in the Non-Surgical Bio-Implants Market?
Which segment is leading the market share?
Table of Content
Chapter 1. Report Introduction
- 1.1 Report Description & Purpose
- 1.1.1 Report Title & Market Definition
- 1.1.2 Unique Selling Propositions (USP) & Key Differentiators
- 1.1.3 Value Proposition for Stakeholders
- 1.2 Research Objectives
- 1.2.1 Market Sizing Objectives (Volume & Revenue)
- 1.2.2 Segmentation Objectives
- 1.2.3 Competitive Intelligence Objectives
- 1.2.4 Forecast & Scenario Objectives
- 1.3 Report Scope
- 1.3.1 Non-Surgical Bio-Implants Scope – Types & Subtypes Covered
- 1.3.2 Geographic Scope – Regions & Countries Covered
- 1.3.3 Historical Period, Base Year & Forecast Period (2024; forecast to 2032)
- 1.3.4 Inclusions & Exclusions
- 1.4 HS Code & Classification Framework
- 1.5 Currency, Units & Pricing Basis
- 1.6 Target Stakeholders
- 1.7 Limitations & Assumptions
Chapter 2. Executive Summary
- 2.1 Global Non-Surgical Bio-Implants Market Snapshot
- 2.1.1 Market Size – Historical (2024) & Forecast (2024-2032) (2024: USD 149.8 million → 2032: USD 259.31 million)
- 2.1.2 Volume & Revenue – Global Totals
- 2.1.3 Key Market Highlights – Top Five Facts
- 2.2 Non-Surgical Bio-Implants Market Segmentation Snapshot
- 2.2.1 Market Split by Region – 2024 vs. 2032
- 2.3 Competitive Snapshot
- 2.3.1 Top 10 Players by Revenue Share – 2024
- 2.3.2 Top 10 Players by Volume Share – 2024
- 2.3.3 Recent Strategic Developments (18-Month Summary)
- 2.4 Key Investment Highlights & Strategic Conclusions
Chapter 3. Non-Surgical Bio-Implants Market Dynamics & Industry Analysis
- 3.1 Market Overview & Context
- 3.1.1 Non-Surgical Bio-Implants Market Position in the Broader Automotive Value Chain
- 3.1.2 OEM vs. Replacement Market Dynamics
- 3.1.3 Market Maturity & Development Stage by Region
- 3.2 Non-Surgical Bio-Implants Market Drivers
- 3.3 Non-Surgical Bio-Implants Market Restraints & Challenges
- 3.4 Non-Surgical Bio-Implants Market Opportunities
- 3.5 Porter's Five Forces Analysis
- 3.5.1 Threat of New Entrants
- 3.5.2 Bargaining Power of Suppliers
- 3.5.3 Bargaining Power of Buyers
- 3.5.4 Threat of Substitutes
- 3.5.5 Competitive Rivalry – Intensity Assessment
- 3.6 Non-Surgical Bio-Implants Value Chain Analysis
- 3.6.1 Upstream – Raw Material/Input Suppliers
- 3.6.1.1 Raw Material/Input 1
- 3.6.1.2 Raw Material/Input 2
- 3.6.1.3 Raw Material/Input 3
- 3.6.2 Midstream – Production/Manufacturing/Service Delivery
- 3.6.2.1 Production/Process Overview
- 3.6.2.2 Key Facility Locations & Capacity by Manufacturer
- 3.6.3 Downstream – Distribution & End Consumer
- 3.6.3.1 Primary Channel – B2B/OEM
- 3.6.3.2 Secondary Channels – Dealer, Retail, Online, Direct
- 3.6.4 Value Chain Profitability Analysis
- 3.6.1 Upstream – Raw Material/Input Suppliers
- 3.7 PESTEL Analysis
- 3.7.1 Political Factors
- 3.7.2 Economic Factors
- 3.7.3 Social Factors
- 3.7.4 Technological Factors
- 3.7.5 Environmental Factors
- 3.7.6 Legal Factors
- 3.8 Non-Surgical Bio-Implants Supply Chain Analysis
- 3.8.1 Raw Material/Input Supply Risk Assessment
- 3.8.2 Manufacturing Concentration Risk (Geographic Exposure)
- 3.8.3 Trade Disruption Impact Analysis
- 3.9 Regulatory & Policy Landscape
Note: The regulatory and policy landscape section covers regulations based on their applicability to the market, Non-Surgical Bio-Implants category, geography, and scope of the study. Only regulatory frameworks with a material impact on operations, compliance, trade, sustainability, or market access are analyzed in detail.
Chapter 4. Key Investment Pockets & Opportunity Analysis
- 4.1 Non-Surgical Bio-Implants Market Attractiveness Analysis
- 4.1.1 By Region – Investment Attractiveness Matrix (Volume × CAGR)
- 4.2 Absolute Revenue Growth Opportunity
- 4.2.1 By Region – Absolute USD Growth Through 2032
- 4.3 Incremental Volume Opportunity
- 4.3.1 By Region – Incremental Volume Through 2032
- 4.3.2 Segment – Incremental Volume
- 4.4 Emerging Submarket Opportunity Deep Dive (Subject to Applicability)
- 4.5 Emerging Market Opportunity Scorecards
- 4.5.1 United States
- 4.5.2 Europe
- 4.5.3 Asia
- 4.5.4 Middle East & Africa
Note: Emerging Market Opportunity Scorecards will be included based on relevance and strategic importance. Regions listed are indicative and may vary depending on data availability and market dynamics.
Chapter 5. Non-Surgical Bio-Implants Import-Export Analysis & Trade Flows
- 5.1 Global Trade Overview
- 5.1.1 Global Export Value by Country (2024)
- 5.1.2 Global Export Volume by Country (2024)
- 5.1.3 Global Import Value by Country (2024)
- 5.1.4 Global Import Volume by Country (2024)
- 5.1.5 Net Trade Balance by Country (2024)
- 5.2 Export Analysis – Segment
- 5.2.1 Type 1 (HS Code)
- 5.2.2 Type 2 (HS Code)
- 5.2.3 Type 3 (HS Code)
- 5.2.4 Type 4 (HS Code)
- 5.2.5 Type 5 (HS Code)
- 5.3 Import Analysis – Segment
- 5.3.1 Type 1 (HS Code)
- 5.3.2 Type 2 (HS Code)
- 5.3.3 Type 3 (HS Code)
- 5.3.4 Type 4 (HS Code)
- 5.3.5 Type 5 (HS Code)
- 5.4 Average Unit Trade Prices
- 5.4.1 Average Export Price – Segment & Country
- 5.4.2 Average Import Price – Segment & Source Country
- 5.4.3 Price Trends (2024)
- 5.5 Key Trade Route Analysis
- 5.5.1 Trade Route 1
- 5.5.2 Trade Route 2
- 5.5.3 Trade Route 3
- 5.5.4 Trade Route 4
- 5.5.5 Trade Route 5
- 5.6 Trade Policy Impact Assessment
- 5.6.1 US Anti-Dumping & Section 301 Tariffs
- 5.6.2 EU Customs Union Impact
- 5.6.3 Major Free Trade Agreements
- 5.6.4 USMCA Rules of Origin
Note: Trade policy analysis will be included only where relevant to the Non-Surgical Bio-Implants market.
Chapter 6. Competitive Landscape & Company Benchmarking
- 6.1 Non-Surgical Bio-Implants Market Concentration & Structure
- 6.1.1 Herfindahl-Hirschman Index (HHI) – vs. 2024
- 6.1.2 Tier 1, Tier 2 & Tier 3 Market Structure
- 6.1.3 Global, Regional & Local Player Dynamics
- 6.2 Non-Surgical Bio-Implants Market Share Analysis – 2024
- 6.2.1 Global Revenue Share by Company
- 6.2.2 Global Volume Share by Company
- 6.2.3 Regional Revenue Share
- 6.2.4 Market Share Evolution ( vs. 2024)
- 6.2.5 OEM Segment Share by Company
- 6.2.6 Replacement Segment Share by Company
- 6.3 Production/Delivery Capacity & Facility Analysis
- 6.3.1 Global Installed Capacity
- 6.3.2 Capacity Utilization Rates
- 6.3.3 Production/Output Volume
- 6.3.4 Facility Locations & Capacity Map
- 6.3.5 Planned Capacity Additions
- 6.4 Non-Surgical Bio-Implants Competitive Benchmarking Matrix
- 6.4.1 Revenue, Volume, CAGR & Profitability Comparison
- 6.4.2 Channel Revenue Mix
- 6.4.3 Geographic Revenue Exposure
- 6.4.4 R&D Intensity
- 6.4.5 Sustainability Maturity
- 6.5 Strategic Developments in Non-Surgical Bio-Implants (Last 24 Months)
- 6.5.1 Mergers, Acquisitions & Divestments
- 6.5.2 New Non-Surgical Bio-Implants Launches
- 6.5.3 Facility Expansions
- 6.5.4 Strategic Alliances, Joint Ventures & Partnerships
- 6.5.5 Distribution Expansion & Market Entry
- 6.5.6 Sustainability & ESG Initiatives
- 6.6 Competitive Strategy Mapping
- 6.6.1 Leader, Challenger, Follower & Niche Classification
- 6.6.2 Pricing Strategy Comparison
- 6.6.3 Channel Strategy Matrix
Note: Strategic developments are included based on their materiality and the availability of reliable information.
Chapter 7. Global Non-Surgical Bio-Implants Market – By Distribution Channel
- 7.1 Segment Overview
- 7.1.1 Volume & Revenue Split by Channel (2024 & 2032)
- 7.1.2 Channel Mix Evolution (2024-2032)
Chapter 8. Regional Market Analysis – Global Overview
- 8.1 Global Regional Overview
- 8.1.1 Regional Volume Share
- 8.1.2 Regional Revenue Share
- 8.1.3 Regional Volume by Region
- 8.1.4 Regional Revenue by Region
- 8.1.5 Regional Forecast Through 2032
- 8.2 Cross-Regional Segment Analysis
- 8.2.1 By Distribution Channel
- 8.2.2 By Brand/Price Tier
Chapter 9. North America Non-Surgical Bio-Implants Market
- 9.1 United States
- 9.2 Canada
- 9.3 Mexico
Chapter 10. Europe Non-Surgical Bio-Implants Market
- 10.1 Germany
- 10.2 France
- 10.3 Italy
- 10.4 United Kingdom
- 10.5 Spain
- 10.6 Poland
- 10.7 Russia
- 10.8 Netherlands
- 10.9 Belgium
- 10.10 Sweden
- 10.11 Denmark
- 10.12 Norway
- 10.13 Rest of Europe
Chapter 11. Asia Pacific Non-Surgical Bio-Implants Market
- 11.1 China
- 11.2 India
- 11.3 Japan
- 11.4 South Korea
- 11.5 Thailand
- 11.6 Indonesia
- 11.7 Vietnam
- 11.8 Malaysia
- 11.9 Australia
- 11.10 Rest of Asia Pacific
Chapter 12. Latin America Non-Surgical Bio-Implants Market
- 12.1 Brazil
- 12.2 Argentina
- 12.3 Colombia
- 12.4 Chile
- 12.5 Rest of Latin America
Chapter 13. Middle East Non-Surgical Bio-Implants Market
- 13.1 Saudi Arabia
- 13.2 United Arab Emirates
- 13.3 Turkey
- 13.4 Israel
- 13.5 Iran
- 13.6 Rest of the Middle East
Chapter 14. Africa Non-Surgical Bio-Implants Market
- 14.1 South Africa
- 14.2 Egypt
- 14.3 Nigeria
- 14.4 Morocco
- 14.5 Rest of Africa
Chapter 15. Non-Surgical Bio-Implants Company Profiles
- 15.1 [Company 01]
- 15.1.1 Company Overview
- 15.1.2 Key Management Personnel
- 15.1.3 Products & Services Portfolio
- 15.1.4 Financial Performance
- 15.1.5 Key Market Focus & Geographic Presence
- 15.1.6 Recent Developments & Strategic Initiatives
Note: The company profile list is preliminary and may change based on research findings, market developments, data availability, and client requirements.
Chapter 16. Appendices
- Appendix A – List of Abbreviations & Acronyms
- Appendix B – Industry Classification Code Reference – Full Series
- Appendix C – Production & Capacity Data Tables
- Appendix D – End-Use & Demand Base Tables
- Appendix E – Consumption & Replacement Rate Assumptions
- Appendix F – ASP Reference Tables
- Appendix G – Manufacturing & Facility Database
- Appendix H – Import-Export Data Tables
- Appendix I – Regulatory Summary Tables
- Appendix J – Primary Research Participant List (Anonymized)
- Appendix K – Primary Research Questionnaire Framework
- Appendix L – Data Sources & Bibliography
- Appendix M – Market Size Divergence & Source Comparison
Chapter 17. Research Methodology
- 17.1 Research Framework & Philosophy
- 17.2 Secondary Research – Sources, Hierarchy & Data Extraction
- 17.3 Data Modeling – Bottom-Up & Top-Down Market Sizing
- 17.4 Primary Research – Stakeholder Framework, LOI & Sample Sizes
- 17.5 Forecast Methodology – Regression, Scenario & Sensitivity Analysis
- 17.6 Quality Control – Four-Layer Validation Framework
- 17.7 Limitations & Standard Assumptions
- 17.8 Disclaimer
