
| REPORT ATTRIBUTE | DETAILS |
|---|---|
| Historical Period | 2020-2023 |
| Base Year | 2024 |
| Forecast Period | 2025-2032 |
| North America Experiential Market Size 2024 | USD 17,224 million |
| North America Experiential Market, CAGR | 5.6% |
| North America Experiential Market Size 2032 | USD 26634.5 million |
Market Overview:
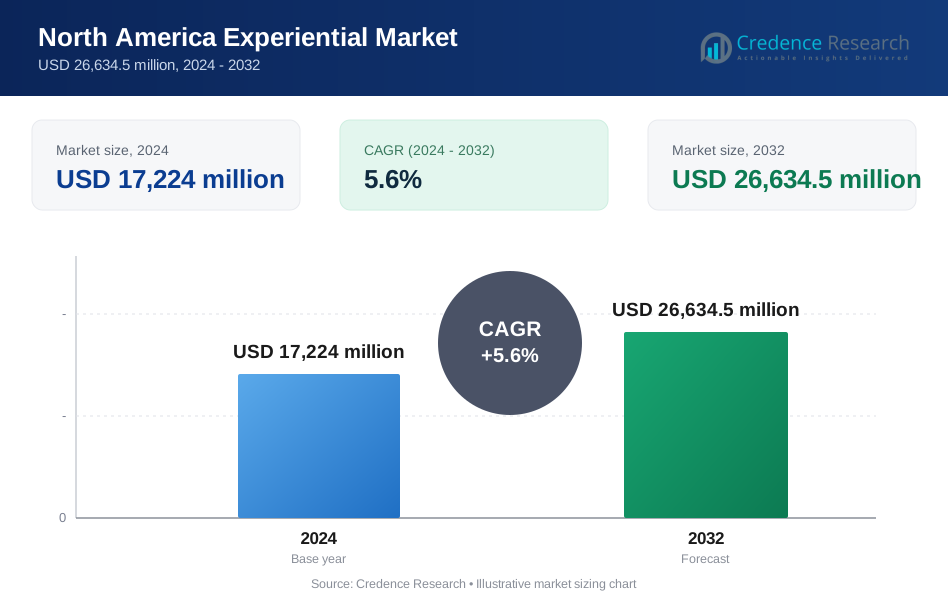
The North America Experiential Market is projected to grow from USD 17,224 million in 2024 to an estimated USD 26634.5 million by 2032, with a compound annual growth rate (CAGR) of 5.6% from 2024 to 2032.
Several factors drive this market’s growth. Advances in technologies such as augmented reality (AR), virtual reality (VR), and mixed reality (MR) empower brands to deliver captivating and immersive experiences. Moreover, younger consumer segments, including Millennials and Gen Z, prioritize authenticity and personalized engagement, which experiential marketing effectively delivers. The impact of social media further amplifies experiential campaigns by encouraging user-generated content that broadens brand reach organically. As digital advertising becomes costlier and more cluttered, brands leverage live events and immersive activations to cut through the noise and create meaningful touchpoints with their audiences. Additionally, the rise of hybrid event formats blending physical and virtual experiences expands the reach and inclusivity of experiential campaigns, accommodating shifting consumer behaviors influenced by the COVID-19 pandemic.
Regionally, North America commands a leading position in the global experiential marketing landscape, driven primarily by the United States. The U.S. market benefits from a sophisticated consumer base and a strong presence of brands investing heavily in innovative experiential strategies. Canada and Mexico are also witnessing growing adoption of experiential marketing tailored to their diverse cultural dynamics. This regional leadership reflects both the technological infrastructure and consumer openness to engaging brand experiences. Furthermore, the availability of advanced analytics tools enables marketers in the region to measure campaign effectiveness with greater precision, optimizing future investments. Consequently, North America is poised to maintain its dominance in the experiential marketing sector, supported by continuous investments, evolving marketing innovations, and an increasing emphasis on sustainable and socially responsible brand activations.
Market Insights:
- The North America Experiential Market is projected to grow from USD 17,224 million in 2024 to USD 26,634.5 million by 2032, with a CAGR of 5.6% during this period, reflecting steady and sustained expansion.
- Rapid technological advancements in augmented reality (AR), virtual reality (VR), and mixed reality (MR) enable brands to deliver immersive, interactive experiences that significantly enhance consumer engagement and brand recall.
- Younger consumer groups, including Millennials and Generation Z, drive demand for authentic, personalized brand interactions, making experiential marketing a preferred strategy to foster emotional connections and loyalty.
- Social media integration amplifies experiential campaigns by facilitating user-generated content and real-time engagement, thereby extending brand reach organically and improving campaign effectiveness.
- The rise of hybrid event formats combining physical and virtual elements expands experiential marketing’s inclusivity and accessibility, aligning with evolving consumer behaviors influenced by the COVID-19 pandemic.
- North America leads the global experiential marketing landscape, primarily due to the United States’ strong consumer base and significant brand investments, with Canada and Mexico also increasing adoption tailored to local cultural dynamics.
- High implementation costs and resource intensity pose challenges, restricting market access for smaller brands, while difficulties in accurately measuring ROI complicate strategic decision-making and optimization of experiential campaigns.
Market Drivers:
Technological Innovations Accelerating Immersive Brand Experiences:
The North America Experiential Market benefits significantly from rapid technological advancements that enhance the quality and scope of immersive marketing campaigns. Technologies such as augmented reality (AR), virtual reality (VR), and mixed reality (MR) enable brands to create highly interactive and engaging experiences that captivate consumers beyond traditional advertising. These technologies offer opportunities to deliver personalized content that resonates with individual preferences, increasing consumer engagement and brand recall. The growing accessibility of mobile devices and wearable technology further expands the reach of experiential marketing, allowing seamless integration between physical and digital touchpoints. It supports brands in delivering innovative activations that create memorable consumer interactions. Investments in technology infrastructure and creative development drive the continuous evolution of experiential formats, reinforcing the market’s growth trajectory.
- For instance, Across North America, the AR and VR in marketing market reached $4.5 billion in 2023, with hardware capturing 65.5% of the market and AR technologies leading with a 63% share, reflecting widespread adoption by brands for interactive product visualization and consumer engagement.
Consumer Preference Shift Toward Authentic and Personalized Engagement:
The market experiences strong momentum due to evolving consumer behavior that favors authentic and personalized brand interactions. In the North America Experiential Market, Millennials and Generation Z constitute a substantial consumer segment that demands meaningful engagement rather than passive exposure to advertising. These consumers value transparency, relevance, and experiences that align with their lifestyle and values. Experiential marketing satisfies these preferences by enabling brands to establish emotional connections and foster trust. This approach encourages brand loyalty and advocacy, essential factors in competitive markets. It also helps companies differentiate themselves by offering unique experiences that reflect consumers’ expectations. This consumer-driven demand motivates brands to innovate and allocate greater budgets to experiential initiatives.
- For example, Coca-Cola’s "Share a Coke" campaign continues to generate millions of user-generated content impressions annually by personalizing bottles with popular names and encouraging social sharing with #ShareACoke.
Social Media Integration Amplifying Reach and Engagement:
Social media platforms play a pivotal role in amplifying the impact of experiential marketing campaigns in North America. The market leverages user-generated content, live streaming, and social sharing to extend the visibility and influence of brand experiences beyond event attendees. This amplification effect increases brand awareness and attracts new audiences, driving organic growth. The integration of social media allows marketers to gather real-time feedback and engage with consumers dynamically, enabling continuous refinement of campaigns. It also facilitates influencer partnerships, which further enhance credibility and expand reach. Social media’s symbiotic relationship with experiential marketing creates a powerful toolset for brands aiming to maximize return on investment. This synergy contributes directly to the sustained growth of the market.
Corporate Investment and Diversification Across Key Industry Verticals:
Corporate investment across diverse sectors significantly propels the North America Experiential Market forward. Industries including retail, automotive, technology, entertainment, and consumer packaged goods increasingly recognize the strategic value of experiential marketing in building brand equity and driving sales. Companies allocate substantial portions of their marketing budgets to experiential campaigns due to their measurable impact on consumer behavior and brand perception. The market also witnesses diversification in event formats, ranging from product launches and pop-up activations to large-scale festivals and immersive brand environments. These varied applications allow businesses to target specific demographics and markets effectively. Investments in analytics and data-driven strategies improve campaign precision, enabling brands to optimize outcomes. This growing financial commitment underscores the market’s expanding importance within corporate marketing strategies.
Market Trends:
Rise of Hybrid Experiential Campaigns Blending Physical and Digital Elements:
The North America Experiential Market increasingly embraces hybrid campaigns that combine in-person events with digital technologies to reach broader audiences. It incorporates virtual reality, live streaming, and interactive online platforms alongside traditional physical activations. This approach expands accessibility, allowing participation beyond geographic constraints and enhancing engagement opportunities. Hybrid formats provide brands with flexibility to adapt quickly to changing consumer behaviors and external factors such as public health considerations. It also enables the collection of comprehensive data across multiple touchpoints, supporting refined targeting and personalization. Brands deploy hybrid campaigns to maximize impact, balancing immersive in-person experiences with scalable digital interaction. The trend toward hybrid models reflects the market’s innovation and responsiveness to evolving consumer expectations.
- For instance, The campaign’s analytics platform tracked participation across 17 states and provided granular insights for future personalization, demonstrating the effectiveness of hybrid models in expanding reach and engagement.
Focus on Sustainability and Social Responsibility in Brand Experiences:
Sustainability and corporate social responsibility have emerged as defining trends within the North America Experiential Market. Consumers increasingly expect brands to demonstrate environmental stewardship and ethical practices through their marketing initiatives. It integrates sustainable materials, waste reduction measures, and socially conscious themes into experiential events. Brands leverage experiential marketing to highlight their commitment to social causes, which resonates strongly with socially aware audiences. This trend influences event design, vendor selection, and messaging strategies, aligning campaigns with broader corporate responsibility goals. Sustainable experiential marketing fosters positive brand perception and deeper emotional connections. The market’s adoption of sustainability principles positions it to meet growing consumer demand for responsible business practices.
- For instance, At the Greener Manufacturing Show North America, more than 250 companies showcased sustainable marketing solutions, reinforcing the market’s commitment to eco-friendly practices and measurable environmental impact.
Integration of Data Analytics and Artificial Intelligence to Enhance Campaign Effectiveness:
The deployment of data analytics and artificial intelligence (AI) tools marks a critical trend shaping the North America Experiential Market’s growth. It harnesses real-time data collection and AI-driven insights to optimize experiential campaign design, targeting, and measurement. Brands use analytics to understand consumer behavior patterns, preferences, and engagement levels, enabling more precise personalization and improved ROI. AI applications include predictive modeling, sentiment analysis, and automated content generation that enhance customer interactions. The integration of these technologies empowers marketers to make data-informed decisions and continuously refine experiences for greater impact. This data-centric approach strengthens the strategic value of experiential marketing within broader marketing ecosystems.
Expansion of Experiential Marketing Across Diverse Industry Verticals:
The North America Experiential Market demonstrates broadening application across various industries beyond traditional retail and entertainment sectors. It finds increasing adoption in technology, healthcare, automotive, financial services, and consumer packaged goods industries. These sectors utilize experiential marketing to educate customers, showcase innovations, and differentiate their brands in competitive markets. Event formats diversify accordingly, ranging from interactive product demonstrations and wellness experiences to immersive brand storytelling. Industry-specific regulations and consumer expectations shape the design and execution of campaigns. This expansion signals the market’s maturity and adaptability, driven by growing recognition of experiential marketing’s effectiveness across diverse business contexts. It fosters new opportunities for creative engagement and market penetration.
Market Challenges Analysis:
High Implementation Costs and Resource Intensity Restricting Market Accessibility:
The North America Experiential Market faces significant challenges related to the high costs and resource demands associated with planning and executing experiential campaigns. It requires substantial investments in technology, creative development, venue management, and staffing, which can limit participation by smaller brands or businesses with constrained budgets. Complex logistics and coordination add further operational burdens, increasing the risk of delays or execution errors. The need for specialized expertise to design and implement immersive experiences also raises barriers to entry. These factors create a high threshold for successful campaign delivery, potentially restricting market growth to well-resourced companies. Managing cost efficiency while maintaining creative impact remains a persistent challenge for market participants.
Measurement Difficulties and ROI Attribution Complicating Strategic Decision-Making:
Quantifying the effectiveness of experiential marketing campaigns presents another key challenge in the North America Experiential Market. It struggles with accurately measuring return on investment (ROI) due to the multifaceted nature of consumer engagement and the difficulty in linking experiences directly to sales or brand loyalty metrics. Traditional analytics often fail to capture the full scope of emotional and behavioral impacts generated by immersive interactions. This complexity complicates justification for budget allocations and strategic planning. Although advances in data analytics and AI provide tools to improve measurement precision, integrating these technologies effectively requires expertise and investment. Without reliable metrics, companies face challenges optimizing campaign performance and demonstrating value to stakeholders.
Market Opportunities:
Expansion of Digital and Hybrid Experiential Platforms Unlocking New Consumer Engagement Channels:
The North America Experiential Market holds significant opportunities through the expansion of digital and hybrid experiential platforms. It can leverage advancements in virtual and augmented reality to create immersive experiences that transcend physical boundaries, reaching wider and more diverse audiences. Hybrid events combining in-person and online components enable brands to maximize engagement while maintaining flexibility and scalability. These platforms also offer valuable data collection opportunities, allowing marketers to tailor experiences more precisely and enhance personalization. The growing consumer comfort with digital interaction further supports adoption. Capitalizing on these technologies allows market players to innovate and differentiate their offerings effectively.
Growing Demand for Sustainable and Purpose-Driven Brand Experiences Creating Differentiation Potential:
Sustainability and social responsibility trends present substantial opportunities for the North America Experiential Market to create meaningful and differentiated brand experiences. It can incorporate eco-friendly materials, carbon-neutral event planning, and cause-driven activations to align with consumer values. Engaging audiences through purpose-driven storytelling fosters stronger emotional connections and brand loyalty. Brands that integrate sustainability into experiential campaigns can enhance reputation and appeal to socially conscious demographics. This growing consumer preference for ethical business practices opens avenues for innovative marketing strategies that combine impact with engagement. The market can leverage this shift to expand its influence and relevance.
Market Segmentation Analysis:
By Component
The North America Experiential Market divides into solutions and services. Solutions provide the technological infrastructure that supports experiential campaigns, including software platforms and digital tools. Services focus on strategy development, campaign execution, and ongoing support to maximize consumer engagement and brand impact. This combination enables end-to-end experiential marketing delivery tailored to client needs.
- For instance, Omnicom Group’s 2023 launch of its AI-driven experiential platform exemplifies the solutions segment’s technical sophistication, offering real-time campaign personalization by analyzing behavioral data from over 1 million event participants.
By Deployment
Deployment options include on-premise and cloud-based models, offering organizations flexibility to choose according to security, scalability, and cost considerations. On-premise solutions appeal to enterprises with strict data control requirements, while cloud-based deployments support rapid scalability and remote access, facilitating hybrid and virtual event formats.
- For instance, According to AlphaSense, North America’s cloud computing market is the world’s largest, with U.S. financial and tech firms increasing cloud budgets for advanced analytics and experiential marketing platforms in 2025.
By Organization Size
The market caters to small and medium enterprises (SMEs) and large enterprises. SMEs typically prefer cost-efficient, adaptable solutions that allow targeted, localized campaigns. Large enterprises invest in comprehensive, integrated systems capable of managing complex, multi-channel, and multi-location experiential initiatives with consistent brand messaging.
By Touchpoint
Touchpoints cover call centers, websites, mobile applications, email, social media, and others, enabling omnichannel engagement strategies. This multi-platform approach enhances consumer interaction by delivering seamless and personalized experiences across diverse communication channels, improving brand reach and loyalty.
By Industry Vertical
Industry verticals served include IT and telecom, banking, financial services and insurance (BFSI), energy and utilities, government, retail, manufacturing, and others. Each sector demands specific experiential approaches aligned with its regulatory environment and operational challenges. This segmentation supports tailored strategies that drive effectiveness and growth across varied industries.
Segmentation:
By Component
- Solutions
- Services
By Deployment
- On-premise
- Cloud-based
By Organization Size
- Small and Medium Enterprises (SMEs)
- Large Enterprises
By Touchpoint
- Call Center
- Website
- Mobile Application
- Social Media
- Others
By Industry Vertical
- IT and Telecom
- Banking, Financial Services, and Insurance (BFSI)
- Energy and Utilities
- Government
- Retail
- Manufacturing
- Others
By Region
- United States
- Canada
- Mexico
Regional Analysis:
United States Dominates with Largest Market Share and Technological Leadership
The United States leads the North America Experiential Market, accounting for nearly 75% of the regional market share. Its mature consumer base and advanced technological infrastructure drive high demand for experiential marketing services. Key sectors including retail, automotive, entertainment, and technology invest heavily in immersive campaigns to deepen consumer engagement and loyalty. The widespread adoption of augmented reality (AR) and virtual reality (VR) enhances brand activations, enabling more personalized and impactful experiences. Diverse demographics encourage brands to customize localized experiences to resonate with various audience segments. The United States remains the primary engine of growth and innovation within the region.
Canada Exhibits Steady Growth with Emphasis on Sustainability and Hybrid Events
Canada holds approximately 15% of the North America Experiential Market share, showing consistent expansion driven by rising interest in consumer-centric marketing approaches. Major cities such as Toronto, Vancouver, and Montreal act as hubs for experiential campaigns that prioritize sustainability and social responsibility, reflecting evolving consumer values. Canadian companies increasingly employ hybrid event formats that blend physical and digital elements, broadening reach and adapting to changing audience behaviors. Strong adoption in industries like healthcare, retail, and financial services supports this growth. Investment in advanced analytics facilitates precise campaign measurement and optimization, contributing meaningfully to regional market development.
Mexico Shows Growing Potential with Localized Campaigns and Expanding Digital Access
Mexico captures around 10% of the North America Experiential Market share, presenting substantial growth prospects. Metropolitan areas including Mexico City, Monterrey, and Guadalajara attract increasing brand investments focused on culturally relevant, localized experiential marketing. Leading industries such as automotive, retail, and consumer electronics utilize experiential campaigns to elevate brand awareness and foster consumer interaction. Infrastructure limitations and budget constraints pose challenges for smaller firms; however, expanding digital connectivity and social media influence drive market penetration. The blend of physical and digital experiential channels positions Mexico for stronger regional competitiveness and sustained market growth.
Key Player Analysis:
- Ansira (U.S.)
- GES (U.S.)
- Sparks Marketing Corp (U.S.)
- Omnicom Group (U.S.)
- Elite Marketing Group (U.S.)
- Stagwell (U.S.)
- MKTG (dentsu) (UK, but active in North America)
- Inspira Marketing Group (U.S.)
- Publicis Experiences (U.S.)
- The Taylor Group (U.S.)
- Interpublic Group (U.S.)
Competitive Analysis:
The North America Experiential Market features a highly competitive landscape driven by established global agencies and innovative specialized firms. Key players such as Omnicom Group, Interpublic Group, Publicis Experiences, GES, and Stagwell dominate through extensive service portfolios that include large-scale event management, digital activations, and immersive brand experiences. These companies leverage advanced technologies like augmented reality (AR) and virtual reality (VR) to differentiate their offerings and deliver personalized consumer engagements. The market also witnesses competition from niche agencies focusing on localized and digital-first campaigns tailored for specific industries and demographics. It emphasizes innovation, creativity, and data-driven strategies to capture market share. Strategic partnerships, mergers, and acquisitions remain common as firms seek to expand capabilities and geographic reach. The competitive dynamics drive continuous evolution of experiential marketing solutions, positioning the North America Experiential Market as a robust and dynamic sector with strong growth potential.
Recent Developments:
- In April 2025, Ansiraexpanded its client roster and fully integrated BrandMuscle and SproutLoud, enhancing its channel marketing platform and launching a real-time changelog for clients.
- In April 2025, GESagreed to be acquired by Truelink Capital for $535 million, with the deal including GES Exhibitions and Spiro, and completion expected by year-end.
- In May 2025, Stagwellacquired JetFuel, boosting its experiential marketing portfolio, and in June 2024, launched new AI-powered capabilities for marketers in partnership with Google Cloud.
- In April 2024, Elite Marketing Grouprebranded as Luxury Audio Group, expanding its premium audio partnerships in North and Latin America.
Market Concentration & Characteristics:
The North America Experiential Market exhibits a moderately concentrated structure, with a few leading global agencies holding significant market share alongside numerous specialized regional firms. It is characterized by intense competition focused on innovation, technology integration, and customized consumer experiences. Major players leverage their extensive resources and broad service offerings to secure large contracts, while smaller agencies excel in niche markets with localized and digital-first campaigns. The market values agility, creativity, and data-driven strategies, driving continuous adaptation to evolving consumer preferences and technological advancements. Investment in augmented reality (AR), virtual reality (VR), and hybrid event formats further differentiates providers. It maintains a dynamic environment where strategic partnerships and mergers enhance capabilities and geographic presence, reinforcing the competitive landscape and fostering sustained growth.
Report Coverage:
The research report offers an in-depth analysis based on by component, deployment, organization size, touchpoint, and industry vertical. It details leading market players, providing an overview of their business, product offerings, investments, revenue streams, and key applications. Additionally, the report includes insights into the competitive environment, SWOT analysis, current market trends, as well as the primary drivers and constraints. Furthermore, it discusses various factors that have driven market expansion in recent years. The report also explores market dynamics, regulatory scenarios, and technological advancements that are shaping the industry. It assesses the impact of external factors and global economic changes on market growth. Lastly, it provides strategic recommendations for new entrants and established companies to navigate the complexities of the market.
Future Outlook:
- The North America Experiential Market will continue expanding driven by rising demand for immersive brand engagements.
- Adoption of augmented reality (AR) and virtual reality (VR) technologies will accelerate, enhancing consumer interaction.
- Hybrid event formats blending physical and digital experiences will gain prominence, increasing accessibility and reach.
- Increased investment in data analytics and AI will improve campaign personalization and measurement accuracy.
- Sustainability and social responsibility will shape experiential marketing strategies, aligning with consumer values.
- Small and medium enterprises (SMEs) will adopt experiential tactics through cost-effective, localized activations.
- Integration of social media with experiential campaigns will amplify brand visibility and user-generated content.
- Cross-industry adoption will expand, with healthcare, finance, and education sectors increasing experiential investments.
- Strategic collaborations and acquisitions among agencies will strengthen market positions and service portfolios.
- Consumer demand for authentic, personalized experiences will drive innovation and creative differentiation across the market.
Request a Free Sample
Fill in your details and we'll send you a free sample report.
- Sample data tables & charts
- Research methodology
Need a Custom Version of This Report?
Tailor the scope, geography, or segments to your exact requirements.
- Custom geography or segment scope
- Direct access to our analyst team
Frequently Asked Questions
What is the current size of the North America Experiential Market?
What factors are driving the growth of the North America Experiential Market?
What are some challenges faced by the North America Experiential Market?
Who are the major players in the North America Experiential Market?
Table of Content
Chapter 1. Report Introduction
- 1.1 Report Description & Purpose
- 1.1.1 Report Title & Market Definition
- 1.1.2 Unique Selling Propositions (USP) & Key Differentiators
- 1.1.3 Value Proposition for Stakeholders
- 1.2 Research Objectives
- 1.2.1 Market Sizing Objectives (Volume & Revenue)
- 1.2.2 Segmentation Objectives
- 1.2.3 Competitive Intelligence Objectives
- 1.2.4 Forecast & Scenario Objectives
- 1.3 Report Scope
- 1.3.1 North America Experiential Scope – Types & Subtypes Covered
- 1.3.2 Geographic Scope – Regions & Countries Covered
- 1.3.3 Historical Period, Base Year & Forecast Period (2024; forecast to 2032)
- 1.3.4 Inclusions & Exclusions
- 1.4 HS Code & Classification Framework
- 1.5 Currency, Units & Pricing Basis
- 1.6 Target Stakeholders
- 1.7 Limitations & Assumptions
Chapter 2. Executive Summary
- 2.1 Global North America Experiential Market Snapshot
- 2.1.1 Market Size – Historical (2024) & Forecast (2024-2032) (2024: USD 17,224 million → 2032: USD 26,634.5 million)
- 2.1.2 Volume & Revenue – Global Totals
- 2.1.3 Key Market Highlights – Top Five Facts
- 2.2 North America Experiential Market Segmentation Snapshot
- 2.2.1 Market Split by Region – 2024 vs. 2032
- 2.3 Competitive Snapshot
- 2.3.1 Top 10 Players by Revenue Share – 2024
- 2.3.2 Top 10 Players by Volume Share – 2024
- 2.3.3 Recent Strategic Developments (18-Month Summary)
- 2.4 Key Investment Highlights & Strategic Conclusions
Chapter 3. North America Experiential Market Dynamics & Industry Analysis
- 3.1 Market Overview & Context
- 3.1.1 North America Experiential Market Position in the Broader Automotive Value Chain
- 3.1.2 OEM vs. Replacement Market Dynamics
- 3.1.3 Market Maturity & Development Stage by Region
- 3.2 North America Experiential Market Drivers
- 3.3 North America Experiential Market Restraints & Challenges
- 3.4 North America Experiential Market Opportunities
- 3.5 Porter's Five Forces Analysis
- 3.5.1 Threat of New Entrants
- 3.5.2 Bargaining Power of Suppliers
- 3.5.3 Bargaining Power of Buyers
- 3.5.4 Threat of Substitutes
- 3.5.5 Competitive Rivalry – Intensity Assessment
- 3.6 North America Experiential Value Chain Analysis
- 3.6.1 Upstream – Raw Material/Input Suppliers
- 3.6.1.1 Raw Material/Input 1
- 3.6.1.2 Raw Material/Input 2
- 3.6.1.3 Raw Material/Input 3
- 3.6.2 Midstream – Production/Manufacturing/Service Delivery
- 3.6.2.1 Production/Process Overview
- 3.6.2.2 Key Facility Locations & Capacity by Manufacturer
- 3.6.3 Downstream – Distribution & End Consumer
- 3.6.3.1 Primary Channel – B2B/OEM
- 3.6.3.2 Secondary Channels – Dealer, Retail, Online, Direct
- 3.6.4 Value Chain Profitability Analysis
- 3.6.1 Upstream – Raw Material/Input Suppliers
- 3.7 PESTEL Analysis
- 3.7.1 Political Factors
- 3.7.2 Economic Factors
- 3.7.3 Social Factors
- 3.7.4 Technological Factors
- 3.7.5 Environmental Factors
- 3.7.6 Legal Factors
- 3.8 North America Experiential Supply Chain Analysis
- 3.8.1 Raw Material/Input Supply Risk Assessment
- 3.8.2 Manufacturing Concentration Risk (Geographic Exposure)
- 3.8.3 Trade Disruption Impact Analysis
- 3.9 Regulatory & Policy Landscape
Note: The regulatory and policy landscape section covers regulations based on their applicability to the market, North America Experiential category, geography, and scope of the study. Only regulatory frameworks with a material impact on operations, compliance, trade, sustainability, or market access are analyzed in detail.
Chapter 4. Key Investment Pockets & Opportunity Analysis
- 4.1 North America Experiential Market Attractiveness Analysis
- 4.1.1 By Region – Investment Attractiveness Matrix (Volume × CAGR)
- 4.2 Absolute Revenue Growth Opportunity
- 4.2.1 By Region – Absolute USD Growth Through 2032
- 4.3 Incremental Volume Opportunity
- 4.3.1 By Region – Incremental Volume Through 2032
- 4.3.2 Segment – Incremental Volume
- 4.4 Emerging Submarket Opportunity Deep Dive (Subject to Applicability)
- 4.5 Emerging Market Opportunity Scorecards
- 4.5.1 United States
- 4.5.2 Europe
- 4.5.3 Asia
- 4.5.4 Middle East & Africa
Note: Emerging Market Opportunity Scorecards will be included based on relevance and strategic importance. Regions listed are indicative and may vary depending on data availability and market dynamics.
Chapter 5. North America Experiential Import-Export Analysis & Trade Flows
- 5.1 Global Trade Overview
- 5.1.1 Global Export Value by Country (2024)
- 5.1.2 Global Export Volume by Country (2024)
- 5.1.3 Global Import Value by Country (2024)
- 5.1.4 Global Import Volume by Country (2024)
- 5.1.5 Net Trade Balance by Country (2024)
- 5.2 Export Analysis – Segment
- 5.2.1 Type 1 (HS Code)
- 5.2.2 Type 2 (HS Code)
- 5.2.3 Type 3 (HS Code)
- 5.2.4 Type 4 (HS Code)
- 5.2.5 Type 5 (HS Code)
- 5.3 Import Analysis – Segment
- 5.3.1 Type 1 (HS Code)
- 5.3.2 Type 2 (HS Code)
- 5.3.3 Type 3 (HS Code)
- 5.3.4 Type 4 (HS Code)
- 5.3.5 Type 5 (HS Code)
- 5.4 Average Unit Trade Prices
- 5.4.1 Average Export Price – Segment & Country
- 5.4.2 Average Import Price – Segment & Source Country
- 5.4.3 Price Trends (2024)
- 5.5 Key Trade Route Analysis
- 5.5.1 Trade Route 1
- 5.5.2 Trade Route 2
- 5.5.3 Trade Route 3
- 5.5.4 Trade Route 4
- 5.5.5 Trade Route 5
- 5.6 Trade Policy Impact Assessment
- 5.6.1 US Anti-Dumping & Section 301 Tariffs
- 5.6.2 EU Customs Union Impact
- 5.6.3 Major Free Trade Agreements
- 5.6.4 USMCA Rules of Origin
Note: Trade policy analysis will be included only where relevant to the North America Experiential market.
Chapter 6. Competitive Landscape & Company Benchmarking
- 6.1 North America Experiential Market Concentration & Structure
- 6.1.1 Herfindahl-Hirschman Index (HHI) – vs. 2024
- 6.1.2 Tier 1, Tier 2 & Tier 3 Market Structure
- 6.1.3 Global, Regional & Local Player Dynamics
- 6.2 North America Experiential Market Share Analysis – 2024
- 6.2.1 Global Revenue Share by Company
- 6.2.2 Global Volume Share by Company
- 6.2.3 Regional Revenue Share
- 6.2.4 Market Share Evolution ( vs. 2024)
- 6.2.5 OEM Segment Share by Company
- 6.2.6 Replacement Segment Share by Company
- 6.3 Production/Delivery Capacity & Facility Analysis
- 6.3.1 Global Installed Capacity
- 6.3.2 Capacity Utilization Rates
- 6.3.3 Production/Output Volume
- 6.3.4 Facility Locations & Capacity Map
- 6.3.5 Planned Capacity Additions
- 6.4 North America Experiential Competitive Benchmarking Matrix
- 6.4.1 Revenue, Volume, CAGR & Profitability Comparison
- 6.4.2 Channel Revenue Mix
- 6.4.3 Geographic Revenue Exposure
- 6.4.4 R&D Intensity
- 6.4.5 Sustainability Maturity
- 6.5 Strategic Developments in North America Experiential (Last 24 Months)
- 6.5.1 Mergers, Acquisitions & Divestments
- 6.5.2 New North America Experiential Launches
- 6.5.3 Facility Expansions
- 6.5.4 Strategic Alliances, Joint Ventures & Partnerships
- 6.5.5 Distribution Expansion & Market Entry
- 6.5.6 Sustainability & ESG Initiatives
- 6.6 Competitive Strategy Mapping
- 6.6.1 Leader, Challenger, Follower & Niche Classification
- 6.6.2 Pricing Strategy Comparison
- 6.6.3 Channel Strategy Matrix
Note: Strategic developments are included based on their materiality and the availability of reliable information.
Chapter 7. Global North America Experiential Market – By Distribution Channel
- 7.1 Segment Overview
- 7.1.1 Volume & Revenue Split by Channel (2024 & 2032)
- 7.1.2 Channel Mix Evolution (2024-2032)
Chapter 8. Regional Market Analysis – Global Overview
- 8.1 Global Regional Overview
- 8.1.1 Regional Volume Share
- 8.1.2 Regional Revenue Share
- 8.1.3 Regional Volume by Region
- 8.1.4 Regional Revenue by Region
- 8.1.5 Regional Forecast Through 2032
- 8.2 Cross-Regional Segment Analysis
- 8.2.1 By Distribution Channel
- 8.2.2 By Brand/Price Tier
Chapter 9. North America North America Experiential Market
- 9.1 United States
- 9.2 Canada
- 9.3 Mexico
Chapter 10. Europe North America Experiential Market
- 10.1 Germany
- 10.2 France
- 10.3 Italy
- 10.4 United Kingdom
- 10.5 Spain
- 10.6 Poland
- 10.7 Russia
- 10.8 Netherlands
- 10.9 Belgium
- 10.10 Sweden
- 10.11 Denmark
- 10.12 Norway
- 10.13 Rest of Europe
Chapter 11. Asia Pacific North America Experiential Market
- 11.1 China
- 11.2 India
- 11.3 Japan
- 11.4 South Korea
- 11.5 Thailand
- 11.6 Indonesia
- 11.7 Vietnam
- 11.8 Malaysia
- 11.9 Australia
- 11.10 Rest of Asia Pacific
Chapter 12. Latin America North America Experiential Market
- 12.1 Brazil
- 12.2 Argentina
- 12.3 Colombia
- 12.4 Chile
- 12.5 Rest of Latin America
Chapter 13. Middle East North America Experiential Market
- 13.1 Saudi Arabia
- 13.2 United Arab Emirates
- 13.3 Turkey
- 13.4 Israel
- 13.5 Iran
- 13.6 Rest of the Middle East
Chapter 14. Africa North America Experiential Market
- 14.1 South Africa
- 14.2 Egypt
- 14.3 Nigeria
- 14.4 Morocco
- 14.5 Rest of Africa
Chapter 15. North America Experiential Company Profiles
- 15.1 [Company 01]
- 15.1.1 Company Overview
- 15.1.2 Key Management Personnel
- 15.1.3 Products & Services Portfolio
- 15.1.4 Financial Performance
- 15.1.5 Key Market Focus & Geographic Presence
- 15.1.6 Recent Developments & Strategic Initiatives
Note: The company profile list is preliminary and may change based on research findings, market developments, data availability, and client requirements.
Chapter 16. Appendices
- Appendix A – List of Abbreviations & Acronyms
- Appendix B – Industry Classification Code Reference – Full Series
- Appendix C – Production & Capacity Data Tables
- Appendix D – End-Use & Demand Base Tables
- Appendix E – Consumption & Replacement Rate Assumptions
- Appendix F – ASP Reference Tables
- Appendix G – Manufacturing & Facility Database
- Appendix H – Import-Export Data Tables
- Appendix I – Regulatory Summary Tables
- Appendix J – Primary Research Participant List (Anonymized)
- Appendix K – Primary Research Questionnaire Framework
- Appendix L – Data Sources & Bibliography
- Appendix M – Market Size Divergence & Source Comparison
Chapter 17. Research Methodology
- 17.1 Research Framework & Philosophy
- 17.2 Secondary Research – Sources, Hierarchy & Data Extraction
- 17.3 Data Modeling – Bottom-Up & Top-Down Market Sizing
- 17.4 Primary Research – Stakeholder Framework, LOI & Sample Sizes
- 17.5 Forecast Methodology – Regression, Scenario & Sensitivity Analysis
- 17.6 Quality Control – Four-Layer Validation Framework
- 17.7 Limitations & Standard Assumptions
- 17.8 Disclaimer
