
Market Overview:
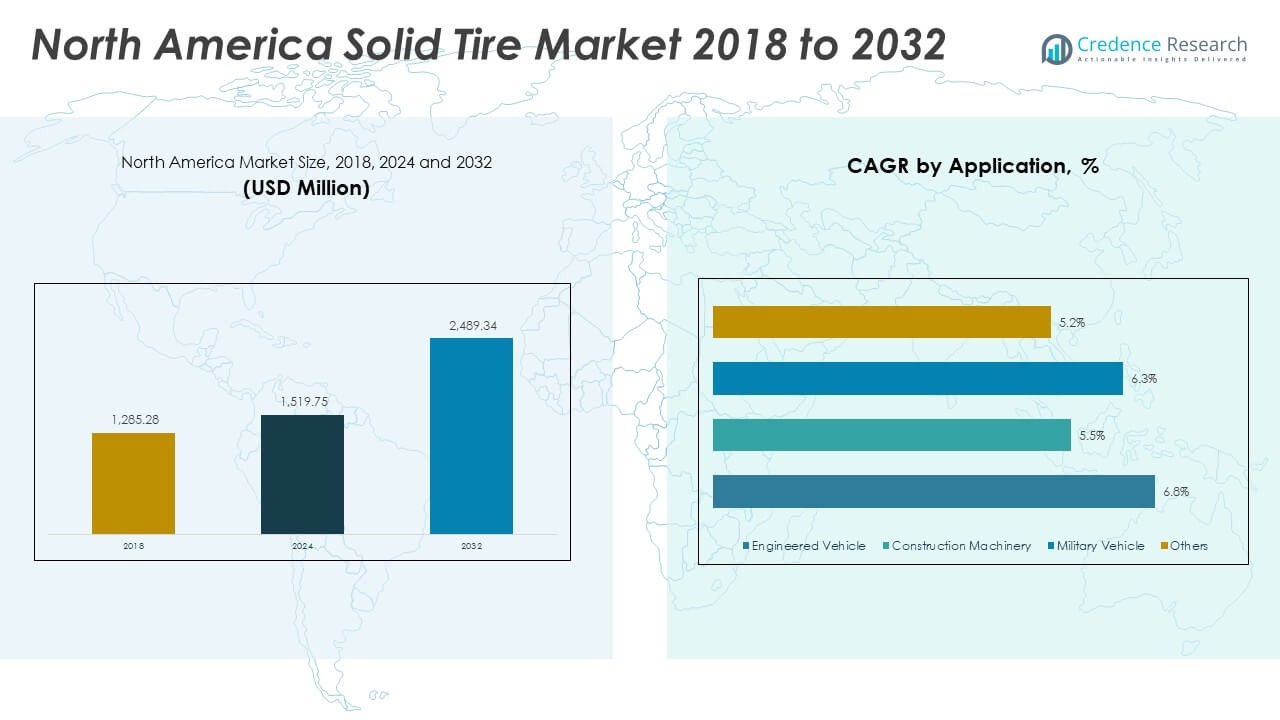
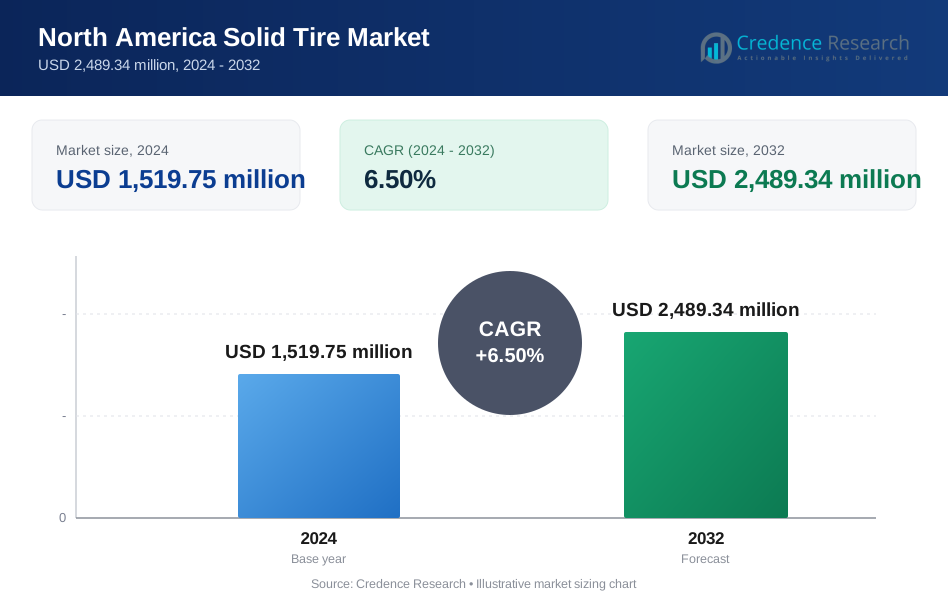
The North America Solid Tire Market size was valued at USD 1,285.28 million in 2018 to USD 1,519.75 million in 2024 and is anticipated to reach USD 2,489.34 million by 2032, at a CAGR of 6.50 % during the forecast period.
| REPORT ATTRIBUTE | DETAILS |
|---|---|
| Historical Period | 2020-2023 |
| Base Year | 2024 |
| Forecast Period | 2025-2032 |
| North America Solid Tire Market Size 2024 | USD 1,519.75 Million |
| North America Solid Tire Market, CAGR | 6.50 % |
| North America Solid Tire Market Size 2032 | USD 2,489.34 Million |
The market grows on demand from logistics, construction, and industrial sectors. Durable, low‑maintenance solid tires appeal where uptime matters. Increasing automation and e‑commerce further boost demand in warehouses. Manufacturers see value in long‑life products. Rising infrastructure development also spurs consumption. Firms invest in material handling and heavy machinery applications. Demand stays steady with economic expansion. Supply aligns with sector needs.
North America leads thanks to robust industrial base and mature infrastructure. The U.S. drives adoption for forklifts in logistics and construction. Canada supports niche demand for durable OEM replacements. Mexico grows fast with expanding warehousing and manufacturing hubs. Firms target growth through customized regional supply. Distribution and trade networks strengthen via cross‑border partnerships. Emerging rural infrastructure drives demand in non‑urban zones.
Market Insights:
- The North America Solid Tire Market was valued at USD 1,285.28 million in 2018, reached USD 1,519.75 million in 2024, and is projected to hit USD 2,489.34 million by 2032, growing at a CAGR of 6.50%.
- The United States holds the largest share at 62% in 2024, driven by strong logistics and construction demand, while Canada accounts for 23% with stable manufacturing and warehousing activity, and Mexico follows with 15% supported by expanding automotive and industrial hubs.
- Mexico represents the fastest-growing country in the region with a 15% share, fueled by new logistics facilities, foreign investment, and expanding cross-border trade.
- Cured-On Solid Tires accounted for 41% of the market in 2024, showing higher adoption in construction machinery and heavy-duty vehicles due to longer service life.
- Pressed-On Solid Tires represented 59% in 2024, dominating material handling applications such as forklifts and warehousing vehicles because of ease of installation and operational flexibility.
Market Drivers:
Strong demand from construction, logistics, industry:
The North America Solid Tire Market reflects demand for tough, long‑lasting solutions. It meets needs where maintenance risk proves high and downtime costs rise. Firms choose solid tires for aggressive material handling despite rough use. The region’s construction boom keeps demand steady. Logistics hubs prefer reliable, puncture‑free options indoors and outdoors. Industry players invest more in structured fleets needing solid assets. It supports sectors that value durability and texture retention. The consistent usage promotes recurring purchase cycles. It drives steady market expansion.
- For instance, Continental’s ContiConnect system has been deployed across thousands of trailers providing real-time tire pressure, temperature, and GPS tracking that enable early warnings before failures, improving fleet reliability and reducing unexpected downtime.
Cost efficiency through reduced maintenance:
Solid tires cut expenses by avoiding flats and frequent replacements. It proves budget‑friendly over time thanks to fewer breakdowns and repairs. Warehouses save on spare inventory and labor for tire changes. Industries favor them for continuous operations with minimal service stops. The absence of air pressure needs simplifies management. Preventive downtime drops sharply across operations. Users shift capital from maintenance to productivity spending. The savings justify upfront cost differences. This economic edge boosts adoption over pneumatic alternatives.
- For example, Sentry Tire reports that in warehouse environments, solid tires last two to three times longer than pneumatic tires, which dramatically cuts maintenance cycles and costs.
Technological innovation and materials advancement:
Solid tire makers push innovation in compound design and shelf life. It benefits users by reducing wear and improving load‑carrying strength. Chemists refine blends for abrasion resistance and energy efficiency. Manufacturers embed sensors and IoT for performance tracking. They improve safety and predictive replacement scheduling. New recycled and eco‑friendly formulations gain interest among green buyers. Tech drives longer lifespan and lower lifecycle cost in tough use‑cases. Firms tout material gains to compete on quality and reliability. Innovation supports growing demand in advanced industrial settings.
Supportive safety regulations and industrial standards:
Safety rules promote use of puncture‑proof solid tires in industrial settings. It meets OSHA and other standards for high‑risk operations and indoor spaces. Regulators encourage equipment uptime and worker protection in manufacturing. Industrial sites invest in safer tire solutions for forklifts and stackers. Risk reduction matters where productivity and human safety intersect. Solid tires reduce hazards from blowouts and tire failures. Employers adopt durable options to manage liability and compliance. Standardization supports broader deployment across sectors. This environment underpins steady market traction.
Market Trends:
Adoption of smart sensor-integrated tires:
The North America Solid Tire Market embraces IoT and sensors for health tracking. It enables fleet managers to monitor tire wear in real time. This boosts predictive maintenance and minimizes unplanned downtime. Data insights prompt timely swaps before failure happens. Such solutions reduce overhead and improve safety. Companies pilot digital twin frameworks for tire condition prediction. Tech integration grows across supply and logistics fleets. Users demand smarter products, not just rugged ones. This elevates market expectations and supplier offerings.
- For instance, Bridgestone's partnership with Tyrata on the IntelliTread™ system exemplifies this trend by utilizing solid-state sensors embedded in tires that relay real-time tread-depth data to cloud platforms, alerting managers when tread wear reaches critical levels.
Growth of electric and automated vehicles in warehouses:
Solid tire demand rises with electric forklifts, AGVs, and indoor robots. It serves the smooth, high-torque needs of battery-driven machines. Automated systems rely on consistent traction and zero-flat designs. Warehouses transition to fully electric fleets to cut emissions. This move boosts demand for low-maintenance solid assets. Suppliers tailor tires for silent, efficient use under new powertrains. The increase in e-commerce logistics accelerates this shift. Robotics adoption supports specialized solid tire development. The trend revolutionizes material handling in North America.
- For instance, Tesla’s Cybertruck, for instance, is equipped with integrated smart tire sensors measuring load, wear, and road conditions, feeding data into vehicle dynamics systems to optimize performance.
Shift to sustainable and recycled materials:
Solid tire makers use eco-friendly compounds and recycled rubber. It meets green procurement targets in corporate supply chains. Sustainability becomes selling point for industrial buyers with ESG goals. Manufacturers offer longer-life tires with lower carbon footprint. Clients value reduced waste and cost across tire lifecycle. Recycling aligns with regional regulations and environmental strategies. Firms market green credentials to gain contracts with eco-focused sectors. Material innovation helps solid tires meet new compliance standards. The shift strengthens market appeal among progressive buyers.
Customization for industry-specific needs:
Solid tire producers offer tailored sizes, compounds, and patterns per sector use. It meets differences between construction, logistics, mining, and yard vehicles. Customers negotiate specs for load, wear, terrain, and usage cycle. OEMs and end users seek fit-for-purpose options over one-size solutions. Customization enhances performance in targeted environments. Demand for niche variants increases with fleet specialization. Makers collaborate on co-engineering with large industrial clients. Custom options win over standard models in mature markets. This trend drives deeper user-supplier partnerships.
Market Challenges:
High upfront cost limits adoption among smaller operators:
The North America Solid Tire Market faces resistance due to higher initial price. Smaller firms and budget-sensitive buyers still choose cheaper pneumatic options. Capital-constrained operations delay investment despite long-term benefits. It forces sales cycles to focus on ROI convincing and comparisons. Sellers must highlight total cost of ownership to justify price. Lack of awareness on lifecycle savings slows conversion. Some prefer comfort of pneumatic ride over solid rigidity. This gap restrains market expansion in lower-tier segments. Overcoming cost perception remains critical.
Limited comfort and shock absorption:
Solid tires provide less cushioning compared to pneumatic options. It creates rougher rides in lighter vehicles and sensitive equipment. Users in sectors where operator comfort matters may avoid solid choices. It restricts adoption in passenger transport or mobile machinery. Perceived ride harshness influences purchase decisions. It affects acceptance among smaller, mixed-use fleets. Manufacturers must address this through compound modulation or semi-solid designs. Comfort remains gap even with durability gains. Overcoming ride quality issues poses a technical and marketing challenge.
Market Opportunities:
Expansion into emerging industrial sectors:
The North America Solid Tire Market can tap growth in automated logistics and construction robotics. It can supply tailored solid options for AGVs and indoor electric fleets. High turnover facilities require durable, low-maintenance tires. Health-sensitive environments prefer zero-flat solutions. The spread of last-mile distribution centers drives demand for custom sizes. Industrial robotics and cold-storage plants offer niche opportunities. Producers can co-develop with clients for new applications. This opens fresh revenue streams beyond traditional segments.
Green innovations and circular economy adoption:
The North America Solid Tire Market can grow via recycled-material and eco-friendly compound options. It can attract buyers with strong sustainability mandates. Companies can partner with recyclers to create closed-loop tire models. Green product lines may access government incentives or certifications. Branding around eco credentials may win industrial purchasing contracts. Circular economy models boost repeat business and loyalty. This approach differentiates makers in crowded markets. Sustainability becomes a growth lever for solid tire businesses.
Market Segmentation Analysis:
By Type
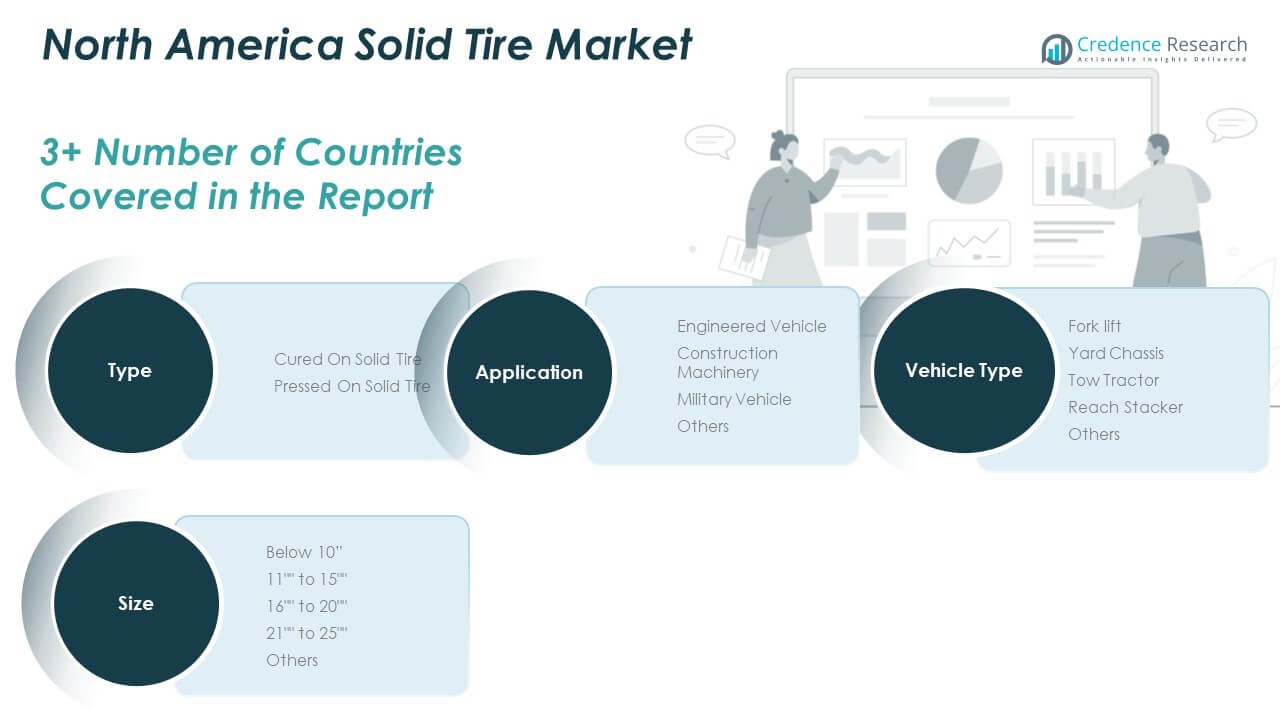
The North America Solid Tire Market divides into cured-on and pressed-on solid tires. Cured-on types dominate due to superior durability and lower long-term maintenance. Pressed-on types remain popular for forklifts and smaller vehicles needing flexibility. Both segments continue to see growth as industries expand fleet sizes.
- For instance, Continental’s Super Elastic solid tires undergo vulcanization directly onto rims, providing long service life and enhanced resistance to wear and tear, meeting the rigorous demands of material handling and construction machinery. Pressed-on tires remain popular for forklifts and smaller vehicles needing flexibility and quick replacement.
By Application
Engineered vehicles, particularly forklifts, hold the largest market share. Construction machinery contributes strongly with demand from infrastructure projects. Military vehicles adopt solid tires for rugged, puncture-proof use. Other applications, including agriculture and industrial equipment, add steady demand.
- For instance, Yokohama’s solid tires for forklifts combine advanced rubber compounds to extend tire life and improve traction in warehouse environments characterized by frequent stops and turns. Construction machinery contributes strongly with demand fueled by infrastructure projects, supported by products like Maxam’s construction solid tires engineered for heavy loads and rough terrain, offering improved performance and durability.
By Size
Tires sized 11″ to 15″ lead the market, driven by forklift and warehouse vehicle demand. Larger sizes like 16″ to 20″ and 21″ to 25″ support construction and heavy-duty vehicles. Smaller sizes under 10″ serve compact machinery and niche industrial uses. The size mix reflects diverse applications across sectors.
By Vehicle Type
Forklifts remain the primary vehicle type using solid tires in North America. Tow tractors and reach stackers also create strong demand in logistics hubs. Yard chassis adoption grows with port expansion and intermodal transport needs. Other specialized vehicles contribute incremental growth in industrial and military sectors.
Segmentation:
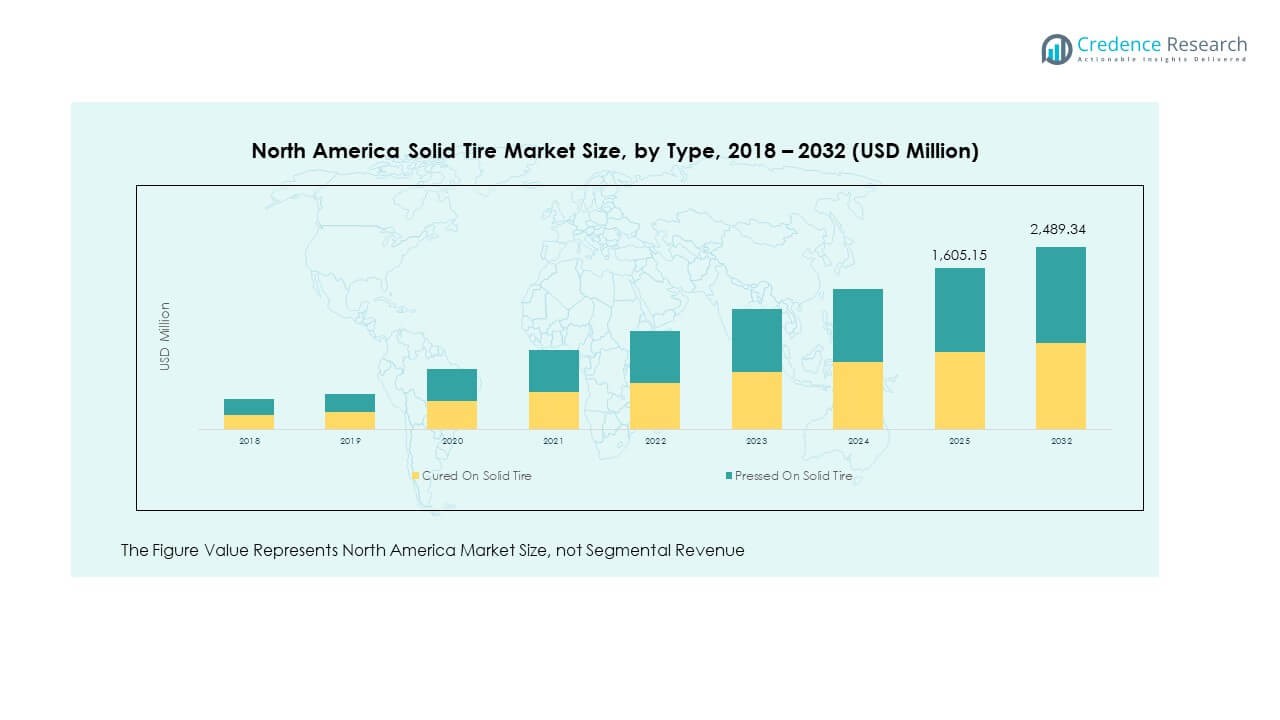
- By Type
- Cured-On Solid Tire
- Pressed-On Solid Tire
- By Application
- Engineered Vehicle
- Construction Machinery
- Military Vehicle
- Others
- By Size
- Below 10″
- 11″ to 15″
- 16″ to 20″
- 21″ to 25″
- Others
- By Vehicle Type
- Forklift
- Yard Chassis
- Tow Tractor
- Reach Stacker
- Others
Regional Analysis:
United States
The United States holds the dominant position in the North America Solid Tire Market with nearly 62% share in 2024. It benefits from a strong industrial base, robust logistics networks, and extensive construction activity. High forklift usage in warehousing and e-commerce facilities supports continuous demand. The country also invests heavily in automation, which increases the need for solid tires in automated guided vehicles and electric forklifts. Major manufacturers maintain distribution networks in the U.S., ensuring reliable product availability. With strong adoption in both heavy machinery and engineered vehicles, the U.S. will continue to shape overall market direction. It acts as the primary growth engine for the region.
Canada
Canada accounts for about 23% of the market share in 2024, driven by its manufacturing, mining, and logistics sectors. The country emphasizes durable and reliable tire solutions to support operations in cold storage, heavy industrial plants, and harsh weather conditions. Canadian demand remains steady, particularly in sectors requiring puncture-proof tires for safety and efficiency. Companies in Canada adopt solid tires for forklifts in warehousing, especially near key trade hubs such as Ontario and Quebec. Investment in infrastructure also supports demand from construction machinery. It remains a stable market, contributing consistent revenue flow to the regional landscape.
Mexico
Mexico contributes roughly 15% share in 2024 and shows the fastest growth in the region. It benefits from expanding automotive manufacturing hubs, cross-border trade with the U.S., and the rise of modern warehousing facilities. The adoption of solid tires grows rapidly in logistics operations as nearshoring strategies bring new factories and suppliers closer to North American demand centers. Mexican ports and intermodal terminals increase use of solid tires in yard chassis and tow tractors. Rising construction projects in industrial corridors also boost consumption. It strengthens its position as an emerging growth hotspot within the North America Solid Tire Market.
Key Player Analysis:
- CAMSO (Micheline)
- Continental AG
- Global Rubber Industries
- NEXEN TIRE
- Setco Solid Tire & Rim Assembly
- Superior Tire & Rubber Corp
- Trelleborg
- Tube & Solid Tire
- TY Cushion Tire
- Maxam Tire
Competitive Analysis:
The North America Solid Tire Market features a concentrated base of established players and niche innovators. CAMSO (Micheline), Continental AG, Global Rubber Industries, and NEXEN TIRE compete on innovation and service. Setco, Superior Tire, Trelleborg, Tube & Solid Tire, TY Cushion Tire, and Maxam support diversified needs across vehicle types. Firms differentiate via material durability, compound tech, and IoT-enabled performance. They engage with OEMs for co-development and customized solutions. Pricing tension arises from initial cost versus lifecycle value. Regional distribution partnerships and service coverage matter in customer retention. Product line breadth—from cured-on to pressed-on types—drives competitive strength. Marketing focus leans toward green compounds and smart features. Comfort gaps and price sensitivity shape positioning. Overall, competition centers on value through innovation, reliability, and aftermarket support.
Recent Developments:
- In May 2025, Continental AG made a strong start to the year with tire group sales reaching €3.4 billion in Q1 2025, driven by growth in the replacement tire business across all regions, including North America. Continental was recognized as “Tire Manufacturer of the Year” at the Tire Technology International Awards 2025 for innovation and sustainability efforts. The company continues to invest in sustainable manufacturing and product excellence, with its UltraContact NXT summer tires earning top ratings from several European automotive organizations.
- Trelleborg Tires showcased innovations at the 59th National Farm Machinery Show in February 2025 in Louisville, introducing new tires like the TM3000 CFO VF 1250/50R32 for large grain carts with optimized soil protection and load capacity. The HF1000 implement trailer tire and TM1 ECO POWER tire—winner of the 2025 AE50 Award for innovation and sustainability—reflect Trelleborg’s focus on advancing agricultural tire solutions in North America.
- Setco Solid Tire & Rim Assembly operates a central U.S.-based facility with in-house machining and exclusive rubber compounds designed for cut resistance and longevity. As of August 2025, Setco continues to lead with customized solid tire solutions for off-road and industrial applications, including skid steers, forklifts, cranes, and loaders, shipping across the continental U.S. with fast delivery.
Report Coverage:
The research report offers an in-depth analysis based on Segment 1, segment 2.. . It details leading market players, providing an overview of their business, product offerings, investments, revenue streams, and key applications. Additionally, the report includes insights into the competitive environment, SWOT analysis, current market trends, as well as the primary drivers and constraints. Furthermore, it discusses various factors that have driven market expansion in recent years. The report also explores market dynamics, regulatory scenarios, and technological advancements that are shaping the industry. It assesses the impact of external factors and global economic changes on market growth. Lastly, it provides strategic recommendations for new entrants and established companies to navigate the complexities of the market.
Future Outlook:
- Demand for solid tires will expand with rising warehouse automation and e-commerce growth across North America.
- Construction sector investment will sustain adoption of durable tires for heavy machinery and engineered vehicles.
- Forklifts will continue to dominate usage, but demand from tow tractors and reach stackers will accelerate.
- Technological innovations in tire compounds will enhance performance, lifespan, and energy efficiency in industrial applications.
- Eco-friendly and recycled material solutions will gain traction as industries align with sustainability goals.
- Digital monitoring and sensor integration will improve tire lifecycle management and reduce operational downtime.
- Regional trade agreements will strengthen cross-border supply networks, benefiting Mexico’s expanding manufacturing hubs.
- Military applications will drive specialized demand for puncture-proof solutions under rugged operational conditions.
- Market players will expand through partnerships with OEMs to deliver customized tire options.
- Competitive dynamics will focus on balancing upfront cost with lifecycle value, supporting broader adoption.
Request a Free Sample
Fill in your details and we'll send you a free sample report.
- Sample data tables & charts
- Research methodology
Need a Custom Version of This Report?
Tailor the scope, geography, or segments to your exact requirements.
- Custom geography or segment scope
- Direct access to our analyst team
Frequently Asked Questions
What is the current market size for North America Solid Tire Market, and what is its projected size in 2032?
At what Compound Annual Growth Rate is the North America Solid Tire Market projected to grow between 2024 and 2032?
Which North America Solid Tire Market segment held the largest share in 2024?
What are the primary factors fueling the growth of the North America Solid Tire Market?
Who are the leading companies in the North America Solid Tire Market?
Which region commanded the largest share of the North America Solid Tire Market in 2024?
Table of Content
Chapter 1. Report Introduction
- 1.1 Report Description & Purpose
- 1.1.1 Report Title & Market Definition
- 1.1.2 Unique Selling Propositions (USP) & Key Differentiators
- 1.1.3 Value Proposition for Stakeholders
- 1.2 Research Objectives
- 1.2.1 Market Sizing Objectives (Volume & Revenue)
- 1.2.2 Segmentation Objectives
- 1.2.3 Competitive Intelligence Objectives
- 1.2.4 Forecast & Scenario Objectives
- 1.3 Report Scope
- 1.3.1 North America Solid Tire Scope – Types & Subtypes Covered
- 1.3.2 Geographic Scope – Regions & Countries Covered
- 1.3.3 Historical Period, Base Year & Forecast Period (2024; forecast to 2032)
- 1.3.4 Inclusions & Exclusions
- 1.4 HS Code & Classification Framework
- 1.5 Currency, Units & Pricing Basis
- 1.6 Target Stakeholders
- 1.7 Limitations & Assumptions
Chapter 2. Executive Summary
- 2.1 Global North America Solid Tire Market Snapshot
- 2.1.1 Market Size – Historical (2024) & Forecast (2024-2032) (2024: USD 1,519.75 million → 2032: USD 2,489.34 million)
- 2.1.2 Volume & Revenue – Global Totals
- 2.1.3 Key Market Highlights – Top Five Facts
- 2.2 North America Solid Tire Market Segmentation Snapshot
- 2.2.1 Market Split by Region – 2024 vs. 2032
- 2.3 Competitive Snapshot
- 2.3.1 Top 10 Players by Revenue Share – 2024
- 2.3.2 Top 10 Players by Volume Share – 2024
- 2.3.3 Recent Strategic Developments (18-Month Summary)
- 2.4 Key Investment Highlights & Strategic Conclusions
Chapter 3. North America Solid Tire Market Dynamics & Industry Analysis
- 3.1 Market Overview & Context
- 3.1.1 North America Solid Tire Market Position in the Broader Automotive Value Chain
- 3.1.2 OEM vs. Replacement Market Dynamics
- 3.1.3 Market Maturity & Development Stage by Region
- 3.2 North America Solid Tire Market Drivers
- 3.3 North America Solid Tire Market Restraints & Challenges
- 3.4 North America Solid Tire Market Opportunities
- 3.5 Porter's Five Forces Analysis
- 3.5.1 Threat of New Entrants
- 3.5.2 Bargaining Power of Suppliers
- 3.5.3 Bargaining Power of Buyers
- 3.5.4 Threat of Substitutes
- 3.5.5 Competitive Rivalry – Intensity Assessment
- 3.6 North America Solid Tire Value Chain Analysis
- 3.6.1 Upstream – Raw Material/Input Suppliers
- 3.6.1.1 Raw Material/Input 1
- 3.6.1.2 Raw Material/Input 2
- 3.6.1.3 Raw Material/Input 3
- 3.6.2 Midstream – Production/Manufacturing/Service Delivery
- 3.6.2.1 Production/Process Overview
- 3.6.2.2 Key Facility Locations & Capacity by Manufacturer
- 3.6.3 Downstream – Distribution & End Consumer
- 3.6.3.1 Primary Channel – B2B/OEM
- 3.6.3.2 Secondary Channels – Dealer, Retail, Online, Direct
- 3.6.4 Value Chain Profitability Analysis
- 3.6.1 Upstream – Raw Material/Input Suppliers
- 3.7 PESTEL Analysis
- 3.7.1 Political Factors
- 3.7.2 Economic Factors
- 3.7.3 Social Factors
- 3.7.4 Technological Factors
- 3.7.5 Environmental Factors
- 3.7.6 Legal Factors
- 3.8 North America Solid Tire Supply Chain Analysis
- 3.8.1 Raw Material/Input Supply Risk Assessment
- 3.8.2 Manufacturing Concentration Risk (Geographic Exposure)
- 3.8.3 Trade Disruption Impact Analysis
- 3.9 Regulatory & Policy Landscape
Note: The regulatory and policy landscape section covers regulations based on their applicability to the market, North America Solid Tire category, geography, and scope of the study. Only regulatory frameworks with a material impact on operations, compliance, trade, sustainability, or market access are analyzed in detail.
Chapter 4. Key Investment Pockets & Opportunity Analysis
- 4.1 North America Solid Tire Market Attractiveness Analysis
- 4.1.1 By Region – Investment Attractiveness Matrix (Volume × CAGR)
- 4.2 Absolute Revenue Growth Opportunity
- 4.2.1 By Region – Absolute USD Growth Through 2032
- 4.3 Incremental Volume Opportunity
- 4.3.1 By Region – Incremental Volume Through 2032
- 4.3.2 Segment – Incremental Volume
- 4.4 Emerging Submarket Opportunity Deep Dive (Subject to Applicability)
- 4.5 Emerging Market Opportunity Scorecards
- 4.5.1 United States
- 4.5.2 Europe
- 4.5.3 Asia
- 4.5.4 Middle East & Africa
Note: Emerging Market Opportunity Scorecards will be included based on relevance and strategic importance. Regions listed are indicative and may vary depending on data availability and market dynamics.
Chapter 5. North America Solid Tire Import-Export Analysis & Trade Flows
- 5.1 Global Trade Overview
- 5.1.1 Global Export Value by Country (2024)
- 5.1.2 Global Export Volume by Country (2024)
- 5.1.3 Global Import Value by Country (2024)
- 5.1.4 Global Import Volume by Country (2024)
- 5.1.5 Net Trade Balance by Country (2024)
- 5.2 Export Analysis – Segment
- 5.2.1 Type 1 (HS Code)
- 5.2.2 Type 2 (HS Code)
- 5.2.3 Type 3 (HS Code)
- 5.2.4 Type 4 (HS Code)
- 5.2.5 Type 5 (HS Code)
- 5.3 Import Analysis – Segment
- 5.3.1 Type 1 (HS Code)
- 5.3.2 Type 2 (HS Code)
- 5.3.3 Type 3 (HS Code)
- 5.3.4 Type 4 (HS Code)
- 5.3.5 Type 5 (HS Code)
- 5.4 Average Unit Trade Prices
- 5.4.1 Average Export Price – Segment & Country
- 5.4.2 Average Import Price – Segment & Source Country
- 5.4.3 Price Trends (2024)
- 5.5 Key Trade Route Analysis
- 5.5.1 Trade Route 1
- 5.5.2 Trade Route 2
- 5.5.3 Trade Route 3
- 5.5.4 Trade Route 4
- 5.5.5 Trade Route 5
- 5.6 Trade Policy Impact Assessment
- 5.6.1 US Anti-Dumping & Section 301 Tariffs
- 5.6.2 EU Customs Union Impact
- 5.6.3 Major Free Trade Agreements
- 5.6.4 USMCA Rules of Origin
Note: Trade policy analysis will be included only where relevant to the North America Solid Tire market.
Chapter 6. Competitive Landscape & Company Benchmarking
- 6.1 North America Solid Tire Market Concentration & Structure
- 6.1.1 Herfindahl-Hirschman Index (HHI) – vs. 2024
- 6.1.2 Tier 1, Tier 2 & Tier 3 Market Structure
- 6.1.3 Global, Regional & Local Player Dynamics
- 6.2 North America Solid Tire Market Share Analysis – 2024
- 6.2.1 Global Revenue Share by Company
- 6.2.2 Global Volume Share by Company
- 6.2.3 Regional Revenue Share
- 6.2.4 Market Share Evolution ( vs. 2024)
- 6.2.5 OEM Segment Share by Company
- 6.2.6 Replacement Segment Share by Company
- 6.3 Production/Delivery Capacity & Facility Analysis
- 6.3.1 Global Installed Capacity
- 6.3.2 Capacity Utilization Rates
- 6.3.3 Production/Output Volume
- 6.3.4 Facility Locations & Capacity Map
- 6.3.5 Planned Capacity Additions
- 6.4 North America Solid Tire Competitive Benchmarking Matrix
- 6.4.1 Revenue, Volume, CAGR & Profitability Comparison
- 6.4.2 Channel Revenue Mix
- 6.4.3 Geographic Revenue Exposure
- 6.4.4 R&D Intensity
- 6.4.5 Sustainability Maturity
- 6.5 Strategic Developments in North America Solid Tire (Last 24 Months)
- 6.5.1 Mergers, Acquisitions & Divestments
- 6.5.2 New North America Solid Tire Launches
- 6.5.3 Facility Expansions
- 6.5.4 Strategic Alliances, Joint Ventures & Partnerships
- 6.5.5 Distribution Expansion & Market Entry
- 6.5.6 Sustainability & ESG Initiatives
- 6.6 Competitive Strategy Mapping
- 6.6.1 Leader, Challenger, Follower & Niche Classification
- 6.6.2 Pricing Strategy Comparison
- 6.6.3 Channel Strategy Matrix
Note: Strategic developments are included based on their materiality and the availability of reliable information.
Chapter 7. Global North America Solid Tire Market – By Distribution Channel
- 7.1 Segment Overview
- 7.1.1 Volume & Revenue Split by Channel (2024 & 2032)
- 7.1.2 Channel Mix Evolution (2024-2032)
Chapter 8. Regional Market Analysis – Global Overview
- 8.1 Global Regional Overview
- 8.1.1 Regional Volume Share
- 8.1.2 Regional Revenue Share
- 8.1.3 Regional Volume by Region
- 8.1.4 Regional Revenue by Region
- 8.1.5 Regional Forecast Through 2032
- 8.2 Cross-Regional Segment Analysis
- 8.2.1 By Distribution Channel
- 8.2.2 By Brand/Price Tier
Chapter 9. North America North America Solid Tire Market
- 9.1 United States
- 9.2 Canada
- 9.3 Mexico
Chapter 10. Europe North America Solid Tire Market
- 10.1 Germany
- 10.2 France
- 10.3 Italy
- 10.4 United Kingdom
- 10.5 Spain
- 10.6 Poland
- 10.7 Russia
- 10.8 Netherlands
- 10.9 Belgium
- 10.10 Sweden
- 10.11 Denmark
- 10.12 Norway
- 10.13 Rest of Europe
Chapter 11. Asia Pacific North America Solid Tire Market
- 11.1 China
- 11.2 India
- 11.3 Japan
- 11.4 South Korea
- 11.5 Thailand
- 11.6 Indonesia
- 11.7 Vietnam
- 11.8 Malaysia
- 11.9 Australia
- 11.10 Rest of Asia Pacific
Chapter 12. Latin America North America Solid Tire Market
- 12.1 Brazil
- 12.2 Argentina
- 12.3 Colombia
- 12.4 Chile
- 12.5 Rest of Latin America
Chapter 13. Middle East North America Solid Tire Market
- 13.1 Saudi Arabia
- 13.2 United Arab Emirates
- 13.3 Turkey
- 13.4 Israel
- 13.5 Iran
- 13.6 Rest of the Middle East
Chapter 14. Africa North America Solid Tire Market
- 14.1 South Africa
- 14.2 Egypt
- 14.3 Nigeria
- 14.4 Morocco
- 14.5 Rest of Africa
Chapter 15. North America Solid Tire Company Profiles
- 15.1 [Company 01]
- 15.1.1 Company Overview
- 15.1.2 Key Management Personnel
- 15.1.3 Products & Services Portfolio
- 15.1.4 Financial Performance
- 15.1.5 Key Market Focus & Geographic Presence
- 15.1.6 Recent Developments & Strategic Initiatives
Note: The company profile list is preliminary and may change based on research findings, market developments, data availability, and client requirements.
Chapter 16. Appendices
- Appendix A – List of Abbreviations & Acronyms
- Appendix B – Industry Classification Code Reference – Full Series
- Appendix C – Production & Capacity Data Tables
- Appendix D – End-Use & Demand Base Tables
- Appendix E – Consumption & Replacement Rate Assumptions
- Appendix F – ASP Reference Tables
- Appendix G – Manufacturing & Facility Database
- Appendix H – Import-Export Data Tables
- Appendix I – Regulatory Summary Tables
- Appendix J – Primary Research Participant List (Anonymized)
- Appendix K – Primary Research Questionnaire Framework
- Appendix L – Data Sources & Bibliography
- Appendix M – Market Size Divergence & Source Comparison
Chapter 17. Research Methodology
- 17.1 Research Framework & Philosophy
- 17.2 Secondary Research – Sources, Hierarchy & Data Extraction
- 17.3 Data Modeling – Bottom-Up & Top-Down Market Sizing
- 17.4 Primary Research – Stakeholder Framework, LOI & Sample Sizes
- 17.5 Forecast Methodology – Regression, Scenario & Sensitivity Analysis
- 17.6 Quality Control – Four-Layer Validation Framework
- 17.7 Limitations & Standard Assumptions
- 17.8 Disclaimer
