Table of Content
CHAPTER NO. 1 : INTRODUCTION………………………………………………………………….. 21
1.1.1. Report Description ………………………………………………………………………………………….. 21
Purpose of the Report………………………………………………………………………………………. 21
USP & Key Offerings…………………………………………………………………………………………. 21
1.1.2. Key Benefits for Stakeholders……………………………………………………………………………. 21
1.1.3. Target Audience ……………………………………………………………………………………………… 22
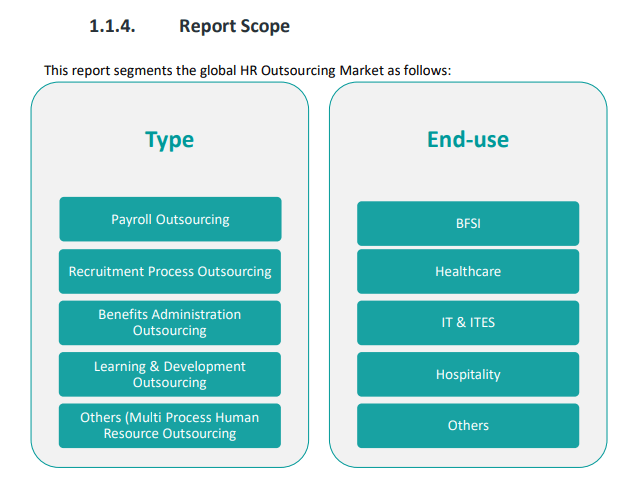
1.1.4. Report Scope 22
CHAPTER NO. 2 : EXECUTIVE SUMMARY ………………………………………………………… 23
2.1. HR Outsourcing Market Snapshot ……………………………………………………………………… 23
2.1.1. Global HR Outsourcing Market, 2018 – 2032 (USD Million)…………………………………….. 24
CHAPTER NO. 3 : HR OUTSOURCING MARKET – INDUSTRY ANALYSIS ………………… 25
3.1. Introduction 25
3.2. Market Drivers………………………………………………………………………………………………… 27
3.2.1. Cost Reduction and Operational Efficiency………………………………………………………….. 27
3.2.2. Technological Advancements in HR Solutions ……………………………………………………… 27
3.2.3. Globalization and Workforce Diversity ……………………………………………………………….. 29
3.3. Market Restraints……………………………………………………………………………………………. 31
3.3.1. Data Security and Privacy Concerns……………………………………………………………………. 31
3.3.2. Loss of Control Over HR Processes……………………………………………………………………… 31
3.3.3. Hidden Costs and Long-Term Contracts………………………………………………………………. 31
3.4. Market Opportunities………………………………………………………………………………………. 33
3.4.1. Market Opportunity Analysis ……………………………………………………………………………. 33
3.5. Porter’s Five Forces Analysis……………………………………………………………………………… 35
CHAPTER NO. 4 : ANALYSIS COMPETITIVE LANDSCAPE…………………………………….. 36
4.1. Company Market Share Analysis – 2024……………………………………………………………… 36
4.1.1. Global HR Outsourcing Market: Company Market Share, by Revenue, 2024…………….. 36
4.1.2. Global HR Outsourcing Market: Top 3 Company Market Share, by Revenue, 2024 ……. 37
4.2. Global HR Outsourcing Market Company Revenue Market Share, 2024 ………………….. 38
4.3. Strategic Development…………………………………………………………………………………….. 39
4.4. Key Players Product Matrix ………………………………………………………………………………. 42
CHAPTER NO. 5 : PESTEL………………………………………………………………………………. 44
5.1. PESTEL 44
5.1.1. Political Factors ………………………………………………………………………………………………. 44
5.1.2. Economic Factors…………………………………………………………………………………………….. 44
5.1.3. Social Factors 45
5.1.4. Technological Factors ………………………………………………………………………………………. 45
5.1.5. Environmental Factors……………………………………………………………………………………… 45
5.1.6. Legal Factors 46
CHAPTER NO. 6 : HR OUTSOURCING MARKET – BY TYPE SEGMENT ANALYSIS …….. 47
6.1. HR Outsourcing Market Overview, by Type Segment……………………………………………. 47
6.1.1. HR Outsourcing Market Revenue Share, By Type, 2023 & 2032 ……………………………… 47
6.1.2. HR Outsourcing Market Attractiveness Analysis, By Type ……………………………………… 49
6.1.3. Incremental Revenue Growth Opportunity, by Type, 2024 – 2032…………………………… 50
6.1.4. HR Outsourcing Market Revenue, By Type, 2018, 2023, 2027 & 2032 ……………………… 51
6.2. Payroll Outsourcing …………………………………………………………………………………………. 52
6.3. Recruitment Process Outsourcing………………………………………………………………………. 53
6.4. Benefits Administration Outsourcing …………………………………………………………………. 54
6.5. Learning Services Outsourcing…………………………………………………………………………… 55
6.6. Others 56
CHAPTER NO. 7 : HR OUTSOURCING MARKET – BY END-USE SEGMENT ANALYSIS.. 57
7.1. HR Outsourcing Market Overview, by End-use Segment……………………………………….. 57
7.1.1. HR Outsourcing Market Revenue Share, By End-use, 2023 & 2032 …………………………. 57
7.1.2. HR Outsourcing Market Attractiveness Analysis, By End-use …………………………………. 59
7.1.3. Incremental Revenue Growth Opportunity, by End-use, 2024 – 2032………………………. 60
7.1.4. HR Outsourcing Market Revenue, By End-use, 2018, 2023, 2027 & 2032 …………………. 61
7.2. BFSI 62
7.3. Healthcare 63
7.4. IT & ITES 64
7.5. Hospitality 65
7.6. Others 66
CHAPTER NO. 8 : HR OUTSOURCING MARKET – REGIONAL ANALYSIS ………………… 67
8.1. HR Outsourcing Market Revenue Share, By Region, 2024 & 2032 …………………………… 67
8.2. HR Outsourcing Market Attractiveness Analysis, By Region …………………………………… 68
8.3. Incremental Revenue Growth Opportunity, by Region, 2024 – 2032 ……………………….. 69
8.4. HR Outsourcing Market Revenue, By Region, 2018, 2023, 2027 & 2032 …………………… 70
8.5. Region 71
8.5.1. Global HR Outsourcing Market Revenue, By Region, 2018 – 2024 (USD Million) ……….. 71
8.5.2. Global HR Outsourcing Market Revenue, By Region, 2025 – 2032 (USD Million) ……….. 71
CHAPTER NO. 9 : HR OUTSOURCING MARKET – NORTH AMERICA …………………….. 72
9.1. North America72
9.1.1. North America HR Outsourcing Market Revenue, By Country, 2018 – 2024 (USD Million)
73
9.1.2. North America HR Outsourcing Market Revenue, By Type, 2018 – 2024 (USD Million).. 74
9.1.3. North America HR Outsourcing Market Revenue, By End-use, 2018 – 2024 (USD Million)
75
9.2. U.S. 76
9.2.1. U.S. HR Outsourcing Market Revenue, By Type, 2018 – 2024 (USD Million)………………. 76
9.2.2. U.S. HR Outsourcing Market Revenue, By End-use, 2018 – 2024 (USD Million)………….. 77
9.3. Canada 78
9.3.1. Canada HR Outsourcing Market Revenue, By Type, 2018 – 2024 (USD Million) …………. 78
9.3.2. Canada HR Outsourcing Market Revenue, By End-use, 2018 – 2024 (USD Million) …….. 79
9.4. Mexico 80
9.4.1. Mexico HR Outsourcing Market Revenue, By Type, 2018 – 2024 (USD Million) …………. 80
9.4.2. Mexico HR Outsourcing Market Revenue, By End-use, 2018 – 2024 (USD Million) …….. 81
CHAPTER NO. 10 : HR OUTSOURCING MARKET – EUROPE………………………………….. 82
10.1. Europe 82
10.1.1.Europe HR Outsourcing Market Revenue, By Country, 2018 – 2024 (USD Million)……… 83
10.1.2.Europe HR Outsourcing Market Revenue, By Type, 2018 – 2024 (USD Million)………….. 85
10.1.3.Europe HR Outsourcing Market Revenue, By End-use, 2018 – 2024 (USD Million)……… 87
10.2. UK 88
10.2.1.UK HR Outsourcing Market Revenue, By Type, 2018 – 2023 (USD Million) ……………….. 88
10.2.2.UK HR Outsourcing Market Revenue, By End-use, 2018 – 2023 (USD Million) …………… 89
10.3. France 90
10.3.1.France HR Outsourcing Market Revenue, By Type, 2018 – 2023 (USD Million) ………….. 90
10.3.2.France HR Outsourcing Market Revenue, By End-use, 2018 – 2023 (USD Million) ……… 91
10.4. Germany 92
10.4.1.Germany HR Outsourcing Market Revenue, By Type, 2018 – 2023 (USD Million) ………. 92
10.4.2.Germany HR Outsourcing Market Revenue, By End-use, 2018 – 2023 (USD Million) ….. 93
8 | P a g e
GLOBAL HR OUTSOURCING MARKET, 2018 – 2032
10.5. Italy 94
10.5.1.Italy HR Outsourcing Market Revenue, By Type, 2018 – 2023 (USD Million)……………… 94
10.5.2.Italy HR Outsourcing Market Revenue, By End-use, 2018 – 2023 (USD Million)…………. 95
10.6. Spain 96
10.6.1.Spain HR Outsourcing Market Revenue, By Type, 2018 – 2023 (USD Million) ……………. 96
10.6.2.Spain HR Outsourcing Market Revenue, By End-use, 2018 – 2023 (USD Million) ……….. 97
10.7. Russia 98
10.7.1.Russia HR Outsourcing Market Revenue, By Type, 2018 – 2023 (USD Million)…………… 98
10.7.2.Russia HR Outsourcing Market Revenue, By End-use, 2018 – 2023 (USD Million)………. 99
10.8. Belgium 100
10.8.1.Belgium HR Outsourcing Market Revenue, By Type, 2018 – 2023 (USD Million)………. 100
10.8.2.Belgium HR Outsourcing Market Revenue, By End-use, 2018 – 2023 (USD Million) ….. 101
10.9. Netherland 102
10.9.1.Netherland HR Outsourcing Market Revenue, By Type, 2018 – 2023 (USD Million)….. 102
10.9.2.Netherland HR Outsourcing Market Revenue, By End-use, 2018 – 2023 (USD Million) 103
10.10. Austria 104
10.10.1. Austria HR Outsourcing Market Revenue, By Type, 2018 – 2023 (USD
Million) 104
10.10.2. Austria HR Outsourcing Market Revenue, By End-use, 2018 – 2023 (USD
Million) 105
10.11. Sweden 106
10.11.1. Sweden HR Outsourcing Market Revenue, By Type, 2018 – 2023 (USD
Million) 106
10.11.2. Sweden HR Outsourcing Market Revenue, By End-use, 2018 – 2023 (USD
Million) 107
10.12. Poland 108
10.12.1. Poland HR Outsourcing Market Revenue, By Type, 2018 – 2023 (USD
Million) 108
10.12.2. Poland HR Outsourcing Market Revenue, By End-use, 2018 – 2023 (USD
Million) 109
10.13. Denmark 110
10.13.1. Denmark HR Outsourcing Market Revenue, By Type, 2018 – 2023 (USD
Million) 110
10.13.2. Denmark HR Outsourcing Market Revenue, By End-use, 2018 – 2023 (USD
Million) 111
10.14. Switzerland 112
10.14.1. Switzerland HR Outsourcing Market Revenue, By Type, 2018 – 2023 (USD
Million) 112
9 | P a g e
GLOBAL HR OUTSOURCING MARKET, 2018 – 2032
10.14.2. Switzerland HR Outsourcing Market Revenue, By End-use, 2018 – 2023
(USD Million) 113
10.15. Rest of Europe114
10.15.1. Rest of Europe HR Outsourcing Market Revenue, By Type, 2018 – 2023
(USD Million) 114
10.15.2. Rest of Europe HR Outsourcing Market Revenue, By End-use, 2018 – 2023
(USD Million) 115
CHAPTER NO. 11 : HR OUTSOURCING MARKET – ASIA PACIFIC …………………………. 116
11.1. Asia Pacific 116
11.1.1.Asia Pacific HR Outsourcing Market Revenue, By Country, 2018 – 2023 (USD Million) 117
11.1.2.Asia Pacific HR Outsourcing Market Revenue, By Type, 2018 – 2023 (USD Million) ….. 118
11.1.3.Asia Pacific HR Outsourcing Market Revenue, By End-use, 2018 – 2023 (USD Million) 119
11.2. China 120
11.2.1.China HR Outsourcing Market Revenue, By Type, 2018 – 2023 (USD Million)………….. 120
11.2.2.China HR Outsourcing Market Revenue, By End-use, 2018 – 2023 (USD Million)……… 121
11.3. Japan 122
11.3.1.Japan HR Outsourcing Market Revenue, By Type, 2018 – 2023 (USD Million)………….. 122
11.3.2.Japan HR Outsourcing Market Revenue, By End-use, 2018 – 2023 (USD Million)……… 123
11.4. South Korea 124
11.4.1.South Korea HR Outsourcing Market Revenue, By Type, 2018 – 2023 (USD Million)…. 124
11.4.2.South Korea HR Outsourcing Market Revenue, By End-use, 2018 – 2023 (USD Million)125
11.5. India 126
11.5.1.India HR Outsourcing Market Revenue, By Type, 2018 – 2023 (USD Million)…………… 126
11.5.2.India HR Outsourcing Market Revenue, By End-use, 2018 – 2023 (USD Million)………. 127
11.6. Australia 128
11.6.1.Australia HR Outsourcing Market Revenue, By Type, 2018 – 2023 (USD Million)……… 128
11.6.2.Australia HR Outsourcing Market Revenue, By End-use, 2018 – 2023 (USD Million)…. 129
11.7. Thailand 130
11.7.1.Thailand HR Outsourcing Market Revenue, By Type, 2018 – 2023 (USD Million) ……… 130
11.7.2.Thailand HR Outsourcing Market Revenue, By End-use, 2018 – 2023 (USD Million) …. 131
11.8. Indonesia 132
11.8.1.Indonesia HR Outsourcing Market Revenue, By Type, 2018 – 2023 (USD Million) ……. 132
11.8.2.Indonesia HR Outsourcing Market Revenue, By End-use, 2018 – 2023 (USD Million)… 133
11.9. Vietnam 134
11.9.1.Vietnam HR Outsourcing Market Revenue, By Type, 2018 – 2023 (USD Million)………. 134
11.9.2.Vietnam HR Outsourcing Market Revenue, By End-use, 2018 – 2023 (USD Million)….. 135
10 | P a g e
GLOBAL HR OUTSOURCING MARKET, 2018 – 2032
11.10. Malaysia 136
11.10.1. Malaysia HR Outsourcing Market Revenue, By Type, 2018 – 2023 (USD
Million) 136
11.10.2. Malaysia HR Outsourcing Market Revenue, By End-use, 2018 – 2023 (USD
Million) 137
11.11. Philippines 138
11.11.1. Philippines HR Outsourcing Market Revenue, By Type, 2018 – 2023 (USD
Million) 138
11.11.2. Philippines HR Outsourcing Market Revenue, By End-use, 2018 – 2023
(USD Million) 139
11.12. Taiwan 140
11.12.1. Taiwan HR Outsourcing Market Revenue, By Type, 2018 – 2023 (USD
Million) 140
11.12.2. Taiwan HR Outsourcing Market Revenue, By End-use, 2018 – 2023 (USD
Million) 141
11.13. Rest of Asia Pacific…………………………………………………………………………………………. 142
11.13.1. Rest of Asia Pacific HR Outsourcing Market Revenue, By Type, 2018 – 2023
(USD Million) 142
11.13.2. Rest of Asia Pacific HR Outsourcing Market Revenue, By End-use, 2018 –
2023 (USD Million)…………………………………………………………………………………………. 143
CHAPTER NO. 12 : HR OUTSOURCING MARKET – LATIN AMERICA……………………… 144
12.1. Latin America 144
12.1.1.Latin America HR Outsourcing Market Revenue, By Country, 2018 – 2023 (USD Million)
145
12.1.2.Latin America HR Outsourcing Market Revenue, By Type, 2018 – 2023 (USD Million) . 146
12.1.3.Latin America HR Outsourcing Market Revenue, By End-use, 2018 – 2023 (USD Million)
147
12.2. Brazil 148
12.2.1.Brazil HR Outsourcing Market Revenue, By Type, 2018 – 2023 (USD Million) ………….. 148
12.2.2.Brazil HR Outsourcing Market Revenue, By End-use, 2018 – 2023 (USD Million) ……… 149
12.3. Argentina 150
12.3.1.Argentina HR Outsourcing Market Revenue, By Type, 2018 – 2023 (USD Million) ……. 150
12.3.2.Argentina HR Outsourcing Market Revenue, By End-use, 2018 – 2023 (USD Million) .. 151
12.4. Peru 152
12.4.1.Peru HR Outsourcing Market Revenue, By Type, 2018 – 2023 (USD Million)……………. 152
12.4.2.Peru HR Outsourcing Market Revenue, By End-use, 2018 – 2023 (USD Million)……….. 153
12.5. Chile 154
12.5.1.Chile HR Outsourcing Market Revenue, By Type, 2018 – 2023 (USD Million) …………… 154
11 | P a g e
GLOBAL HR OUTSOURCING MARKET, 2018 – 2032
12.5.2.Chile HR Outsourcing Market Revenue, By End-use, 2018 – 2023 (USD Million) ………. 155
12.6. Colombia 156
12.6.1.Colombia HR Outsourcing Market Revenue, By Type, 2018 – 2023 (USD Million)…….. 156
12.6.2.Colombia HR Outsourcing Market Revenue, By End-use, 2018 – 2023 (USD Million)… 157
12.7. Rest of Latin America……………………………………………………………………………………… 158
12.7.1.Rest of Latin America HR Outsourcing Market Revenue, By Type, 2018 – 2023 (USD
Million) 158
12.7.2.Rest of Latin America HR Outsourcing Market Revenue, By End-use, 2018 – 2023 (USD
Million) 159
CHAPTER NO. 13 : HR OUTSOURCING MARKET – MIDDLE EAST…………………………. 160
13.1. Middle East 160
13.1.1.Middle East HR Outsourcing Market Revenue, By Country, 2018 – 2023 (USD Million) 161
13.1.2.Middle East HR Outsourcing Market Revenue, By Type, 2018 – 2023 (USD Million) …. 162
13.1.3.Middle East HR Outsourcing Market Revenue, By End-use, 2018 – 2023 (USD Million) 163
13.2. UAE 164
13.2.1.UAE HR Outsourcing Market Revenue, By Type, 2018 – 2023 (USD Million) ……………. 164
13.2.2.UAE HR Outsourcing Market Revenue, By End-use, 2018 – 2023 (USD Million) ……….. 165
13.3. KSA 166
13.3.1.KSA HR Outsourcing Market Revenue, By Type, 2018 – 2023 (USD Million)…………….. 166
13.3.2.KSA HR Outsourcing Market Revenue, By End-use, 2018 – 2023 (USD Million)………… 167
13.4. Israel 168
13.4.1.Israel HR Outsourcing Market Revenue, By Type, 2018 – 2023 (USD Million) ………….. 168
13.4.2.Israel HR Outsourcing Market Revenue, By End-use, 2018 – 2023 (USD Million) ……… 169
13.5. Turkey 170
13.5.1.Turkey HR Outsourcing Market Revenue, By Type, 2018 – 2023 (USD Million) ………… 170
13.5.2.Turkey HR Outsourcing Market Revenue, By End-use, 2018 – 2023 (USD Million) ……. 171
13.6. Iran 172
13.6.1.Iran HR Outsourcing Market Revenue, By Type, 2018 – 2023 (USD Million)…………….. 172
13.6.2.Iran HR Outsourcing Market Revenue, By End-use, 2018 – 2023 (USD Million)………… 173
13.7. Rest of Middle East………………………………………………………………………………………… 174
13.7.1.Rest of Middle East HR Outsourcing Market Revenue, By Type, 2018 – 2023 (USD Million)
174
13.7.2.Rest of Middle East HR Outsourcing Market Revenue, By End-use, 2018 – 2023 (USD
Million) 175
CHAPTER NO. 14 : HR OUTSOURCING MARKET – AFRICA …………………………………. 176
12 | P a g e
GLOBAL HR OUTSOURCING MARKET, 2018 – 2032
14.1. Africa 176
14.1.1.Africa HR Outsourcing Market Revenue, By Country, 2018 – 2023 (USD Million)……… 177
14.1.2.Africa HR Outsourcing Market Revenue, By Type, 2018 – 2023 (USD Million)………….. 178
14.1.3.Africa HR Outsourcing Market Revenue, By End-use, 2018 – 2023 (USD Million)……… 179
14.2. South Africa 180
14.2.1.South Africa HR Outsourcing Market Revenue, By Type, 2018 – 2023 (USD Million)…. 180
14.2.2.South Africa HR Outsourcing Market Revenue, By End-use, 2018 – 2023 (USD Million)181
14.3. Egypt 182
14.3.1.Egypt HR Outsourcing Market Revenue, By Type, 2018 – 2023 (USD Million) ………….. 182
14.3.2.Egypt HR Outsourcing Market Revenue, By End-use, 2018 – 2023 (USD Million) ……… 183
14.4. Nigeria 184
14.4.1.Nigeria HR Outsourcing Market Revenue, By Type, 2018 – 2023 (USD Million)………… 184
14.4.2.Nigeria HR Outsourcing Market Revenue, By End-use, 2018 – 2023 (USD Million)……. 185
14.5. Algeria 186
14.5.1.Algeria HR Outsourcing Market Revenue, By Type, 2018 – 2023 (USD Million)………… 186
14.5.2.Algeria HR Outsourcing Market Revenue, By End-use, 2018 – 2023 (USD Million)……. 187
14.6. Morocco 188
14.6.1.Morocco HR Outsourcing Market Revenue, By Type, 2018 – 2023 (USD Million)……… 188
14.6.2.Morocco HR Outsourcing Market Revenue, By End-use, 2018 – 2023 (USD Million)…. 189
14.7. Rest of Africa 190
14.7.1.Rest of Africa HR Outsourcing Market Revenue, By Type, 2018 – 2023 (USD Million).. 190
14.7.2.Rest of Africa HR Outsourcing Market Revenue, By End-use, 2018 – 2023 (USD Million)
191
CHAPTER NO. 15 : COMPANY PROFILES …………………………………………………………. 192
15.1. HP Company 192
15.1.1.Company Overview ……………………………………………………………………………………….. 192
15.1.2.Service Portfolio ……………………………………………………………………………………………. 193
15.1.3.Financial Overview ………………………………………………………………………………………… 193
15.2. Genesys 194
15.2.1.Company Overview ……………………………………………………………………………………….. 194
15.2.2.Service Portfolio ……………………………………………………………………………………………. 195
15.2.3.Financial Overview ………………………………………………………………………………………… 195
15.3. Aon Hewitt LLC ……………………………………………………………………………………………… 196
15.3.1.Company Overview ……………………………………………………………………………………….. 196
15.3.2.Service Portfolio ……………………………………………………………………………………………. 197
13 | P a g e
GLOBAL HR OUTSOURCING MARKET, 2018 – 2032
15.3.3.Financial Overview ………………………………………………………………………………………… 197
15.4. Infosys 198
15.4.1.Company Overview ……………………………………………………………………………………….. 198
15.4.2.Service Portfolio ……………………………………………………………………………………………. 199
15.4.3.Financial Overview ………………………………………………………………………………………… 199
15.5. Accenture 200
15.5.1.Company Overview ……………………………………………………………………………………….. 200
15.5.2.Service Portfolio ……………………………………………………………………………………………. 201
15.5.3.Financial Overview ………………………………………………………………………………………… 201
15.6. IBM 202
15.6.1.Company Overview ……………………………………………………………………………………….. 202
15.6.2.Service Portfolio ……………………………………………………………………………………………. 203
15.6.3.Financial Overview ………………………………………………………………………………………… 203
15.7. Ultimate Software Group, Inc………………………………………………………………………….. 204
15.7.1.Company Overview ……………………………………………………………………………………….. 204
15.7.2.Service Portfolio ……………………………………………………………………………………………. 205
15.7.3.Financial Overview ………………………………………………………………………………………… 205
15.8. Mercer, LLC 206
15.8.1.Company Overview ……………………………………………………………………………………….. 206
15.8.2.Service Portfolio ……………………………………………………………………………………………. 207
15.8.3.Financial Overview ………………………………………………………………………………………… 207
15.9. Adecco Group 208
15.9.1.Company Overview ……………………………………………………………………………………….. 208
15.9.2.Service Portfolio ……………………………………………………………………………………………. 209
15.9.3.Financial Overview ………………………………………………………………………………………… 209
15.10. Conduent Incorporated ………………………………………………………………………………….. 210
15.10.1. Company Overview…………………………………………………………………… 210
15.10.2. Products Portfolio …………………………………………………………………….. 211
15.10.3. Financial Overview……………………………………………………………………. 211
15.11. ADP 212
15.11.1. Company Overview…………………………………………………………………… 212
15.11.2. Products Portfolio …………………………………………………………………….. 213
15.11.3. Financial Overview……………………………………………………………………. 214
14 | P a g e
GLOBAL HR OUTSOURCING MARKET, 2018 – 2032
List of Figures
FIG NO. 1. Global HR Outsourcing Market Revenue, 2018 – 2032 (USD Million)……………………………… 24
FIG NO. 2. Porter’s Five Forces Analysis for Global HR Outsourcing Market ………………………………….. 35
FIG NO. 3. Company Share Analysis, 2024 ………………………………………………………………………………. 36
FIG NO. 4. Company Share Analysis, 2024 ………………………………………………………………………………. 37
FIG NO. 5. HR Outsourcing Market – Company Revenue Market Share, 2024 ……………………………….. 38
FIG NO. 6. HR Outsourcing Market Revenue Share, By Type, 2023 & 2032……………………………………. 47
FIG NO. 7. Market Attractiveness Analysis, By Type………………………………………………………………….. 49
FIG NO. 8. Incremental Revenue Growth Opportunity by Type, 2024 – 2032…………………………………. 50
FIG NO. 9. HR Outsourcing Market Revenue, By Type, 2018, 2023, 2027 & 2032 …………………………… 51
FIG NO. 10. Global HR Outsourcing Market for Payroll Outsourcing, Revenue (USD Million) 2018 –
2032 …………………………………………………………………………………………………………………. 52
FIG NO. 11. Global HR Outsourcing Market for Recruitment Process Outsourcing, Revenue (USD
Million) 2018 – 2032…………………………………………………………………………………………….. 53
FIG NO. 12. Global HR Outsourcing Market for Benefits Administration Outsourcing, Revenue (USD
Million) 2018 – 2032…………………………………………………………………………………………….. 54
FIG NO. 13. Global HR Outsourcing Market for Learning Services Outsourcing, Revenue (USD Million)
2018 – 2032………………………………………………………………………………………………………… 55
FIG NO. 14. Global HR Outsourcing Market for Others, Revenue (USD Million) 2018 – 2032………………. 56
FIG NO. 15. HR Outsourcing Market Revenue Share, By End-use, 2023 & 2032……………………………….. 57
FIG NO. 16. Market Attractiveness Analysis, By End-use……………………………………………………………… 59
FIG NO. 17. Incremental Revenue Growth Opportunity by End-use, 2024 – 2032…………………………….. 60
FIG NO. 18. HR Outsourcing Market Revenue, By End-use, 2018, 2023, 2027 & 2032 ………………………. 61
FIG NO. 19. Global HR Outsourcing Market for BFSI, Revenue (USD Million) 2018 – 2032………………….. 62
FIG NO. 20. Global HR Outsourcing Market for Healthcare, Revenue (USD Million) 2018 – 2032…………. 63
FIG NO. 21. Global HR Outsourcing Market for IT & ITES, Revenue (USD Million) 2018 – 2032……………. 64
FIG NO. 22. Global HR Outsourcing Market for Hospitality, Revenue (USD Million) 2018 – 2032…………. 65
FIG NO. 23. Global HR Outsourcing Market for Others, Revenue (USD Million) 2018 – 2032………………. 66
FIG NO. 24. HR Outsourcing Market Revenue Share, By Region, 2024 & 2032…………………………………. 67
FIG NO. 25. Market Attractiveness Analysis, By Region……………………………………………………………….. 68
FIG NO. 26. Incremental Revenue Growth Opportunity by Region, 2024 – 2032………………………………. 69
FIG NO. 27. HR Outsourcing Market Revenue, By Region, 2018, 2023, 2027 & 2032 ………………………… 70
FIG NO. 28. North America HR Outsourcing Market Revenue, 2018 – 2032 (USD Million) …………………. 72
FIG NO. 29. Europe HR Outsourcing Market Revenue, 2018 – 2032 (USD Million)……………………………. 82
FIG NO. 30. Asia Pacific HR Outsourcing Market Revenue, 2018 – 2032 (USD Million)………………………116
FIG NO. 31. Latin America HR Outsourcing Market Revenue, 2018 – 2032 (USD Million)…………………..144
FIG NO. 32. Middle East HR Outsourcing Market Revenue, 2018 – 2032 (USD Million)……………………..160
FIG NO. 33. Africa HR Outsourcing Market Revenue, 2018 – 2032 (USD Million)……………………………..176
15 | P a g e
GLOBAL HR OUTSOURCING MARKET, 2018 – 2032
List of Tables
TABLE NO. 1. : Global HR Outsourcing Market: Snapshot………………………………………………………………… 23
TABLE NO. 2. : Drivers for the HR Outsourcing Market: Impact Analysis…………………………………………….. 27
TABLE NO. 3. : Restraints for the HR Outsourcing Market: Impact Analysis ………………………………………… 31
TABLE NO. 4. : Global HR Outsourcing Market Revenue, By Region, 2018 – 2024 (USD Million)………………. 71
TABLE NO. 5. : Global HR Outsourcing Market Revenue, By Region, 2025 – 2032 (USD Million)………………. 71
TABLE NO. 6. : North America HR Outsourcing Market Revenue, By Country, 2018 – 2024 (USD Million)…. 73
TABLE NO. 7. : North America HR Outsourcing Market Revenue, By Country, 2025 – 2032 (USD Million)…. 73
TABLE NO. 8. : North America HR Outsourcing Market Revenue, By Type, 2018 – 2024 (USD Million)……… 74
TABLE NO. 9. : North America HR Outsourcing Market Revenue, By Type, 2025 – 2032 (USD Million)……… 74
TABLE NO. 10. : North America HR Outsourcing Market Revenue, By End-use, 2018 – 2024 (USD Million)…. 75
TABLE NO. 11. : North America HR Outsourcing Market Revenue, By End-use, 2025 – 2032 (USD Million)…. 75
TABLE NO. 12. : U.S. HR Outsourcing Market Revenue, By Type, 2018 – 2024 (USD Million)…………………….. 76
TABLE NO. 13. : U.S. HR Outsourcing Market Revenue, By Type, 2025 – 2032 (USD Million)…………………….. 76
TABLE NO. 14. : U.S. HR Outsourcing Market Revenue, By End-use, 2018 – 2024 (USD Million)………………… 77
TABLE NO. 15. : U.S. HR Outsourcing Market Revenue, By End-use, 2025 – 2032 (USD Million)………………… 77
TABLE NO. 16. : Canada HR Outsourcing Market Revenue, By Type, 2018 – 2024 (USD Million)……………….. 78
TABLE NO. 17. : Canada HR Outsourcing Market Revenue, By Type, 2025 – 2032 (USD Million)……………….. 78
TABLE NO. 18. : Canada HR Outsourcing Market Revenue, By End-use, 2018 – 2024 (USD Million) …………… 79
TABLE NO. 19. : Canada HR Outsourcing Market Revenue, By End-use, 2025 – 2032 (USD Million) …………… 79
TABLE NO. 20. : Mexico HR Outsourcing Market Revenue, By Type, 2018 – 2024 (USD Million) ……………….. 80
TABLE NO. 21. : Mexico HR Outsourcing Market Revenue, By Type, 2025 – 2032 (USD Million) ……………….. 80
TABLE NO. 22. : Mexico HR Outsourcing Market Revenue, By End-use, 2018 – 2024 (USD Million) …………… 81
TABLE NO. 23. : Mexico HR Outsourcing Market Revenue, By End-use, 2025 – 2032 (USD Million) …………… 81
TABLE NO. 24. : Europe HR Outsourcing Market Revenue, By Country, 2018 – 2024 (USD Million)…………… 83
TABLE NO. 25. : Europe HR Outsourcing Market Revenue, By Country, 2025 – 2032 (USD Million)……………. 84
TABLE NO. 26. : Europe HR Outsourcing Market Revenue, By Type, 2018 – 2024 (USD Million)………………… 85
TABLE NO. 27. : Europe HR Outsourcing Market Revenue, By Type, 2025 – 2032 (USD Million)………………… 86
TABLE NO. 28. : Europe HR Outsourcing Market Revenue, By End-use, 2018 – 2024 (USD Million)……………. 87
TABLE NO. 29. : Europe HR Outsourcing Market Revenue, By End-use, 2025 – 2032 (USD Million)……………. 87
TABLE NO. 30. : UK HR Outsourcing Market Revenue, By Type, 2018 – 2023 (USD Million) ……………………… 88
TABLE NO. 31. : UK HR Outsourcing Market Revenue, By Type, 2024 – 2032 (USD Million) ……………………… 88
TABLE NO. 32. : UK HR Outsourcing Market Revenue, By End-use, 2018 – 2023 (USD Million) …………………. 89
TABLE NO. 33. : UK HR Outsourcing Market Revenue, By End-use, 2024 – 2032 (USD Million) …………………. 89
TABLE NO. 34. : France HR Outsourcing Market Revenue, By Type, 2018 – 2023 (USD Million) ………………… 90
TABLE NO. 35. : France HR Outsourcing Market Revenue, By Type, 2024 – 2032 (USD Million) ………………… 90
TABLE NO. 36. : France HR Outsourcing Market Revenue, By End-use, 2018 – 2023 (USD Million) ……………. 91
TABLE NO. 37. : France HR Outsourcing Market Revenue, By End-use, 2024 – 2032 (USD Million) ……………. 91
TABLE NO. 38. : Germany HR Outsourcing Market Revenue, By Type, 2018 – 2023 (USD Million) …………….. 92
TABLE NO. 39. : Germany HR Outsourcing Market Revenue, By Type, 2024 – 2032 (USD Million) …………….. 92
TABLE NO. 40. : Germany HR Outsourcing Market Revenue, By End-use, 2018 – 2023 (USD Million)…………. 93
TABLE NO. 41. : Germany HR Outsourcing Market Revenue, By End-use, 2024 – 2032 (USD Million)…………. 93
TABLE NO. 42. : Italy HR Outsourcing Market Revenue, By Type, 2018 – 2023 (USD Million)……………………. 94
16 | P a g e
GLOBAL HR OUTSOURCING MARKET, 2018 – 2032
TABLE NO. 43. : Italy HR Outsourcing Market Revenue, By Type, 2024 – 2032 (USD Million)……………………. 94
TABLE NO. 44. : Italy HR Outsourcing Market Revenue, By End-use, 2018 – 2023 (USD Million)……………….. 95
TABLE NO. 45. : Italy HR Outsourcing Market Revenue, By End-use, 2024 – 2032 (USD Million)……………….. 95
TABLE NO. 46. : Spain HR Outsourcing Market Revenue, By Type, 2018 – 2023 (USD Million) ………………….. 96
TABLE NO. 47. : Spain HR Outsourcing Market Revenue, By Type, 2024 – 2032 (USD Million) ………………….. 96
TABLE NO. 48. : Spain HR Outsourcing Market Revenue, By End-use, 2018 – 2023 (USD Million) ……………… 97
TABLE NO. 49. : Spain HR Outsourcing Market Revenue, By End-use, 2024 – 2032 (USD Million) ……………… 97
TABLE NO. 50. : Russia HR Outsourcing Market Revenue, By Type, 2018 – 2023 (USD Million)…………………. 98
TABLE NO. 51. : Russia HR Outsourcing Market Revenue, By Type, 2024 – 2032 (USD Million)…………………. 98
TABLE NO. 52. : Russia HR Outsourcing Market Revenue, By End-use, 2018 – 2023 (USD Million)…………….. 99
TABLE NO. 53. : Russia HR Outsourcing Market Revenue, By End-use, 2024 – 2032 (USD Million)…………….. 99
TABLE NO. 54. : Belgium HR Outsourcing Market Revenue, By Type, 2018 – 2023 (USD Million)………………100
TABLE NO. 55. : Belgium HR Outsourcing Market Revenue, By Type, 2024 – 2032 (USD Million)………………100
TABLE NO. 56. : Belgium HR Outsourcing Market Revenue, By End-use, 2018 – 2023 (USD Million) ………….101
TABLE NO. 57. : Belgium HR Outsourcing Market Revenue, By End-use, 2024 – 2032 (USD Million) ………….101
TABLE NO. 58. : Netherland HR Outsourcing Market Revenue, By Type, 2018 – 2023 (USD Million) ………….102
TABLE NO. 59. : Netherland HR Outsourcing Market Revenue, By Type, 2024 – 2032 (USD Million) ………….102
TABLE NO. 60. : Netherland HR Outsourcing Market Revenue, By End-use, 2018 – 2023 (USD Million) ……..103
TABLE NO. 61. : Netherland HR Outsourcing Market Revenue, By End-use, 2024 – 2032 (USD Million)……..103
TABLE NO. 62. : Austria HR Outsourcing Market Revenue, By Type, 2018 – 2023 (USD Million)………………..104
TABLE NO. 63. : Austria HR Outsourcing Market Revenue, By Type, 2024 – 2032 (USD Million)………………..104
TABLE NO. 64. : Austria HR Outsourcing Market Revenue, By End-use, 2018 – 2023 (USD Million)……………105
TABLE NO. 65. : Austria HR Outsourcing Market Revenue, By End-use, 2024 – 2032 (USD Million)……………105
TABLE NO. 66. : Sweden HR Outsourcing Market Revenue, By Type, 2018 – 2023 (USD Million) ………………106
TABLE NO. 67. : Sweden HR Outsourcing Market Revenue, By Type, 2024 – 2032 (USD Million) ………………106
TABLE NO. 68. : Sweden HR Outsourcing Market Revenue, By End-use, 2018 – 2023 (USD Million) ………….107
TABLE NO. 69. : Sweden HR Outsourcing Market Revenue, By End-use, 2024 – 2032 (USD Million) ………….107
TABLE NO. 70. : Poland HR Outsourcing Market Revenue, By Type, 2018 – 2023 (USD Million)………………..108
TABLE NO. 71. : Poland HR Outsourcing Market Revenue, By Type, 2024 – 2032 (USD Million)………………..108
TABLE NO. 72. : Poland HR Outsourcing Market Revenue, By End-use, 2018 – 2023 (USD Million)……………109
TABLE NO. 73. : Poland HR Outsourcing Market Revenue, By End-use, 2024 – 2032 (USD Million)……………109
TABLE NO. 74. : Denmark HR Outsourcing Market Revenue, By Type, 2018 – 2023 (USD Million)……………..110
TABLE NO. 75. : Denmark HR Outsourcing Market Revenue, By Type, 2024 – 2032 (USD Million)……………..110
TABLE NO. 76. : Denmark HR Outsourcing Market Revenue, By End-use, 2018 – 2023 (USD Million)…………111
TABLE NO. 77. : Denmark HR Outsourcing Market Revenue, By End-use, 2024 – 2032 (USD Million)…………111
TABLE NO. 78. : Switzerland HR Outsourcing Market Revenue, By Type, 2018 – 2023 (USD Million)………….112
TABLE NO. 79. : Switzerland HR Outsourcing Market Revenue, By Type, 2024 – 2032 (USD Million)………….112
TABLE NO. 80. : Switzerland HR Outsourcing Market Revenue, By End-use, 2018 – 2023 (USD Million)……..113
TABLE NO. 81. : Switzerland HR Outsourcing Market Revenue, By End-use, 2024 – 2032 (USD Million)……..113
TABLE NO. 82. : Rest of Europe HR Outsourcing Market Revenue, By Type, 2018 – 2023 (USD Million)……..114
TABLE NO. 83. : Rest of Europe HR Outsourcing Market Revenue, By Type, 2024 – 2032 (USD Million)……..114
TABLE NO. 84. : Rest of Europe HR Outsourcing Market Revenue, By End-use, 2018 – 2023 (USD Million)…115
TABLE NO. 85. : Rest of Europe HR Outsourcing Market Revenue, By End-use, 2024 – 2032 (USD Million)…115
TABLE NO. 86. : Asia Pacific HR Outsourcing Market Revenue, By Country, 2018 – 2023 (USD Million)………117
TABLE NO. 87. : Asia Pacific HR Outsourcing Market Revenue, By Country, 2024 – 2032 (USD Million)………117
17 | P a g e
GLOBAL HR OUTSOURCING MARKET, 2018 – 2032
TABLE NO. 88. : Asia Pacific HR Outsourcing Market Revenue, By Type, 2018 – 2023 (USD Million)…………..118
TABLE NO. 89. : Asia Pacific HR Outsourcing Market Revenue, By Type, 2024 – 2032 (USD Million)…………..118
TABLE NO. 90. : Asia Pacific HR Outsourcing Market Revenue, By End-use, 2018 – 2023 (USD Million)………119
TABLE NO. 91. : Asia Pacific HR Outsourcing Market Revenue, By End-use, 2024 – 2032 (USD Million)………119
TABLE NO. 92. : China HR Outsourcing Market Revenue, By Type, 2018 – 2023 (USD Million)………………….120
TABLE NO. 93. : China HR Outsourcing Market Revenue, By Type, 2024 – 2032 (USD Million)………………….120
TABLE NO. 94. : China HR Outsourcing Market Revenue, By End-use, 2018 – 2023 (USD Million)……………..121
TABLE NO. 95. : China HR Outsourcing Market Revenue, By End-use, 2024 – 2032 (USD Million)……………..121
TABLE NO. 96. : Japan HR Outsourcing Market Revenue, By Type, 2018 – 2023 (USD Million)………………….122
TABLE NO. 97. : Japan HR Outsourcing Market Revenue, By Type, 2024 – 2032 (USD Million)………………….122
TABLE NO. 98. : Japan HR Outsourcing Market Revenue, By End-use, 2018 – 2023 (USD Million)……………..123
TABLE NO. 99. : Japan HR Outsourcing Market Revenue, By End-use, 2024 – 2032 (USD Million)……………..123
TABLE NO. 100. : South Korea HR Outsourcing Market Revenue, By Type, 2018 – 2023 (USD Million)…………124
TABLE NO. 101. : South Korea HR Outsourcing Market Revenue, By Type, 2024 – 2032 (USD Million)…………124
TABLE NO. 102. : South Korea HR Outsourcing Market Revenue, By End-use, 2018 – 2023 (USD Million)…….125
TABLE NO. 103. : South Korea HR Outsourcing Market Revenue, By End-use, 2024 – 2032 (USD Million)…….125
TABLE NO. 104. : India HR Outsourcing Market Revenue, By Type, 2018 – 2023 (USD Million)…………………..126
TABLE NO. 105. : India HR Outsourcing Market Revenue, By Type, 2024 – 2032 (USD Million)…………………..126
TABLE NO. 106. : India HR Outsourcing Market Revenue, By End-use, 2018 – 2023 (USD Million)………………127
TABLE NO. 107. : India HR Outsourcing Market Revenue, By End-use, 2024 – 2032 (USD Million)………………127
TABLE NO. 108. : Australia HR Outsourcing Market Revenue, By Type, 2018 – 2023 (USD Million)……………..128
TABLE NO. 109. : Australia HR Outsourcing Market Revenue, By Type, 2024 – 2032 (USD Million)……………..128
TABLE NO. 110. : Australia HR Outsourcing Market Revenue, By End-use, 2018 – 2023 (USD Million)…………129
TABLE NO. 111. : Australia HR Outsourcing Market Revenue, By End-use, 2024 – 2032 (USD Million)…………129
TABLE NO. 112. : Thailand HR Outsourcing Market Revenue, By Type, 2018 – 2023 (USD Million) ……………..130
TABLE NO. 113. : Thailand HR Outsourcing Market Revenue, By Type, 2024 – 2032 (USD Million) ……………..130
TABLE NO. 114. : Thailand HR Outsourcing Market Revenue, By End-use, 2018 – 2023 (USD Million)………….131
TABLE NO. 115. : Thailand HR Outsourcing Market Revenue, By End-use, 2024 – 2032 (USD Million)………….131
TABLE NO. 116. : Indonesia HR Outsourcing Market Revenue, By Type, 2018 – 2023 (USD Million)…………….132
TABLE NO. 117. : Indonesia HR Outsourcing Market Revenue, By Type, 2024 – 2032 (USD Million)…………….132
TABLE NO. 118. : Indonesia HR Outsourcing Market Revenue, By End-use, 2018 – 2023 (USD Million)………..133
TABLE NO. 119. : Indonesia HR Outsourcing Market Revenue, By End-use, 2024 – 2032 (USD Million)………..133
TABLE NO. 120. : Vietnam HR Outsourcing Market Revenue, By Type, 2018 – 2023 (USD Million)………………134
TABLE NO. 121. : Vietnam HR Outsourcing Market Revenue, By Type, 2024 – 2032 (USD Million)………………134
TABLE NO. 122. : Vietnam HR Outsourcing Market Revenue, By End-use, 2018 – 2023 (USD Million)………….135
TABLE NO. 123. : Vietnam HR Outsourcing Market Revenue, By End-use, 2024 – 2032 (USD Million)………….135
TABLE NO. 124. : Malaysia HR Outsourcing Market Revenue, By Type, 2018 – 2023 (USD Million)……………..136
TABLE NO. 125. : Malaysia HR Outsourcing Market Revenue, By Type, 2024 – 2032 (USD Million)……………..136
TABLE NO. 126. : Malaysia HR Outsourcing Market Revenue, By End-use, 2018 – 2023 (USD Million)…………137
TABLE NO. 127. : Malaysia HR Outsourcing Market Revenue, By End-use, 2024 – 2032 (USD Million)…………137
TABLE NO. 128. : Philippines HR Outsourcing Market Revenue, By Type, 2018 – 2023 (USD Million)…………..138
TABLE NO. 129. : Philippines HR Outsourcing Market Revenue, By Type, 2024 – 2032 (USD Million)…………..138
TABLE NO. 130. : Philippines HR Outsourcing Market Revenue, By End-use, 2018 – 2023 (USD Million)………139
TABLE NO. 131. : Philippines HR Outsourcing Market Revenue, By End-use, 2024 – 2032 (USD Million)………139
TABLE NO. 132. : Taiwan HR Outsourcing Market Revenue, By Type, 2018 – 2023 (USD Million)………………..140
18 | P a g e
GLOBAL HR OUTSOURCING MARKET, 2018 – 2032
TABLE NO. 133. : Taiwan HR Outsourcing Market Revenue, By Type, 2024 – 2032 (USD Million)………………..140
TABLE NO. 134. : Taiwan HR Outsourcing Market Revenue, By End-use, 2018 – 2023 (USD Million)……………141
TABLE NO. 135. : Taiwan HR Outsourcing Market Revenue, By End-use, 2024 – 2032 (USD Million)……………141
TABLE NO. 136. : Rest of Asia Pacific HR Outsourcing Market Revenue, By Type, 2018 – 2023 (USD Million)..142
TABLE NO. 137. : Rest of Asia Pacific HR Outsourcing Market Revenue, By Type, 2024 – 2032 (USD Million)..142
TABLE NO. 138. : Rest of Asia Pacific HR Outsourcing Market Revenue, By End-use, 2018 – 2023 (USD
Million) ……………………………………………………………………………………………………………..143
TABLE NO. 139. : Rest of Asia Pacific HR Outsourcing Market Revenue, By End-use, 2024 – 2032 (USD
Million) ……………………………………………………………………………………………………………..143
TABLE NO. 140. : Latin America HR Outsourcing Market Revenue, By Country, 2018 – 2023 (USD Million)…..145
TABLE NO. 141. : Latin America HR Outsourcing Market Revenue, By Country, 2024 – 2032 (USD Million)…..145
TABLE NO. 142. : Latin America HR Outsourcing Market Revenue, By Type, 2018 – 2023 (USD Million) ………146
TABLE NO. 143. : Latin America HR Outsourcing Market Revenue, By Type, 2024 – 2032 (USD Million) ………146
TABLE NO. 144. : Latin America HR Outsourcing Market Revenue, By End-use, 2018 – 2023 (USD Million)…..147
TABLE NO. 145. : Latin America HR Outsourcing Market Revenue, By End-use, 2024 – 2032 (USD Million)…..147
TABLE NO. 146. : Brazil HR Outsourcing Market Revenue, By Type, 2018 – 2023 (USD Million) ………………….148
TABLE NO. 147. : Brazil HR Outsourcing Market Revenue, By Type, 2024 – 2032 (USD Million) ………………….148
TABLE NO. 148. : Brazil HR Outsourcing Market Revenue, By End-use, 2018 – 2023 (USD Million) ……………..149
TABLE NO. 149. : Brazil HR Outsourcing Market Revenue, By End-use, 2024 – 2032 (USD Million) ……………..149
TABLE NO. 150. : Argentina HR Outsourcing Market Revenue, By Type, 2018 – 2023 (USD Million) ……………150
TABLE NO. 151. : Argentina HR Outsourcing Market Revenue, By Type, 2024 – 2032 (USD Million) ……………150
TABLE NO. 152. : Argentina HR Outsourcing Market Revenue, By End-use, 2018 – 2023 (USD Million)………..151
TABLE NO. 153. : Argentina HR Outsourcing Market Revenue, By End-use, 2024 – 2032 (USD Million)………..151
TABLE NO. 154. : Peru HR Outsourcing Market Revenue, By Type, 2018 – 2023 (USD Million) …………………..152
TABLE NO. 155. : Peru HR Outsourcing Market Revenue, By Type, 2024 – 2032 (USD Million) …………………..152
TABLE NO. 156. : Peru HR Outsourcing Market Revenue, By End-use, 2018 – 2023 (USD Million)……………….153
TABLE NO. 157. : Peru HR Outsourcing Market Revenue, By End-use, 2024 – 2032 (USD Million)……………….153
TABLE NO. 158. : Chile HR Outsourcing Market Revenue, By Type, 2018 – 2023 (USD Million)…………………..154
TABLE NO. 159. : Chile HR Outsourcing Market Revenue, By Type, 2024 – 2032 (USD Million)…………………..154
TABLE NO. 160. : Chile HR Outsourcing Market Revenue, By End-use, 2018 – 2023 (USD Million)………………155
TABLE NO. 161. : Chile HR Outsourcing Market Revenue, By End-use, 2024 – 2032 (USD Million)………………155
TABLE NO. 162. : Colombia HR Outsourcing Market Revenue, By Type, 2018 – 2023 (USD Million)…………….156
TABLE NO. 163. : Colombia HR Outsourcing Market Revenue, By Type, 2024 – 2032 (USD Million)…………….156
TABLE NO. 164. : Colombia HR Outsourcing Market Revenue, By End-use, 2018 – 2023 (USD Million) ………..157
TABLE NO. 165. : Colombia HR Outsourcing Market Revenue, By End-use, 2024 – 2032 (USD Million) ………..157
TABLE NO. 166. : Rest of Latin America HR Outsourcing Market Revenue, By Type, 2018 – 2023 (USD
Million) ……………………………………………………………………………………………………………..158
TABLE NO. 167. : Rest of Latin America HR Outsourcing Market Revenue, By Type, 2024 – 2032 (USD
Million) ……………………………………………………………………………………………………………..158
TABLE NO. 168. : Rest of Latin America HR Outsourcing Market Revenue, By End-use, 2018 – 2023 (USD
Million) ……………………………………………………………………………………………………………..159
TABLE NO. 169. : Rest of Latin America HR Outsourcing Market Revenue, By End-use, 2024 – 2032 (USD
Million) ……………………………………………………………………………………………………………..159
TABLE NO. 170. : Middle East HR Outsourcing Market Revenue, By Country, 2018 – 2023 (USD Million)……..161
TABLE NO. 171. : Middle East HR Outsourcing Market Revenue, By Country, 2024 – 2032 (USD Million)……..161
19 | P a g e
GLOBAL HR OUTSOURCING MARKET, 2018 – 2032
TABLE NO. 172. : Middle East HR Outsourcing Market Revenue, By Type, 2018 – 2023 (USD Million)………….162
TABLE NO. 173. : Middle East HR Outsourcing Market Revenue, By Type, 2024 – 2032 (USD Million)………….162
TABLE NO. 174. : Middle East HR Outsourcing Market Revenue, By End-use, 2018 – 2023 (USD Million)……..163
TABLE NO. 175. : Middle East HR Outsourcing Market Revenue, By End-use, 2024 – 2032 (USD Million)……..163
TABLE NO. 176. : UAE HR Outsourcing Market Revenue, By Type, 2018 – 2023 (USD Million)……………………164
TABLE NO. 177. : UAE HR Outsourcing Market Revenue, By Type, 2024 – 2032 (USD Million)……………………164
TABLE NO. 178. : UAE HR Outsourcing Market Revenue, By End-use, 2018 – 2023 (USD Million) ……………….165
TABLE NO. 179. : UAE HR Outsourcing Market Revenue, By End-use, 2024 – 2032 (USD Million) ……………….165
TABLE NO. 180. : KSA HR Outsourcing Market Revenue, By Type, 2018 – 2023 (USD Million)…………………….166
TABLE NO. 181. : KSA HR Outsourcing Market Revenue, By Type, 2024 – 2032 (USD Million)…………………….166
TABLE NO. 182. : KSA HR Outsourcing Market Revenue, By End-use, 2018 – 2023 (USD Million)………………..167
TABLE NO. 183. : KSA HR Outsourcing Market Revenue, By End-use, 2024 – 2032 (USD Million)………………..167
TABLE NO. 184. : Israel HR Outsourcing Market Revenue, By Type, 2018 – 2023 (USD Million) ………………….168
TABLE NO. 185. : Israel HR Outsourcing Market Revenue, By Type, 2024 – 2032 (USD Million) ………………….168
TABLE NO. 186. : Israel HR Outsourcing Market Revenue, By End-use, 2018 – 2023 (USD Million) ……………..169
TABLE NO. 187. : Israel HR Outsourcing Market Revenue, By End-use, 2024 – 2032 (USD Million) ……………..169
TABLE NO. 188. : Turkey HR Outsourcing Market Revenue, By Type, 2018 – 2023 (USD Million)………………..170
TABLE NO. 189. : Turkey HR Outsourcing Market Revenue, By Type, 2024 – 2032 (USD Million)………………..170
TABLE NO. 190. : Turkey HR Outsourcing Market Revenue, By End-use, 2018 – 2023 (USD Million) ……………171
TABLE NO. 191. : Turkey HR Outsourcing Market Revenue, By End-use, 2024 – 2032 (USD Million) ……………171
TABLE NO. 192. : Iran HR Outsourcing Market Revenue, By Type, 2018 – 2023 (USD Million)…………………….172
TABLE NO. 193. : Iran HR Outsourcing Market Revenue, By Type, 2024 – 2032 (USD Million)…………………….172
TABLE NO. 194. : Iran HR Outsourcing Market Revenue, By End-use, 2018 – 2023 (USD Million)………………..173
TABLE NO. 195. : Iran HR Outsourcing Market Revenue, By End-use, 2024 – 2032 (USD Million)………………..173
TABLE NO. 196. : Rest of Middle East HR Outsourcing Market Revenue, By Type, 2018 – 2023 (USD Million).174
TABLE NO. 197. : Rest of Middle East HR Outsourcing Market Revenue, By Type, 2024 – 2032 (USD Million).174
TABLE NO. 198. : Rest of Middle East HR Outsourcing Market Revenue, By End-use, 2018 – 2023 (USD
Million) ……………………………………………………………………………………………………………..175
TABLE NO. 199. : Rest of Middle East HR Outsourcing Market Revenue, By End-use, 2024 – 2032 (USD
Million) ……………………………………………………………………………………………………………..175
TABLE NO. 200. : Africa HR Outsourcing Market Revenue, By Country, 2018 – 2023 (USD Million)……………..177
TABLE NO. 201. : Africa HR Outsourcing Market Revenue, By Country, 2024 – 2032 (USD Million)……………..177
TABLE NO. 202. : Africa HR Outsourcing Market Revenue, By Type, 2018 – 2023 (USD Million)………………….178
TABLE NO. 203. : Africa HR Outsourcing Market Revenue, By Type, 2024 – 2032 (USD Million)………………….178
TABLE NO. 204. : Africa HR Outsourcing Market Revenue, By End-use, 2018 – 2023 (USD Million)……………..179
TABLE NO. 205. : Africa HR Outsourcing Market Revenue, By End-use, 2024 – 2032 (USD Million)……………..179
TABLE NO. 206. : South Africa HR Outsourcing Market Revenue, By Type, 2018 – 2023 (USD Million)…………180
TABLE NO. 207. : South Africa HR Outsourcing Market Revenue, By Type, 2024 – 2032 (USD Million)…………180
TABLE NO. 208. : South Africa HR Outsourcing Market Revenue, By End-use, 2018 – 2023 (USD Million)…….181
TABLE NO. 209. : South Africa HR Outsourcing Market Revenue, By End-use, 2024 – 2032 (USD Million)…….181
TABLE NO. 210. : Egypt HR Outsourcing Market Revenue, By Type, 2018 – 2023 (USD Million)………………….182
TABLE NO. 211. : Egypt HR Outsourcing Market Revenue, By Type, 2024 – 2032 (USD Million)………………….182
TABLE NO. 212. : Egypt HR Outsourcing Market Revenue, By End-use, 2018 – 2023 (USD Million)……………..183
TABLE NO. 213. : Egypt HR Outsourcing Market Revenue, By End-use, 2024 – 2032 (USD Million)……………..183
TABLE NO. 214. : Nigeria HR Outsourcing Market Revenue, By Type, 2018 – 2023 (USD Million)………………..184
20 | P a g e
GLOBAL HR OUTSOURCING MARKET, 2018 – 2032
TABLE NO. 215. : Nigeria HR Outsourcing Market Revenue, By Type, 2024 – 2032 (USD Million)………………..184
TABLE NO. 216. : Nigeria HR Outsourcing Market Revenue, By End-use, 2018 – 2023 (USD Million)……………185
TABLE NO. 217. : Nigeria HR Outsourcing Market Revenue, By End-use, 2024 – 2032 (USD Million)……………185
TABLE NO. 218. : Algeria HR Outsourcing Market Revenue, By Type, 2018 – 2023 (USD Million)………………..186
TABLE NO. 219. : Algeria HR Outsourcing Market Revenue, By Type, 2024 – 2032 (USD Million)………………..186
TABLE NO. 220. : Algeria HR Outsourcing Market Revenue, By End-use, 2018 – 2023 (USD Million)……………187
TABLE NO. 221. : Algeria HR Outsourcing Market Revenue, By End-use, 2024 – 2032 (USD Million)……………187
TABLE NO. 222. : Morocco HR Outsourcing Market Revenue, By Type, 2018 – 2023 (USD Million)……………..188
TABLE NO. 223. : Morocco HR Outsourcing Market Revenue, By Type, 2024 – 2032 (USD Million)……………..188
TABLE NO. 224. : Morocco HR Outsourcing Market Revenue, By End-use, 2018 – 2023 (USD Million)…………189
TABLE NO. 225. : Morocco HR Outsourcing Market Revenue, By End-use, 2024 – 2032 (USD Million)…………189
TABLE NO. 226. : Rest of Africa HR Outsourcing Market Revenue, By Type, 2018 – 2023 (USD Million)……….190
TABLE NO. 227. : Rest of Africa HR Outsourcing Market Revenue, By Type, 2024 – 2032 (USD Million)……….190
TABLE NO. 228. : Rest of Africa HR Outsourcing Market Revenue, By End-use, 2018 – 2023 (USD Million) …..191
TABLE NO. 229. : Rest of Africa HR Outsourcing Market Revenue, By End-use, 2024 – 2032 (USD Million) …..191