Market Overview
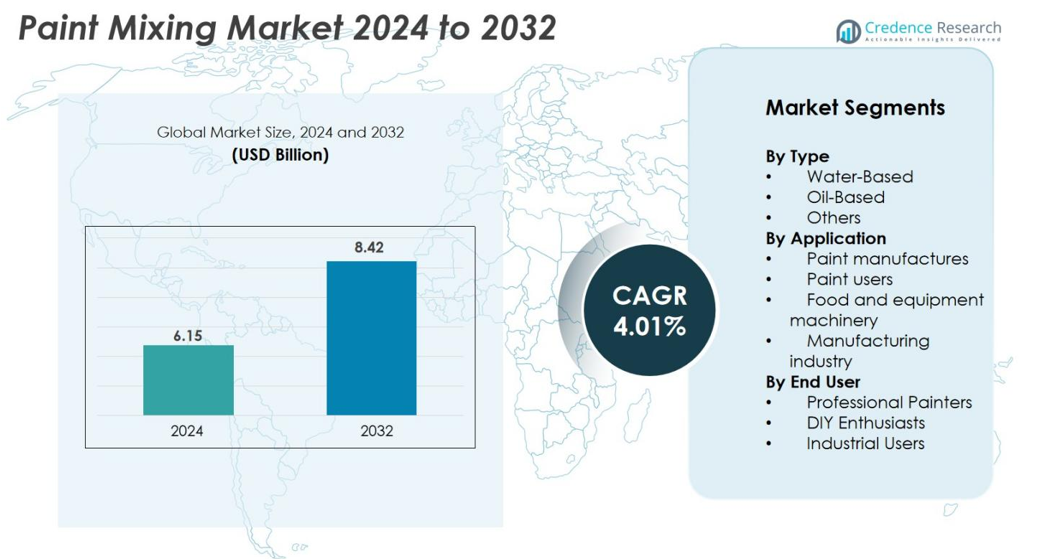
Paint Mixing market size was valued USD 6.15 Billion in 2024 and is anticipated to reach USD 8.42 Billion by 2032, at a CAGR of 4.01% during the forecast period.
| REPORT ATTRIBUTE |
DETAILS |
| Historical Period |
2020-2023 |
| Base Year |
2024 |
| Forecast Period |
2025-2032 |
| Paint Mixing market Size 2024 |
USD 6.15 Billion |
| Paint Mixing market, CAGR |
4.01% |
| Paint Mixing market Size 2032 |
USD 8.42 Billion |
The Paint Mixing Market includes top players such as DynaMix, Farfly Machinery, Hua Yun, Charles Ross & Son Company, Hockmeyer Equipment Corporation, NDCO, Netzsch Premier Technologies, Xtrutech Ltd., Brillux, and Sartorius. These firms compete on innovation in mixing technologies, regional service reach, and custom configuration for decorative and industrial paints. The leading region remains North America, capturing about 35% of global market share, followed by Europe at around 30% and Asia-Pacific at roughly 25%. Regional dominance reflects well-established infrastructure, strong regulations, and industrial demand in those markets, with increasing focus on sustainability, eco-friendly solutions, and improving production efficiency.
Market Insights
- The global Paint Mixing market was valued at USD 6.15 Billion in 2024 and is projected to reach USD 8.42 Billion by 2032, growing at a CAGR of 4.01% during the forecast period.
- Rising demand for eco-friendly water-based paints and automation in industrial production drives market growth, with water-based systems holding 62% share by type and industrial users accounting for 52% share.
- Trends include integration of IoT-enabled mixers, digital monitoring, and high-shear mixing technologies, supporting consistent quality and operational efficiency.
- The competitive landscape is fragmented, with key players like DynaMix, Charles Ross & Son Company, Hockmeyer Equipment Corporation, and Netzsch Premier Technologies focusing on R&D, regional expansion, and customized solutions.
- North America leads with 35% market share, followed by Europe at 30% and Asia-Pacific at 25%, while Latin America and MEA hold 5%, reflecting regional industrialization and regulatory adoption.
Access crucial information at unmatched prices!
Request your sample report today & start making informed decisions powered by Credence Research Inc.!
Download Sample
Market Segmentation Analysis
By Type
Water-based paint mixing systems dominate the market with a 62% share due to low VOC emissions, faster drying, and easier cleanup. They are widely adopted in residential and commercial projects, supported by stricter environmental regulations. Oil-based systems hold a smaller share because of odor and longer drying time, yet remain relevant for heavy-duty coatings that demand high durability and gloss. The “Others” segment, including solvent-free and hybrid formulations, grows as manufacturers invest in eco-friendly technologies. Rising demand for sustainable coatings keeps water-based solutions at the leading position.
- For instance, the Texas Commission of Environmental Quality enforces strict VOC limits, pushing manufacturers towards water-based paints that emit significantly fewer harmful emissions compared to oil-based systems.
By Application
Paint manufacturers lead the market with a 48% share, driven by mass-production needs and automated mixing systems. They invest in advanced dispersers, high-shear mixers, and computerized batching to maintain color accuracy and consistency. Paint users, including contractors and workshops, also adopt portable mixers for fast on-site blending. Food and equipment machinery relies on sanitary mixing units engineered for chemical resistance. The manufacturing industry supports demand for industrial coatings, primers, and corrosion-resistant paints. Strong adoption in factories and large paint plants keeps manufacturers as the dominant segment.
- For instance, YSTRAL’s Conti-TDS technology has revolutionized paint production by offering high-shear dispersion with a shear rate 1,000 times higher than traditional dissolvers.
By End User
Industrial users account for the largest 52% share due to large-volume usage in automotive, construction, marine, and equipment production. They depend on high-capacity mixers with precision dosing and automated pigment control. Professional painters form the next key group, using compact mixers to match shades and speed up application on job sites. DIY enthusiasts contribute smaller volume but steady growth through retail tinting systems offered in hardware and home-improvement stores. Demand for durable and uniform coatings in industrial operations ensures this segment remains the leading end user.
Key Growth Drivers
Rising Demand for Eco-Friendly Coatings
The Paint Mixing market is propelled by growing demand for environmentally friendly coatings. Water-based and low-VOC formulations are increasingly preferred to meet stringent emission regulations. Manufacturers invest in advanced mixing equipment that ensures consistent dispersion of pigments while minimizing chemical waste. Urbanization and rising residential construction amplify demand for decorative paints, driving adoption of automated mixers that support high-volume production. Industrial sectors, including automotive and marine, require uniform, durable coatings, further encouraging precision mixing technologies. The push for sustainability combined with regulatory compliance ensures continued market expansion and innovation in mixing equipment design.
- For instance, Stahl’s Relca® portfolio offers water-based polyurethane coatings using bio-based raw materials to lower environmental impact and VOC emissions.
Expansion of Industrial and Commercial Construction
Industrial and commercial construction projects directly fuel the Paint Mixing market. Large-scale infrastructure, manufacturing plants, and commercial buildings demand high volumes of paint with consistent color and performance. Automated mixing systems reduce human error, optimize pigment blending, and enhance efficiency. This trend supports investments in digital and high-shear mixing technologies that can handle varied viscosities and complex formulations. Regional growth in emerging economies, where construction activity is increasing, further drives demand. Equipment manufacturers benefit from long-term contracts with paint producers and construction firms, reinforcing market growth while supporting the development of specialized mixers for industrial-scale operations.
- For instance, BASF Coatings expanded its Caojing resin plant in Shanghai to increase polyester and polyurethane resin production capacity from 8,000 to 18,800 metric tons per year, supporting large-scale coatings production for automotive and industrial construction markets with highly automated and renewable energy-powered operations.
Technological Advancements in Mixing Equipment
Advancements in mixing technology, including high-shear dispersers, automated batch controllers, and real-time quality monitoring, drive market growth. Precision mixing improves product uniformity, reduces waste, and enhances operational efficiency for paint manufacturers. Integration of digital controls allows real-time adjustment of mixing speed, duration, and viscosity, improving consistency across large batches. Automation also supports compliance with environmental regulations by controlling emissions and minimizing solvent usage. Companies increasingly adopt smart mixers compatible with multiple formulations, catering to both industrial and decorative paints. These innovations attract investment, boost production capacity, and expand applications, sustaining market momentum.
Key Trends & Opportunities
Shift Toward Digital and IoT-Enabled Mixing Systems
The market is witnessing adoption of digital and IoT-enabled paint mixing systems. These systems allow remote monitoring, real-time process adjustments, and data-driven quality control. Manufacturers can optimize color consistency, reduce downtime, and minimize energy consumption. Integration with ERP and production planning systems enhances operational efficiency, particularly in high-volume industrial applications. IoT solutions also enable predictive maintenance of mixers, reducing equipment failure risks and prolonging service life. This trend presents opportunities for equipment manufacturers to offer smart solutions that improve productivity and support environmentally compliant operations, while end users benefit from reduced waste and enhanced product quality.
- For instance, Graco’s ProMix 2KS and 3KS systems incorporate remote diagnostics and cloud-based process monitoring, allowing paint shops to track consumption and undertake predictive maintenance from any location.
Growing Demand from Emerging Economies
Emerging economies present significant growth opportunities due to urbanization, industrialization, and rising disposable income. Paint manufacturers in India, China, Brazil, and Southeast Asia increasingly invest in automated mixing systems to meet growing construction and industrial demand. The expansion of commercial, residential, and infrastructure projects drives bulk paint production, boosting demand for high-capacity, reliable mixers. Local regulations encouraging low-VOC and water-based paints further stimulate equipment adoption. Companies can capitalize on regional opportunities by offering cost-effective, scalable, and modular mixing solutions tailored to local production capacities, strengthening market presence in high-growth regions.
- For instance, Alfa Laval Corporate AB emphasizes hygienic, automated solutions that help industries comply with strict global standards, boosting adoption in sectors like cosmetics and biotech.
Key Challenges
High Capital Investment Requirements
The Paint Mixing market faces challenges due to significant upfront costs for advanced and automated mixing equipment. Small and medium-sized paint manufacturers often struggle to invest in high-shear or digital mixers with precision controls, limiting their competitiveness. Maintenance, spare parts, and training add to operational expenses, deterring widespread adoption. Equipment downtime during installation or calibration can disrupt production schedules. Companies must balance investment with projected efficiency gains, and leasing or modular solutions are emerging as strategies to reduce financial barriers. High capital intensity remains a key constraint, particularly for emerging market participants with limited access to financing.
Complexity in Handling Diverse Formulations
Mixing diverse paint formulations poses operational challenges. Varying viscosities, pigment densities, and solvent compositions require precise control to maintain color consistency and performance. Inconsistent mixing can result in product defects, rework, and increased waste. Specialized equipment and trained personnel are essential to manage complex blends, particularly for industrial coatings or hybrid formulations. Regulatory standards on VOCs and environmental compliance add additional complexity, requiring frequent adjustments in mixing parameters. These technical challenges demand continuous innovation in mixer design, process monitoring, and operator training to ensure quality and efficiency across diverse paint types.
Regional Analysis
North America
North America leads the paint mixing market with a 35 % share, driven by strong automotive and construction sectors. Strict regulatory frameworks and demand for high‑precision mixing systems push manufacturers to adopt automated and digital solutions. The U.S. and Canada register high uptake of advanced mixers supporting water‑based and low‑VOC formulations. Equipment suppliers benefit from established channels and strong service support. Growth remains steady as industry focuses on efficiency, sustainability, and advanced color‑matching capabilities.
Europe
Europe holds approximately 30 % of the market, led by Germany, France, and the UK. Environmental regulations and consumer preference for sustainable paints drive adoption of water‑based systems and automated mixing. Industrial users demand consistent quality and compliance, supporting high‑end equipment sales. The region’s demand for custom color matching and smaller batch blending also fuels mixer innovation. Suppliers tailoring local service and modular solutions gain advantage in this mature but evolving market.
Asia‑Pacific
The Asia‑Pacific region commands about 25 % of the market, led by China and India. Rapid urbanization, expanding manufacturing, and large infrastructure projects boost demand for paint mixing technology. Local paint producers increasingly invest in automated and IoT‑enabled mixing units to support high‑volume production. Market entrants compete to supply scalable, cost‑effective mixers suited to regional growth. Growth rates outpace other regions as these economies scale their decorative and industrial paint capabilities.
Latin America, Middle East & Africa
Latin America together with the Middle East & Africa accounts for around 5 % of the global market. Infrastructure investment in GCC countries and rising urbanization in Latin America stimulate demand for mixing equipment. However, low manufacturing base and fragmented markets limit growth relative to other regions. Equipment providers targeting these regions focus on modular, lower‑cost solutions tailored to local conditions. With regulatory frameworks evolving, the region offers moderate but rising opportunity for growth.
Shape Your Report to Specific Countries or Regions & Enjoy 30% Off!
Market Segmentations:
By Type
- Water-Based
- Oil-Based
- Others
By Application
- Paint manufactures
- Paint users
- Food and equipment machinery
- Manufacturing industry
By End User
- Professional Painters
- DIY Enthusiasts
- Industrial Users
By Geography
- North America
- Europe
- Germany
- France
- U.K.
- Italy
- Spain
- Rest of Europe
- Asia Pacific
- China
- Japan
- India
- South Korea
- South-east Asia
- Rest of Asia Pacific
- Latin America
- Brazil
- Argentina
- Rest of Latin America
- Middle East & Africa
- GCC Countries
- South Africa
- Rest of the Middle East and Africa
Competitive Landscape
The competitive landscape of the paint‑mixing market is fragmented, with no single company holding a dominant share. DynaMix, Charles Ross & Son Company, Hockmeyer Equipment Corporation, Netzsch Premier Technologies, and others compete on technological innovation, regional service networks, and custom‑mixing capabilities.Leading players invest heavily in R&D to deliver automated, energy‑efficient, and IoT‑enabled mixing systems. They also pursue strategic acquisitions and expand into high‑growth regions such as Asia‑Pacific to capture emerging demand.Smaller and regional players maintain competitiveness by offering flexible, modular systems tailored to local end‑user requirements and by providing strong after‑sales service. This dynamic environment encourages continuous innovation and helps maintain steady market growth through differentiation rather than price alone.
Key Player Analysis
Recent Developments
- In March 2025, PPG Industries inaugurated a new facility in Samut Prakan, Thailand, with an annual capacity to produce 2,000 tonnes of waterborne automotive basecoats and primers, featuring automated spray application technology.
- In November 2024, PPG Industries’ MOONWALK automated paint mixing system achieved deployment across body shops in all 50 U.S. states, delivering productivity gains exceeding 10% and establishing new industry efficiency benchmarks.
- In November 2024, The Sherwin-Williams Company introduced “Collision Core Pronto,” an automated paint-dispenser machine targeted at the auto-refinish market.
Report Coverage
The research report offers an in-depth analysis based on Type, Application, End-User and Geography. It details leading market players, providing an overview of their business, product offerings, investments, revenue streams, and key applications. Additionally, the report includes insights into the competitive environment, SWOT analysis, current market trends, as well as the primary drivers and constraints. Furthermore, it discusses various factors that have driven market expansion in recent years. The report also explores market dynamics, regulatory scenarios, and technological advancements that are shaping the industry. It assesses the impact of external factors and global economic changes on market growth. Lastly, it provides strategic recommendations for new entrants and established companies to navigate the complexities of the market.
Future Outlook
- Increasing demand for low‑VOC and sustainable coatings will drive investment in advanced mixing systems.
- Automation and digitalisation of mixing equipment will enable higher precision and reduced waste in paint production.
- Expanding construction and infrastructure projects in emerging economies will boost demand for high‑volume paint mixing solutions.
- Modular and scalable mixing units will gain traction among small and mid‑sized paint manufacturers seeking flexibility.
- IoT‑enabled monitoring and predictive maintenance will improve uptime and lower operational costs for equipment owners.
- Growth in industrial coatings for automotive, marine and aerospace sectors will increase demand for specialised mixing technologies.
- Rising labour costs and skills shortages will push paint producers toward automated, easy‑to‑operate mixing systems.
- Regional expansion into Asia‑Pacific and Latin America will open new opportunities for equipment providers and service networks.
- Demand for customised colour matching and small‑batch blending in the décor segment will support niche mixing solutions.
- Partnerships and acquisitions among equipment manufacturers and service providers will strengthen market positions and geographic reach.



