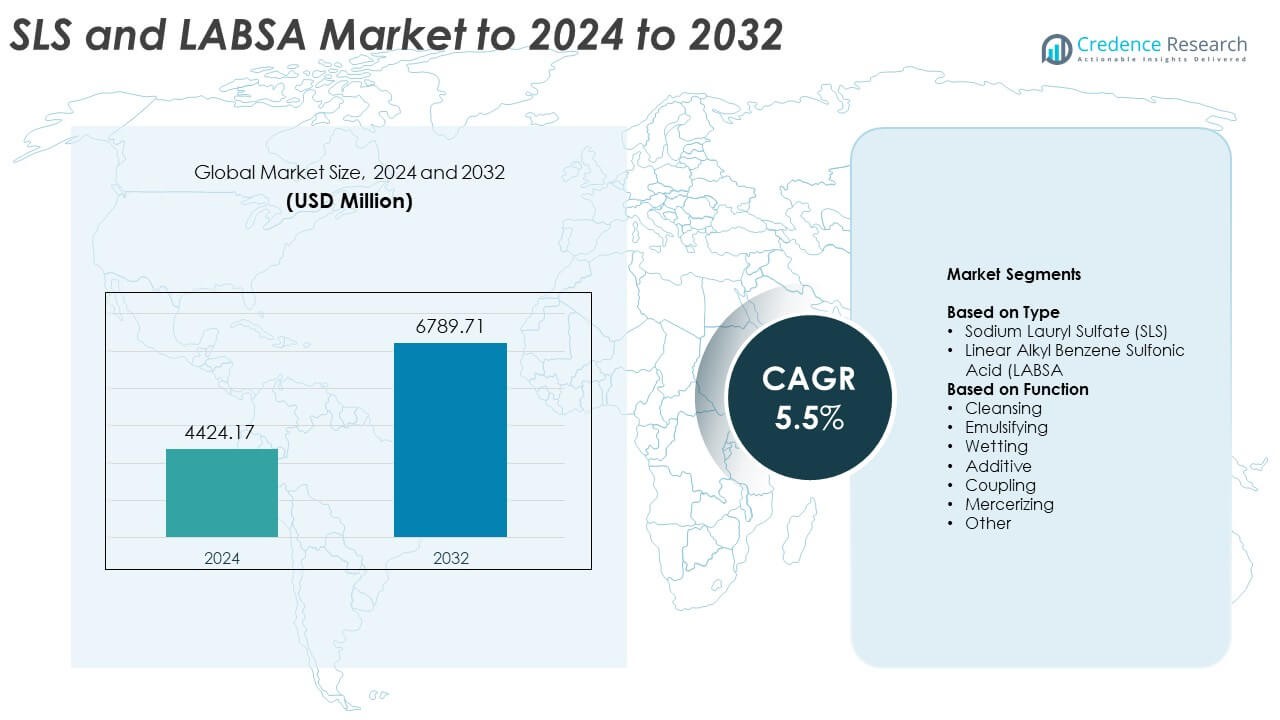
Home » SLS and LABSA Market

SLS and LABSA Market By Type (Sodium Lauryl Sulfate (SLS), Linear Alkyl Benzene Sulfonic Acid) By Function (Cleansing, Emulsifying, Wetting, Coupling, Mercerizing, Others)-Growth, Future Prospects & Competitive Analysis, 2016 – 2030

Price: $4999

Published: | Report ID: 18091 | Report Format : PDF

Key Highlights of the Report

The global SLS and LABSA market is segmented by type, function, end-use, and region. Linear Alkyl Benzene Sulfonic Acid is the most popular segment based on type, while cleansing is the primary function segment. Agrochemicals and home care are the most common end-use segments, with North America leading the market growth.

The global SLS and LABSA market has several drivers, including growing consumer disposable income in developing nations, rising personal hygiene and cleanliness awareness, and expanding demand for household and personal care products. The demand for SLS and LABSA is driven by the continued expansion of the institutional and industrial cleaning market and the growing importance of cleanliness and hygiene in commercial spaces. However, the demand for ecologically acceptable and sustainable substitutes for conventional surfactants, such as SLS and LABSA, is rising as consumer and industry awareness of sustainability grows. This could limit the growth of the SLS and LABSA markets since producers could have to spend money on R&D to create and deploy sustainable surfactant substitutes.

Nonetheless, the global SLS and LABSA market offers significant growth opportunities, including vendors in the industry that stand to gain financially from the rise of the agrochemicals sector. Suppliers are expanding their production capacities to meet the growing demand for LABSA and SLS. They are also introducing new products for various end-use sectors to gain a larger market share for SLS and LABSA.

Market Overview

The global SLS and LABSA market has witnessed steady growth in recent years and is expected to continue growing at a CAGR of 4.50% between 2023 and 2030. The market was valued at USD 4.7 billion in 2022 and is expected to reach USD 6.4 billion in 2030.

Design Element 2

Access crucial information at unmatched prices!

Request your free sample report today & start making informed decisions powered by Credence Research!

Download Free Sample
CTA Design Element 3

What Are The Main Drivers Of The Global SLS and LABSA Market?

The global SLS and LABSA market is driven by several factors, including growing disposable income in developing nations, rising personal hygiene and cleanliness awareness, and expanding demand for household and personal care products. The demand for SLS and LABSA is driven by the continued expansion of the institutional and industrial cleaning market and the growing importance of cleanliness and hygiene in commercial spaces.

What Are The Major Challenges Faced By The Global SLS and LABSA Market?

The global SLS and LABSA market also faces several challenges, including the demand for ecologically acceptable and sustainable substitutes for conventional surfactants, such as SLS and LABSA, which is rising as consumer and industry awareness of sustainability grows. This could limit the growth of the SLS and LABSA markets since producers could have to spend money on R&D to create and deploy sustainable surfactant substitutes.

What Are The Growth Opportunities In The Global SLS and LABSA Market?

The global SLS and LABSA market offers significant growth opportunities, including vendors in the industry that stand to gain financially from the rise of the agrochemicals sector. Suppliers are expanding their production capacities to meet the growing demand for LABSA and SLS. They are also introducing new products for various end-use sectors to gain a larger market share for SLS and LABSA.

Executive Summary

Overview of the Global SLS and LABSA Market

Demand for sodium lauryl sulphate (SLS) and linear alkyl benzene sulfonic acid (LABSA) is driven by the widespread use of surfactants in the production of cleaning and personal care products. Due to their affordability and environmental safety, these synthetic anionic surfactants have gained popularity in domestic cleaning applications.

Market Definition

The two most widely used anionic surfactants are SLS and LABSA. They work in the industry that makes laundry powders and liquids, dishwashing solutions, and various other household cleaners. SLS is a highly effective surfactant for producing soaps, industrial floor cleaners, and engine degreasers. It can also thicken or emulsify liquids. Natural resources can be used to create SLS. It is produced through the esterification of dodecanol and sulfonic acid. SLS is created by neutralizing this substance with sodium carbonate.

Market Insights

  • The global demand for SLS and LABSAs was valued at USD 4.7 Billion in 2022 and is expected to reach USD 6.40 Billion in 2030, growing at a CAGR of 4.50% between 2023 and 2030.
  • Linear alkyl benzene sulfonic acid is the leading segment by type and held over 64% share in terms of value in 2022, while the sodium lauryl sulfate segment is likely to exhibit the fastest CAGR during the forecast period.
  • The cleansing segment governs the demand for SLS and LABSAs globally, holding a massive share of over 35% in 2022, and is expected to grow at a rapid CAGR.
  • The agrochemicals segment is expected to post the highest CAGR during the forecast period, while the home care segment is leading the market share with over 30% share in 2022.
  • North America is fueling the growth of the SLS and LABSA industry with over 35% share in 2022, while Asia Pacific and Europe collectively account for just under 50% share in 2022. Europe held over 22% share in 2022.
  • The Asia Pacific region has experienced significant urbanization and industrialization, which has raised consumer demand for household goods and cosmetics. Due to their expanding populations, increasing disposable incomes, and shifting consumer tastes regarding personal care and hygiene, China, India, and Southeast Asian nations are predicted to lead this region’s demand for SLS and LABSA.

Segmentation by Type

  • Linear alkyl benzene sulfonic acid is the leading segment by material and held over 64% share in terms of value in 2022.
  • The sodium lauryl sulfate segment will likely exhibit the fastest CAGR during the forecast period.

Segmentation by Function

  • The cleansing segment governs the demand for SLS and LABSAs globally, holding a massive share of over 35% in 2022, and is also expected to grow at a rapid CAGR.
  • The emulsifying segment contributes to the demand for SLS and LABSAs.

Segmentation by End-Use

  • The agrochemicals segment is expected to post the highest CAGR during the forecast period.
  • The home care segment is leading the market share with over 30% share in 2022.
  • Other end use, such as personal care, pharmaceuticals, textiles, food and beverages, industrial and institutional cleaning, also contribute to the demand for SLS and LABSAs.

Segmentation by Region

  • North America is fueling the growth of the SLS and LABSA industry with over 35% share in 2022.
  • Asia Pacific and Europe collectively account for just under 50% share in 2022, with Europe holding over 22% share in the same year.
  • The rest of the World, including Latin America, The Middle East, and Africa, contributes the remainder to the demand for SLS and LABSAs.

The United States is one of the largest markets for SLS and LABSAs in North America, with a significant share of the market. Future market expansion for SLS and LABSA is anticipated to be fueled by the US’s rising use of personal care products. Because SLS and LABSA are used to produce personal products, including cosmetics, shampoos, toothpaste, body washes, and other personal care items, the market for SLS and LABSA is growing as more people use personal care items. For instance, in August 2022, the US market for personal care and beauty products is expected to be worth about $84 billion, according to Zippia Inc., a US-based provider of online recruitment services.

China is also a major market for SLS and LABSAs in the Asia Pacific region, with a significant market share. Due to the country’s rising demand for liquid soaps and increased awareness of hygiene products, China is the top user of anionic surfactants in Asia. According to estimates, China’s rapid industrialization will increase the production of surfactants, which will further the market expansion of SLS and LABSA.

SLS and LABSA Market

The use of personal care and home care products has increased.

Surfactants are surface-active substances utilized in various laundry and personal care products as foaming, dispersing, emulsifying, solubilizing, and cleaning agents. The hydrophilic end of anionic surfactant molecules is negatively charged. These molecules give the substrates and filth particles a negative charge, which causes them to reject one another and gives these surfactants extraordinary cleaning power. SLS works well as a cleaning agent and surfactant.

Soaps, hand washes, facial cleaners, makeup removers, and body washes are just a few of the personal care and home care products that are frequently made with them. When stirred, anionic surfactants generate a lot of foam. Due to these qualities, anionic surfactants are used as the main active ingredients in soaps and chemical detergents. Consequently, this is anticipated to help fuel the expansion of the SLS and LABSA markets shortly.

Industrial and institutional cleaning are receiving more attention.

Cleanliness and hygiene are becoming increasingly important in the industrial and institutional cleaning sector, which includes businesses, lodging facilities, hospitals, and other organizations. The demand for LABSA is fueled by the fact that LABSA is a crucial component of the detergent formulas used in these industries. According to projections, the industrial and institutional cleaning product market would increase at a CAGR of 4.8% from 2023 to 2027, reaching USD 68 billion. This indicates the rising demand for LABSA, driven by the demand for institutional and industrial cleaning products.

Environmental regulations that are strict and a growing awareness of sustainability

Strict environmental restrictions and growing consumer and industry awareness of sustainability challenges the SLS and LABSA markets. Surfactants, such as SLS and LABSA, may lead to water pollution, aquatic toxicity, and other environmental problems, raising concerns about their environmental effects. Regulations and standards have been established to restrict the use of specific surfactants in different applications. For instance, the Cosmetic Regulation (EC) No. 1223/2009, which restricts the concentration of SLS in cosmetic formulations, governs the use of SLS in cosmetic goods in the European Union.

Similarly, several nations and areas have enacted rules and regulations to limit the use of surfactants, including LABSA, in commercial and home products because of their possible negative effects on the environment. Additionally, consumers and businesses are becoming more conscious of sustainability, and there is a growing need for sustainable alternatives to conventional surfactants like SLS and LABSA. This could limit the growth of the SLS and LABSA markets since producers could have to spend money on R&D to create and deploy sustainable surfactant substitutes.

Increasing Agrochemical Sector

Concerns regarding the simultaneous presence of many contaminants in the environment have increased due to chemical combinations’ potential synergistic or additive effects on ecosystems. Additionally, the necessity to maximize food production has been brought to attention by the rise in the global population.

In insecticides, anionic surfactants serve as adjuvants and wetting agents. SLS is used as a contact herbicide and pest deterrent. SLS-containing pesticide mixtures can be used to de-infest indoor structures. SLS can be found in needles, pellets, or powder and makes up 1% to 10% of the weight of the pesticide formulation. As a result, market statistics for SLS and LABSA are anticipated to be driven by growth in the agrochemicals industry over the coming few years.

Emerging Economies

Due to the rise in per capita disposable income, emerging economies in the Asia Pacific, like India, China, Vietnam, and Indonesia, are showing a favorable trend in the consumption of anionic surfactants. SLS and LABSA producers are also moving their production bases to these nations to obtain economies of scale due to the low manufacturing and labor costs and tax rate reductions on the manufacture of detergents.

Competitive Landscape

Key Players

The global SLS and LABSA market is highly competitive, with several key players. Some of the major players in the market and their market share are as follows:

  • BASF SE
  • Solvey
  • Kao Corporation
  • Stepan Company
  • Sinopec Jinling Petrochemical Co.Ltd.

These companies focus on product innovation, expanding their distribution channels, and mergers and acquisitions to stay ahead in the market. The major players in the global SLS and LABSA market constantly strive to stay ahead by introducing new products and innovations.

Galaxy Surfactants Limited (NSE GALAXYSURF), one of the top producers of surfactants and specialty care products with a product rating of more than 205 for the home and personal care sector, announced the debut of the ‘Galaxy Hearth TM’ specialized home care mark in June 2021. Additionally, Galaxy Hearth TM expands on the foundation of the industry’s first extremely sustainable catering solutions, which FMCG companies usually classify as washing products.

The sale of BASF’s production facility in Illinois (U.S.) to a One Rock Capital Partners, LLC subsidiary was finalized in May 2021. The portfolio of anionic surfactants and esters, as well as the business of natural vitamin E and sterols derived from vegetable oils, were included in the purchase.

Huntsman International LLC entered a sale-lease agreement in November 2020 to sell several properties in Basel, Switzerland, for around CHF 67 million and rent them back for roughly $73 million for five years. This sale resulted in a pre-tax gain of CHF 30 million, or $33 million.

Shape Your Report to Specific Countries or Regions & Enjoy 30% Off!

Summary of Key Findings

  • Growing disposable income in developing nations, rising personal hygiene and cleanliness awareness drive market growth.
  • Market segmented by type, function, end-use, and region.
  • LABSA is the most popular, while cleansing is the primary function segment. Personal care and home care are the most commonly used segments.
  • Home care end use is most commonly used.
  • North America is leading market growth; expansion for SLS and LABSA is anticipated to be fueled by the US’s rising use of personal care products.

Future Outlook

  • Positive outlook for the global SLS and LABSA market with significant growth potential in the Asia Pacific region
  • The Asia Pacific region has experienced significant urbanization and industrialization, which has raised consumer demand for household goods and cosmetics. The market for SLS and LABSA in this region is anticipated to be driven by China, India, and Southeast Asian nations.
  • Key players to focus on product innovation, expanding market reach and maintaining competitive pricing to stay ahead.

Segmentation

  • By Type
    • Sodium Lauryl Sulfate (SLS)
    • Linear Alkyl Benzene Sulfonic Acid
  • By Function
    • Cleansing
    • Emulsifying
    • Wetting
    • Coupling
    • Mercerizing
    • Others
  • By End-Use
    • Personal Care
    • Home Care
    • Pharmaceuticals
    • Textiles
    • Food and Beverages
    • Industrial and Institutional Cleaning
    • Agrochemicals
    • Others
  • By Region
  • North America
    • The US.
    • Canada
    • Mexico
  • Europe
    • Germany
    • France
    • The U.K.
    • Italy
    • Spain
    • Rest of Europe
  • Asia Pacific
    • China
    • Japan
    • India
    • South Korea
    • South-east Asia
    • Rest of Asia Pacific
  • Latin America
    • Brazil
    • Argentina
    • Rest of Latin America
  • Middle East & Africa
    • GCC Countries
    • South Africa
    • Rest of the Middle East and Africa

1. Preface
1.1. Report Description
1.1.1. Purpose of the Report
1.1.2. Target Audience
1.1.3. USP and Key Offerings
1.2. Research Scope
1.3. Research Methodology
1.3.1. Phase I – Secondary Research
1.3.2. Phase II – Data Modelling
1.3.2.1. Company Share Analysis Model
1.3.2.2. Revenue Based Modelling
1.3.3. Phase III – Primary Research
1.3.4. Research Limitations
1.3.5. Assumptions
1.4. Market Introduction
1.5. Market Research Scope

2. Executive Summary
2.1. Market Snapshot: Global SLS and LABSA Market
2.2. Global SLS and LABSA Market, By Type
2.3. Global SLS and LABSA Market, By Function
2.4. Global SLS and LABSA Market, By End-Use
2.5. Global SLS and LABSA Market, By Region

3. Market Dynamics & Factors Analysis
3.1. Introduction
3.1.1. Global SLS and LABSA Market Value, 2017-2030, (US$ Bn)
3.1.2. Y-o-Y Growth Trend Analysis
3.2. Market Dynamics
3.2.1. Market Drivers
3.2.1.1. Driver 1
3.2.1.2. Driver 2
3.2.1.3. Driver 3
3.2.2. Market Restraints
3.2.2.1. Restraint 1
3.2.2.2. Restraint 2
3.2.3. Market Opportunities
3.2.3.1. Opportunity 1
3.2.3.2. Opportunity 2
3.2.4. Major Industry Challenges
3.2.4.1. Challenge 1
3.2.4.2. Challenge 2
3.3. Growth and Development Patterns
3.4. Investment Feasibility Analysis
3.5. Market Opportunity Analysis
3.5.1. Type
3.5.2. Function
3.5.3. End-Use
3.5.4. Geography

4. Premium Insights
4.1. STAR (Situation, Task, Action, Results) Analysis
4.2. Porter’s Five Forces Analysis
4.2.1. Threat of New Entrants
4.2.2. Bargaining Power of Buyers/Consumers
4.2.3. Bargaining Power of Suppliers
4.2.4. Threat of Substitute Types
4.2.5. Intensity of Competitive Rivalry
4.3. Key Market Trends
4.3.1. Demand Side Trends
4.3.2. Supply Side Trends
4.4. Value Chain Analysis
4.5. Type Analysis
4.6. Analysis and Recommendations
4.7. Marketing Strategy Analysis
4.7.1. Direct Marketing
4.7.2. Indirect Marketing
4.7.3. Marketing Channel Development Trend

5. Market Positioning of Key Players, 2022
5.1. Company market share of key players, 2022
5.2. Competitive Benchmarking
5.3. Market Positioning of Key Vendors
5.4. Geographical Presence Analysis
5.5. Major Strategies Adopted by Key Players
5.5.1. Key Strategies Analysis
5.5.2. Mergers and Acquisitions
5.5.3. Partnerships
5.5.4. Product Launch
5.5.5. Geographical Expansion
5.5.6. Others

6. Economic Impact Analysis
6.1. Recession Impact
6.1.1. North America
6.1.2. Europe
6.1.3. Asia Pacific
6.1.4. Latin America
6.1.5. Middle East and Africa
6.2. Ukraine-Russia War Impact
6.2.1. North America
6.2.2. Europe
6.2.3. Asia Pacific
6.2.4. Latin America
6.2.5. Middle East and Africa
6.3. COVID-19 Impact Analysis
6.3.1. North America
6.3.2. Europe
6.3.3. Asia Pacific
6.3.4. Latin America
6.3.5. Middle East and Africa

7. Global SLS and LABSA Market, By Type
7.1. Global SLS and LABSA Market Overview, by Type
7.1.1. Global SLS and LABSA Market Revenue Share, By Type, 2022 Vs 2030 (in %)
7.2. Sodium Lauryl Sulfate (SLS)
7.2.1. Global SLS and LABSA Market, By Region, 2017-2030 (US$ Bn)
7.3. Linear Alkyl Benzene Sulfonic Acid
7.3.1. Global SLS and LABSA Market, By Region, 2017-2030 (US$ Bn)

8. Global SLS and LABSA Market, By Function
8.1. Global SLS and LABSA Market Overview, by Function
8.1.1. Global SLS and LABSA Market, By Function, 2022 vs 2030 (in %)
8.2. Cleansing
8.2.1. Global SLS and LABSA Market, By Region, 2017-2030 (US$ Bn)
8.3. Emulsifying
8.3.1. Global SLS and LABSA Market, By Region, 2017-2030 (US$ Bn)
8.4. Wetting
8.4.1. Global SLS and LABSA Market, By Region, 2017-2030 (US$ Bn)
8.5. Coupling
8.5.1. Global SLS and LABSA Market, By Region, 2017-2030 (US$ Bn)
8.6. Mercerizing
8.6.1. Global SLS and LABSA Market, By Region, 2017-2030 (US$ Bn)
8.7. Others
8.7.1. Global SLS and LABSA Market, By Region, 2017-2030 (US$ Bn)

9. Global SLS and LABSA Market, by End-Use, 2017-2030 (US$ Bn)
9.1. Global SLS and LABSA Market Overview, by End-Use
9.1.1. Global SLS and LABSA Market, By End-Use, 2022 vs 2030 (in%)
9.2. Personal Care
9.2.1. Global SLS and LABSA Market, By Region, 2017-2030 (US$ Bn)
9.3. Home Care
9.3.1. Global SLS and LABSA Market, By Region, 2017-2030 (US$ Bn)
9.4. Pharmaceuticals
9.4.1. Global SLS and LABSA Market, By Region, 2017-2030 (US$ Bn)
9.5. Textiles
9.5.1. Global SLS and LABSA Market, By Region, 2017-2030 (US$ Bn)
9.6. Food and Beverages
9.6.1. Global SLS and LABSA Market, By Region, 2017-2030 (US$ Bn)
9.7. Industrial and Institutional Cleaning
9.7.1. Global SLS and LABSA Market, By Region, 2017-2030 (US$ Bn)
9.8. Agrochemicals
9.8.1. Global SLS and LABSA Market, By Region, 2017-2030 (US$ Bn)
9.9. Others
9.9.1. Global SLS and LABSA Market, By Region, 2017-2030 (US$ Bn)

10. Global SLS and LABSA Market, By Region
10.1. Global SLS and LABSA Market Overview, by Region
10.1.1. Global SLS and LABSA Market, By Region, 2022 vs 2030 (in%)
10.2. Type
10.2.1. Global SLS and LABSA Market, By Type, 2017-2030 (US$ Bn)
10.3. Function
10.3.1. Global SLS and LABSA Market, By Function, 2017-2030 (US$ Bn)
10.4. End-Use
10.4.1. Global SLS and LABSA Market, By End-Use, 2017-2030 (US$ Bn)

11. North America SLS and LABSA Market Analysis
11.1. North America SLS and LABSA Market, by Type, 2017-2030(US$ Bn)
11.1.1. Overview
11.1.2. SRC Analysis
11.2. North America SLS and LABSA Market, by Function, 2017-2030(US$ Bn)
11.2.1. Overview
11.2.2. SRC Analysis
11.3. North America SLS and LABSA Market, by End-Use, 2017-2030(US$ Bn)
11.3.1. Overview
11.3.2. SRC Analysis
11.4. North America SLS and LABSA Market, by Country, 2017-2030 (US$ Bn)
11.4.1. North America SLS and LABSA Market, by Country, 2022 Vs 2030 (in%)
11.4.2. U.S.
11.4.2.1. U.S. SLS and LABSA Market Estimates and Forecast, 2017-2030 (US$ Bn)
11.4.2.2. U.S. SLS and LABSA, By Type, 2017-2030 (US$ Bn)
11.4.2.3. U.S. SLS and LABSA, By Function, 2017-2030 (US$ Bn)
11.4.2.4. U.S. SLS and LABSA, By End-Use, 2017-2030 (US$ Bn)
11.4.3. Canada
11.4.3.1. Canada SLS and LABSA Market Estimates and Forecast, 2017-2030 (US$ Bn)
11.4.3.2. Canada SLS and LABSA, By Type, 2017-2030 (US$ Bn)
11.4.3.3. Canada SLS and LABSA, By Function, 2017-2030 (US$ Bn)
11.4.3.4. Canada SLS and LABSA, By End-Use, 2017-2030 (US$ Bn)
11.4.4. Mexico
11.4.4.1. Mexico SLS and LABSA Market Estimates and Forecast, 2017-2030 (US$ Bn)
11.4.4.2. Mexico SLS and LABSA, By Type, 2017-2030 (US$ Bn)
11.4.4.3. Mexico SLS and LABSA, By Function, 2017-2030 (US$ Bn)
11.4.4.4. Mexico SLS and LABSA, By End-Use, 2017-2030 (US$ Bn)

12. Europe SLS and LABSA Market Analysis
12.1. Europe SLS and LABSA Market, by Type, 2017-2030(US$ Bn)
12.1.1. Overview
12.1.2. SRC Analysis
12.2. Europe SLS and LABSA Market, by Function, 2017-2030(US$ Bn)
12.2.1. Overview
12.2.2. SRC Analysis
12.3. Europe SLS and LABSA Market, by End-Use, 2017-2030(US$ Bn)
12.3.1. Overview
12.3.2. SRC Analysis
12.4. Europe SLS and LABSA Market, by Country, 2017-2030 (US$ Bn)
12.4.1. Europe SLS and LABSA Market, by Country, 2022 Vs 2030 (in%)
12.4.2. Germany
12.4.2.1. Germany SLS and LABSA Market Estimates and Forecast, 2017-2030 (US$ Bn)
12.4.2.2. Germany SLS and LABSA, By Type, 2017-2030 (US$ Bn)
12.4.2.3. Germany SLS and LABSA, By Function, 2017-2030 (US$ Bn)
12.4.2.4. Germany SLS and LABSA, By End-Use, 2017-2030 (US$ Bn)
12.4.3. France
12.4.3.1. France SLS and LABSA Market Estimates and Forecast, 2017-2030 (US$ Bn)
12.4.3.2. France SLS and LABSA, By Type, 2017-2030 (US$ Bn)
12.4.3.3. France SLS and LABSA, By Function, 2017-2030 (US$ Bn)
12.4.3.4. France SLS and LABSA, By End-Use, 2017-2030 (US$ Bn)
12.4.4. UK
12.4.4.1. UK SLS and LABSA Market Estimates and Forecast, 2017-2030 (US$ Bn)
12.4.4.2. UK SLS and LABSA, By Type, 2017-2030 (US$ Bn)
12.4.4.3. UK SLS and LABSA, By Function, 2017-2030 (US$ Bn)
12.4.4.4. UK SLS and LABSA, By End-Use, 2017-2030 (US$ Bn)
12.4.5. Italy
12.4.5.1. Italy SLS and LABSA Market Estimates and Forecast, 2017-2030 (US$ Bn)
12.4.5.2. Italy SLS and LABSA, By Type, 2017-2030 (US$ Bn)
12.4.5.3. Italy SLS and LABSA, By Function, 2017-2030 (US$ Bn)
12.4.5.4. Italy SLS and LABSA, By End-Use, 2017-2030 (US$ Bn)
12.4.6. Spain
12.4.6.1. Spain SLS and LABSA Market Estimates and Forecast, 2017-2030 (US$ Bn)
12.4.6.2. Spain SLS and LABSA, By Type, 2017-2030 (US$ Bn)
12.4.6.3. Spain SLS and LABSA, By Function, 2017-2030 (US$ Bn)
12.4.6.4. Spain SLS and LABSA, By End-Use, 2017-2030 (US$ Bn)
12.4.7. Rest of Europe
12.4.7.1. Rest of Europe SLS and LABSA Market Estimates and Forecast, 2017-2030 (US$ Bn)
12.4.7.2. Rest of Europe SLS and LABSA, By Type, 2017-2030 (US$ Bn)
12.4.7.3. Rest of Europe SLS and LABSA, By Function, 2017-2030 (US$ Bn)
12.4.7.4. Rest of Europe SLS and LABSA, By End-Use, 2017-2030 (US$ Bn)

13. Asia Pacific SLS and LABSA Market Analysis
13.1. Asia Pacific SLS and LABSA Market, by Type, 2017-2030(US$ Bn)
13.1.1. Overview
13.1.2. SRC Analysis
13.2. Asia Pacific SLS and LABSA Market, by Function, 2017-2030(US$ Bn)
13.2.1. Overview
13.2.2. SRC Analysis
13.3. Asia Pacific SLS and LABSA Market, by End-Use, 2017-2030(US$ Bn)
13.3.1. Overview
13.3.2. SRC Analysis
13.4. Asia Pacific SLS and LABSA Market, by Country, 2017-2030 (US$ Bn)
13.4.1. Asia Pacific SLS and LABSA Market, by Country, 2022 Vs 2030 (in%)
13.4.2. China
13.4.2.1. China SLS and LABSA Market Estimates and Forecast, 2017-2030 (US$ Bn)
13.4.2.2. China SLS and LABSA, By Type, 2017-2030 (US$ Bn)
13.4.2.3. China SLS and LABSA, By Function, 2017-2030 (US$ Bn)
13.4.2.4. China SLS and LABSA, By End-Use, 2017-2030 (US$ Bn)
13.4.3. Japan
13.4.3.1. Japan SLS and LABSA Market Estimates and Forecast, 2017-2030 (US$ Bn)
13.4.3.2. Japan SLS and LABSA, By Type, 2017-2030 (US$ Bn)
13.4.3.3. Japan SLS and LABSA, By Function, 2017-2030 (US$ Bn)
13.4.3.4. Japan SLS and LABSA, By End-Use, 2017-2030 (US$ Bn)
13.4.4. India
13.4.4.1. India SLS and LABSA Market Estimates and Forecast, 2017-2030 (US$ Bn)
13.4.4.2. India SLS and LABSA, By Type, 2017-2030 (US$ Bn)
13.4.4.3. India SLS and LABSA, By Function, 2017-2030 (US$ Bn)
13.4.4.4. India SLS and LABSA, By End-Use, 2017-2030 (US$ Bn)
13.4.5. South Korea
13.4.5.1. South Korea SLS and LABSA Market Estimates and Forecast, 2017-2030 (US$ Bn)
13.4.5.2. South Korea SLS and LABSA, By Type, 2017-2030 (US$ Bn)
13.4.5.3. South Korea SLS and LABSA, By Function, 2017-2030 (US$ Bn)
13.4.5.4. South Korea SLS and LABSA, By End-Use, 2017-2030 (US$ Bn)
13.4.6. South-East Asia
13.4.6.1. South-East Asia SLS and LABSA Market Estimates and Forecast, 2017-2030 (US$ Bn)
13.4.6.2. South-East Asia SLS and LABSA, By Type, 2017-2030 (US$ Bn)
13.4.6.3. South-East Asia SLS and LABSA, By Function, 2017-2030 (US$ Bn)
13.4.6.4. South-East Asia SLS and LABSA, By End-Use, 2017-2030 (US$ Bn)
13.4.7. Rest of Asia Pacific
13.4.7.1. Rest of Asia Pacific SLS and LABSA Market Estimates and Forecast, 2017-2030 (US$ Bn)
13.4.7.2. Rest of Asia Pacific SLS and LABSA, By Type, 2017-2030 (US$ Bn)
13.4.7.3. Rest of Asia Pacific SLS and LABSA, By Function, 2017-2030 (US$ Bn)
13.4.7.4. Rest of Asia Pacific SLS and LABSA, By End-Use, 2017-2030 (US$ Bn)

14. Latin America SLS and LABSA Market Analysis
14.1. Latin America SLS and LABSA Market, by Type, 2017-2030(US$ Bn)
14.1.1. Overview
14.1.2. SRC Analysis
14.2. Latin America SLS and LABSA Market, by Function, 2017-2030(US$ Bn)
14.2.1. Overview
14.2.2. SRC Analysis
14.3. Latin America SLS and LABSA Market, by End-Use, 2017-2030(US$ Bn)
14.3.1. Overview
14.3.2. SRC Analysis
14.4. Latin America SLS and LABSA Market, by Country, 2017-2030 (US$ Bn)
14.4.1. Latin America SLS and LABSA Market, by Country, 2022 Vs 2030 (in%)
14.4.2. Brazil
14.4.2.1. Brazil SLS and LABSA Market Estimates and Forecast, 2017-2030 (US$ Bn)
14.4.2.2. Brazil SLS and LABSA, By Type, 2017-2030 (US$ Bn)
14.4.2.3. Brazil SLS and LABSA, By Function, 2017-2030 (US$ Bn)
14.4.2.4. Brazil SLS and LABSA, By End-Use, 2017-2030 (US$ Bn)
14.4.3. Argentina
14.4.3.1. Argentina SLS and LABSA Market Estimates and Forecast, 2017-2030 (US$ Bn)
14.4.3.2. Argentina SLS and LABSA, By Type, 2017-2030 (US$ Bn)
14.4.3.3. Argentina SLS and LABSA, By Function, 2017-2030 (US$ Bn)
14.4.3.4. Argentina SLS and LABSA, By End-Use, 2017-2030 (US$ Bn)
14.4.4. Rest of Latin America
14.4.4.1. Rest of Latin America SLS and LABSA Market Estimates and Forecast, 2017-2030 (US$ Bn)
14.4.4.2. Rest of Latin America SLS and LABSA, By Type, 2017-2030 (US$ Bn)
14.4.4.3. Rest of Latin America SLS and LABSA, By Function, 2017-2030 (US$ Bn)
14.4.4.4. Rest of Latin America SLS and LABSA, By End-Use, 2017-2030 (US$ Bn)

15. Middle East and Africa SLS and LABSA Market Analysis
15.1. Middle East and Africa SLS and LABSA Market, by Type, 2017-2030(US$ Bn)
15.1.1. Overview
15.1.2. SRC Analysis
15.2. Middle East and Africa SLS and LABSA Market, by Function, 2017-2030(US$ Bn)
15.2.1. Overview
15.2.2. SRC Analysis
15.3. Middle East and Africa SLS and LABSA Market, by End-Use, 2017-2030(US$ Bn)
15.3.1. Overview
15.3.2. SRC Analysis
15.4. Middle East and Africa SLS and LABSA Market, by Country, 2017-2030 (US$ Bn)
15.4.1. Middle East and Africa SLS and LABSA Market, by Country, 2022 Vs 2030 (in%)
15.4.2. GCC Countries
15.4.2.1. GCC Countries SLS and LABSA Market Estimates and Forecast, 2017-2030 (US$ Bn)
15.4.2.2. GCC Countries SLS and LABSA, By Type, 2017-2030 (US$ Bn)
15.4.2.3. GCC Countries SLS and LABSA, By Function, 2017-2030 (US$ Bn)
15.4.2.4. GCC Countries SLS and LABSA, By End-Use, 2017-2030 (US$ Bn)
15.4.3. South Africa
15.4.3.1. South Africa SLS and LABSA Market Estimates and Forecast, 2017-2030 (US$ Bn)
15.4.3.2. South Africa SLS and LABSA, By Type, 2017-2030 (US$ Bn)
15.4.3.3. South Africa SLS and LABSA, By Function, 2017-2030 (US$ Bn)
15.4.3.4. South Africa SLS and LABSA, By End-Use, 2017-2030 (US$ Bn)
15.4.4. Rest of Middle East and Africa
15.4.4.1. Rest of Middle East and Africa SLS and LABSA Market Estimates and Forecast, 2017-2030 (US$ Bn)
15.4.4.2. Rest of Middle East and Africa SLS and LABSA, By Type, 2017-2030 (US$ Bn)
15.4.4.3. Rest of Middle East and Africa SLS and LABSA, By Function, 2017-2030 (US$ Bn)
15.4.4.4. Rest of Middle East and Africa SLS and LABSA, By End-Use, 2017-2030 (US$ Bn)

16. Company Profiles
16.1. BASF SE
16.1.1. Company Overview
16.1.2. Products/Services Portfolio
16.1.3. Geographical Presence
16.1.4. Financial Summary
16.1.4.1. Market Revenue and Net Profit (2019-2022)
16.1.4.2. Business Segment Revenue Analysis
16.1.4.3. Geographical Revenue Analysis
16.2. Solvey
16.3. Kao Corporation
16.4. Stepan Company
16.5. Sinopec Jinling Petrochemical Co.Ltd.

List of Figures
FIG. 1 Global SLS and LABSA Market: Research Methodology
FIG. 2 Market Size Estimation – Top Down & Bottom up Approach
FIG. 3 Global SLS and LABSA Market Segmentation
FIG. 4 Global SLS and LABSA Market, by Type, 2022 (US$ Bn)
FIG. 5 Global SLS and LABSA Market, by Function, 2022 (US$ Bn)
FIG. 6 Global SLS and LABSA Market, by End-Use, 2022 (US$ Bn)
FIG. 7 Global SLS and LABSA Market, by Geography, 2022 (US$ Bn)
FIG. 8 Attractive Investment Proposition, by Type, 2022
FIG. 9 Attractive Investment Proposition, by Function, 2022
FIG. 10 Attractive Investment Proposition, by End-Use, 2022
FIG. 11 Attractive Investment Proposition, by Geography, 2022
FIG. 12 Global Market Share Analysis of Key SLS and LABSA Market Manufacturers, 2022
FIG. 13 Global Market Positioning of Key SLS and LABSA Market Manufacturers, 2022
FIG. 14 Global SLS and LABSA Market Value Contribution, By Type, 2022 & 2030 (Value %)
FIG. 15 Global SLS and LABSA Market, by Sodium Lauryl Sulfate (SLS), Value, 2017-2030 (US$ Bn)
FIG. 16 Global SLS and LABSA Market, by Linear Alkyl Benzene Sulfonic Acid, Value, 2017-2030 (US$ Bn)
FIG. 17 Global SLS and LABSA Market Value Contribution, By Function, 2022 & 2030 (Value %)
FIG. 18 Global SLS and LABSA Market, by Cleansing, Value, 2017-2030 (US$ Bn)
FIG. 19 Global SLS and LABSA Market, by Emulsifying, 2017-2030 (US$ Bn)
FIG. 20 Global SLS and LABSA Market, by Wetting, 2017-2030 (US$ Bn)
FIG. 21 Global SLS and LABSA Market, by Coupling, 2017-2030 (US$ Bn)
FIG. 22 Global SLS and LABSA Market, by Mercerizing, 2017-2030 (US$ Bn)
FIG. 23 Global SLS and LABSA Market, by Others, 2017-2030 (US$ Bn)
FIG. 24 Global SLS and LABSA Market Value Contribution, By End-Use, 2022 & 2030 (Value %)
FIG. 25 Global SLS and LABSA Market, by Personal Care, Value, 2017-2030 (US$ Bn)
FIG. 26 Global SLS and LABSA Market, by Home Care, 2017-2030 (US$ Bn)
FIG. 27 Global SLS and LABSA Market, by Pharmaceuticals, 2017-2030 (US$ Bn)
FIG. 28 Global SLS and LABSA Market, by Textiles, 2017-2030 (US$ Bn)
FIG. 29 Global SLS and LABSA Market, by Food and Beverages, 2017-2030 (US$ Bn)
FIG. 30 Global SLS and LABSA Market, by Industrial and Institutional Cleaning, 2017-2030 (US$ Bn)
FIG. 31 Global SLS and LABSA Market, by Agrochemicals, 2017-2030 (US$ Bn)
FIG. 32 Global SLS and LABSA Market, by Others, 2017-2030 (US$ Bn)
FIG. 33 North America SLS and LABSA Market, 2017-2030 (US$ Bn)
FIG. 34 U.S. SLS and LABSA Market, 2017-2030 (US$ Bn)
FIG. 35 Canada SLS and LABSA Market, 2017-2030 (US$ Bn)
FIG. 36 Europe SLS and LABSA Market, 2017-2030 (US$ Bn)
FIG. 37 Germany SLS and LABSA Market, 2017-2030 (US$ Bn)
FIG. 38 France SLS and LABSA Market, 2017-2030 (US$ Bn)
FIG. 39 U.K. SLS and LABSA Market, 2017-2030 (US$ Bn)
FIG. 40 Italy SLS and LABSA Market, 2017-2030 (US$ Bn)
FIG. 41 Spain SLS and LABSA Market, 2017-2030 (US$ Bn)
FIG. 42 Rest of Europe SLS and LABSA Market, 2017-2030 (US$ Bn)
FIG. 43 Asia Pacific SLS and LABSA Market, 2017-2030 (US$ Bn)
FIG. 44 China SLS and LABSA Market, 2017-2030 (US$ Bn)
FIG. 45 Japan SLS and LABSA Market, 2017-2030 (US$ Bn)
FIG. 46 India SLS and LABSA Market, 2017-2030 (US$ Bn)
FIG. 47 South Korea SLS and LABSA Market, 2017-2030 (US$ Bn)
FIG. 48 South-East Asia SLS and LABSA Market, 2017-2030 (US$ Bn)
FIG. 49 Rest of Asia Pacific SLS and LABSA Market, 2017-2030 (US$ Bn)
FIG. 50 Latin America SLS and LABSA Market, 2017-2030 (US$ Bn)
FIG. 51 Brazil SLS and LABSA Market, 2017-2030 (US$ Bn)
FIG. 52 Mexico SLS and LABSA Market, 2017-2030 (US$ Bn)
FIG. 53 Rest of Latin America SLS and LABSA Market, 2017-2030 (US$ Bn)
FIG. 54 Middle East & Africa SLS and LABSA Market, 2017-2030 (US$ Bn)
FIG. 55 GCC Countries SLS and LABSA Market, 2017-2030 (US$ Bn)
FIG. 56 South Africa SLS and LABSA Market, 2017-2030 (US$ Bn)
FIG. 57 Rest of Middle East and Africa SLS and LABSA Market, 2017-2030 (US$ Bn)

List of Tables
TABLE 1 Market Snapshot: Global SLS and LABSA Market
TABLE 2 Global SLS and LABSA Market: Market Drivers Impact Analysis
TABLE 3 Global SLS and LABSA Market: Market Restraints Impact Analysis
TABLE 4 Global SLS and LABSA Market, by Competitive Benchmarking, 2022
TABLE 5 Global SLS and LABSA Market, by Geographical Presence Analysis, 2022
TABLE 6 Global SLS and LABSA Market, by Key Strategies Analysis, 2022
TABLE 7 Global SLS and LABSA Market, by Sodium Lauryl Sulfate (SLS), By Region, 2017-2022 (US$ Bn)
TABLE 8 Global SLS and LABSA Market, by Sodium Lauryl Sulfate (SLS), By Region, 2023-2030 (US$ Bn)
TABLE 9 Global SLS and LABSA Market, by Linear Alkyl Benzene Sulfonic Acid, By Region, 2017-2022 (US$ Bn)
TABLE 10 Global SLS and LABSA Market, by Linear Alkyl Benzene Sulfonic Acid, By Region, 2023-2030 (US$ Bn)
TABLE 11 Global SLS and LABSA Market, by Cleansing, By Region, 2017-2022 (US$ Bn)
TABLE 12 Global SLS and LABSA Market, by Cleansing, By Region, 2023-2030 (US$ Bn)
TABLE 13 Global SLS and LABSA Market, by Emulsifying, By Region, 2017-2022 (US$ Bn)
TABLE 14 Global SLS and LABSA Market, by Emulsifying, By Region, 2023-2030 (US$ Bn)
TABLE 15 Global SLS and LABSA Market, by Wetting, By Region, 2017-2022 (US$ Bn)
TABLE 16 Global SLS and LABSA Market, by Wetting, By Region, 2023-2030 (US$ Bn)
TABLE 17 Global SLS and LABSA Market, by Coupling, By Region, 2017-2022 (US$ Bn)
TABLE 18 Global SLS and LABSA Market, by Coupling, By Region, 2023-2030 (US$ Bn)
TABLE 19 Global SLS and LABSA Market, by Mercerizing, By Region, 2017-2022 (US$ Bn)
TABLE 20 Global SLS and LABSA Market, by Mercerizing, By Region, 2023-2030 (US$ Bn)
TABLE 21 Global SLS and LABSA Market, by Others, By Region, 2017-2022 (US$ Bn)
TABLE 22 Global SLS and LABSA Market, by Others, By Region, 2023-2030 (US$ Bn)
TABLE 23 Global SLS and LABSA Market, by Personal Care, By Region, 2017-2022 (US$ Bn)
TABLE 24 Global SLS and LABSA Market, by Personal Care, By Region, 2023-2030 (US$ Bn)
TABLE 25 Global SLS and LABSA Market, by Home Cares, By Region, 2017-2022 (US$ Bn)
TABLE 26 Global SLS and LABSA Market, by Home Cares, By Region, 2023-2030 (US$ Bn)
TABLE 27 Global SLS and LABSA Market, by Pharmaceuticals, By Region, 2017-2022 (US$ Bn)
TABLE 28 Global SLS and LABSA Market, by Pharmaceuticals, By Region, 2023-2030 (US$ Bn)
TABLE 29 Global SLS and LABSA Market, by Textiles, By Region, 2017-2022 (US$ Bn)
TABLE 30 Global SLS and LABSA Market, by Textiles, By Region, 2023-2030 (US$ Bn)
TABLE 31 Global SLS and LABSA Market, by Food and Beverages, By Region, 2017-2022 (US$ Bn)
TABLE 32 Global SLS and LABSA Market, by Food and Beverages, By Region, 2023-2030 (US$ Bn)
TABLE 33 Global SLS and LABSA Market, by Industrial and Institutional Cleaning, By Region, 2017-2022 (US$ Bn)
TABLE 34 Global SLS and LABSA Market, by Industrial and Institutional Cleaning, By Region, 2023-2030 (US$ Bn)
TABLE 35 Global SLS and LABSA Market, by Agrochemicals, By Region, 2017-2022 (US$ Bn)
TABLE 36 Global SLS and LABSA Market, by Agrochemicals, By Region, 2023-2030 (US$ Bn)
TABLE 37 Global SLS and LABSA Market, by Others, By Region, 2017-2022 (US$ Bn)
TABLE 38 Global SLS and LABSA Market, by Others, By Region, 2023-2030 (US$ Bn)
TABLE 39 Global SLS and LABSA Market, by Type, 2017-2022 (US$ Bn)
TABLE 40 Global SLS and LABSA Market, by Type, 2023-2030 (US$ Bn)
TABLE 41 Global SLS and LABSA Market, by Function, 2017-2022 (US$ Bn)
TABLE 42 Global SLS and LABSA Market, by Function, 2023-2030 (US$ Bn)
TABLE 43 Global SLS and LABSA Market, by End-Use, 2017-2022 (US$ Bn)
TABLE 44 Global SLS and LABSA Market, by End-Use, 2023-2030 (US$ Bn)
TABLE 45 Global SLS and LABSA Market, by Region, 2017-2022 (US$ Bn)
TABLE 46 Global SLS and LABSA Market, by Region, 2023-2030 (US$ Bn)
TABLE 47 North America SLS and LABSA Market, by Type, 2017-2022 (US$ Bn)
TABLE 48 North America SLS and LABSA Market, by Type, 2023-2030 (US$ Bn)
TABLE 49 North America SLS and LABSA Market, by Function, 2017-2022 (US$ Bn)
TABLE 50 North America SLS and LABSA Market, by Function, 2023-2030 (US$ Bn)
TABLE 51 North America SLS and LABSA Market, by End-Use, 2017-2022 (US$ Bn)
TABLE 52 North America SLS and LABSA Market, by End-Use, 2023-2030 (US$ Bn)
TABLE 53 North America SLS and LABSA Market, by Country, 2017-2022 (US$ Bn)
TABLE 54 North America SLS and LABSA Market, by Country, 2023-2030 (US$ Bn)
TABLE 55 United States SLS and LABSA Market, by Type, 2017-2022 (US$ Bn)
TABLE 56 United States SLS and LABSA Market, by Type, 2023-2030 (US$ Bn)
TABLE 57 United States SLS and LABSA Market, by Function, 2017-2022 (US$ Bn)
TABLE 58 United States SLS and LABSA Market, by Function, 2023-2030 (US$ Bn)
TABLE 59 United States SLS and LABSA Market, by End-Use, 2017-2022 (US$ Bn)
TABLE 60 United States SLS and LABSA Market, by End-Use, 2023-2030 (US$ Bn)
TABLE 61 Canada SLS and LABSA Market, by Type, 2017-2022 (US$ Bn)
TABLE 62 Canada SLS and LABSA Market, by Type, 2023-2030 (US$ Bn)
TABLE 63 Canada SLS and LABSA Market, by Function, 2017-2022 (US$ Bn)
TABLE 64 Canada SLS and LABSA Market, by Function, 2023-2030 (US$ Bn)
TABLE 65 Canada SLS and LABSA Market, by End-Use, 2017-2022 (US$ Bn)
TABLE 66 Canada SLS and LABSA Market, by End-Use, 2023-2030 (US$ Bn)
TABLE 67 Mexico SLS and LABSA Market, by Type, 2017-2022 (US$ Bn)
TABLE 68 Mexico SLS and LABSA Market, by Type, 2023-2030 (US$ Bn)
TABLE 69 Mexico SLS and LABSA Market, by Function, 2017-2022 (US$ Bn)
TABLE 70 Mexico SLS and LABSA Market, by Function, 2023-2030 (US$ Bn)
TABLE 71 Mexico SLS and LABSA Market, by End-Use, 2017-2022 (US$ Bn)
TABLE 72 Mexico SLS and LABSA Market, by End-Use, 2023-2030 (US$ Bn)
TABLE 73 Europe SLS and LABSA Market, by Type, 2017-2022 (US$ Bn)
TABLE 74 Europe SLS and LABSA Market, by Type, 2023-2030 (US$ Bn)
TABLE 75 Europe SLS and LABSA Market, by Function, 2017-2022 (US$ Bn)
TABLE 76 Europe SLS and LABSA Market, by Function, 2023-2030 (US$ Bn)
TABLE 77 Europe SLS and LABSA Market, by End-Use, 2017-2022 (US$ Bn)
TABLE 78 Europe SLS and LABSA Market, by End-Use, 2023-2030 (US$ Bn)
TABLE 79 Europe SLS and LABSA Market, by Country, 2017-2022 (US$ Bn)
TABLE 80 Europe SLS and LABSA Market, by Country, 2023-2030 (US$ Bn)
TABLE 81 Germany SLS and LABSA Market, by Type, 2017-2022 (US$ Bn)
TABLE 82 Germany SLS and LABSA Market, by Type, 2023-2030 (US$ Bn)
TABLE 83 Germany SLS and LABSA Market, by Function, 2017-2022 (US$ Bn)
TABLE 84 Germany SLS and LABSA Market, by Function, 2023-2030 (US$ Bn)
TABLE 85 Germany SLS and LABSA Market, by End-Use, 2017-2022 (US$ Bn)
TABLE 86 Germany SLS and LABSA Market, by End-Use, 2023-2030 (US$ Bn)
TABLE 87 France SLS and LABSA Market, by Type, 2017-2022 (US$ Bn)
TABLE 88 France SLS and LABSA Market, by Type, 2023-2030 (US$ Bn)
TABLE 89 France SLS and LABSA Market, by Function, 2017-2022 (US$ Bn)
TABLE 90 France SLS and LABSA Market, by Function, 2023-2030 (US$ Bn)
TABLE 91 France SLS and LABSA Market, by End-Use, 2017-2022 (US$ Bn)
TABLE 92 France SLS and LABSA Market, by End-Use, 2023-2030 (US$ Bn)
TABLE 93 United Kingdom SLS and LABSA Market, by Type, 2017-2022 (US$ Bn)
TABLE 94 United Kingdom SLS and LABSA Market, by Type, 2023-2030 (US$ Bn)
TABLE 95 United Kingdom SLS and LABSA Market, by Function, 2017-2022 (US$ Bn)
TABLE 96 United Kingdom SLS and LABSA Market, by Function, 2023-2030 (US$ Bn)
TABLE 97 United Kingdom SLS and LABSA Market, by End-Use, 2017-2022 (US$ Bn)
TABLE 98 United Kingdom SLS and LABSA Market, by End-Use, 2023-2030 (US$ Bn)
TABLE 99 Italy SLS and LABSA Market, by Type, 2017-2022 (US$ Bn)
TABLE 100 Italy SLS and LABSA Market, by Type, 2023-2030 (US$ Bn)
TABLE 101 Italy SLS and LABSA Market, by Function, 2017-2022 (US$ Bn)
TABLE 102 Italy SLS and LABSA Market, by Function, 2023-2030 (US$ Bn)
TABLE 103 Italy SLS and LABSA Market, by End-Use, 2017-2022 (US$ Bn)
TABLE 104 Italy SLS and LABSA Market, by End-Use, 2023-2030 (US$ Bn)
TABLE 105 Spain SLS and LABSA Market, by Type, 2017-2022 (US$ Bn)
TABLE 106 Spain SLS and LABSA Market, by Type, 2023-2030 (US$ Bn)
TABLE 107 Spain SLS and LABSA Market, by Function, 2017-2022 (US$ Bn)
TABLE 108 Spain SLS and LABSA Market, by Function, 2023-2030 (US$ Bn)
TABLE 109 Spain SLS and LABSA Market, by End-Use, 2017-2022 (US$ Bn)
TABLE 110 Spain SLS and LABSA Market, by End-Use, 2023-2030 (US$ Bn)
TABLE 111 Rest of Europe SLS and LABSA Market, by Type, 2017-2022 (US$ Bn)
TABLE 112 Rest of Europe SLS and LABSA Market, by Type, 2023-2030 (US$ Bn)
TABLE 113 Rest of Europe SLS and LABSA Market, by Function, 2017-2022 (US$ Bn)
TABLE 114 Rest of Europe SLS and LABSA Market, by Function, 2023-2030 (US$ Bn)
TABLE 115 Rest of Europe SLS and LABSA Market, by End-Use, 2017-2022 (US$ Bn)
TABLE 116 Rest of Europe SLS and LABSA Market, by End-Use, 2023-2030 (US$ Bn)
TABLE 117 Asia Pacific SLS and LABSA Market, by Type, 2017-2022 (US$ Bn)
TABLE 118 Asia Pacific SLS and LABSA Market, by Type, 2023-2030 (US$ Bn)
TABLE 119 Asia Pacific SLS and LABSA Market, by Function, 2017-2022 (US$ Bn)
TABLE 120 Asia Pacific SLS and LABSA Market, by Function, 2023-2030 (US$ Bn)
TABLE 121 Asia Pacific SLS and LABSA Market, by End-Use, 2017-2022 (US$ Bn)
TABLE 122 Asia Pacific SLS and LABSA Market, by End-Use, 2023-2030 (US$ Bn)
TABLE 123 China SLS and LABSA Market, by Type, 2017-2022 (US$ Bn)
TABLE 124 China SLS and LABSA Market, by Type, 2023-2030 (US$ Bn)
TABLE 125 China SLS and LABSA Market, by Function, 2017-2022 (US$ Bn)
TABLE 126 China SLS and LABSA Market, by Function, 2023-2030 (US$ Bn)
TABLE 127 China SLS and LABSA Market, by End-Use, 2017-2022 (US$ Bn)
TABLE 128 China SLS and LABSA Market, by End-Use, 2023-2030 (US$ Bn)
TABLE 129 Japan SLS and LABSA Market, by Type, 2017-2022 (US$ Bn)
TABLE 130 Japan SLS and LABSA Market, by Type, 2023-2030 (US$ Bn)
TABLE 131 Japan SLS and LABSA Market, by Function, 2017-2022 (US$ Bn)
TABLE 132 Japan SLS and LABSA Market, by Function, 2023-2030 (US$ Bn)
TABLE 133 Japan SLS and LABSA Market, by End-Use, 2017-2022 (US$ Bn)
TABLE 134 Japan SLS and LABSA Market, by End-Use, 2023-2030 (US$ Bn)
TABLE 135 India SLS and LABSA Market, by Type, 2017-2022 (US$ Bn)
TABLE 136 India SLS and LABSA Market, by Type, 2023-2030 (US$ Bn)
TABLE 137 India SLS and LABSA Market, by Function, 2017-2022 (US$ Bn)
TABLE 138 India SLS and LABSA Market, by Function, 2023-2030 (US$ Bn)
TABLE 139 India SLS and LABSA Market, by End-Use, 2017-2022 (US$ Bn)
TABLE 140 India SLS and LABSA Market, by End-Use, 2023-2030 (US$ Bn)
TABLE 141 South Korea SLS and LABSA Market, by Type, 2017-2022 (US$ Bn)
TABLE 142 South Korea SLS and LABSA Market, by Type, 2023-2030 (US$ Bn)
TABLE 143 South Korea SLS and LABSA Market, by Function, 2017-2022 (US$ Bn)
TABLE 144 South Korea SLS and LABSA Market, by Function, 2023-2030 (US$ Bn)
TABLE 145 South Korea SLS and LABSA Market, by End-Use, 2017-2022 (US$ Bn)
TABLE 146 South Korea SLS and LABSA Market, by End-Use, 2023-2030 (US$ Bn)
TABLE 147 South-East Asia SLS and LABSA Market, by Type, 2017-2022 (US$ Bn)
TABLE 148 South-East Asia SLS and LABSA Market, by Type, 2023-2030 (US$ Bn)
TABLE 149 South-East Asia SLS and LABSA Market, by Function, 2017-2022 (US$ Bn)
TABLE 150 South-East Asia SLS and LABSA Market, by Function, 2023-2030 (US$ Bn)
TABLE 151 South-East Asia SLS and LABSA Market, by End-Use, 2017-2022 (US$ Bn)
TABLE 152 South-East Asia SLS and LABSA Market, by End-Use, 2023-2030 (US$ Bn)
TABLE 153 Rest of Asia Pacific SLS and LABSA Market, by Type, 2017-2022 (US$ Bn)
TABLE 154 Rest of Asia Pacific SLS and LABSA Market, by Type, 2023-2030 (US$ Bn)
TABLE 155 Rest of Asia Pacific SLS and LABSA Market, by Function, 2017-2022 (US$ Bn)
TABLE 156 Rest of Asia Pacific SLS and LABSA Market, by Function, 2023-2030 (US$ Bn)
TABLE 157 Rest of Asia Pacific SLS and LABSA Market, by End-Use, 2017-2022 (US$ Bn)
TABLE 158 Rest of Asia Pacific SLS and LABSA Market, by End-Use, 2023-2030 (US$ Bn)
TABLE 159 Latin America SLS and LABSA Market, by Type, 2017-2022 (US$ Bn)
TABLE 160 Latin America SLS and LABSA Market, by Type, 2023-2030 (US$ Bn)
TABLE 161 Latin America SLS and LABSA Market, by Function, 2017-2022 (US$ Bn)
TABLE 162 Latin America SLS and LABSA Market, by Function, 2023-2030 (US$ Bn)
TABLE 163 Latin America SLS and LABSA Market, by End-Use, 2017-2022 (US$ Bn)
TABLE 164 Latin America SLS and LABSA Market, by End-Use, 2023-2030 (US$ Bn)
TABLE 165 Brazil SLS and LABSA Market, by Type, 2017-2022 (US$ Bn)
TABLE 166 Brazil SLS and LABSA Market, by Type, 2023-2030 (US$ Bn)
TABLE 167 Brazil SLS and LABSA Market, by Function, 2017-2022 (US$ Bn)
TABLE 168 Brazil SLS and LABSA Market, by Function, 2023-2030 (US$ Bn)
TABLE 169 Brazil SLS and LABSA Market, by End-Use, 2017-2022 (US$ Bn)
TABLE 170 Brazil SLS and LABSA Market, by End-Use, 2023-2030 (US$ Bn)
TABLE 171 Argentina SLS and LABSA Market, by Type, 2017-2022 (US$ Bn)
TABLE 172 Argentina SLS and LABSA Market, by Type, 2023-2030 (US$ Bn)
TABLE 173 Argentina SLS and LABSA Market, by Function, 2017-2022 (US$ Bn)
TABLE 174 Argentina SLS and LABSA Market, by Function, 2023-2030 (US$ Bn)
TABLE 175 Argentina SLS and LABSA Market, by End-Use, 2017-2022 (US$ Bn)
TABLE 176 Argentina SLS and LABSA Market, by End-Use, 2023-2030 (US$ Bn)
TABLE 177 Rest of Latin America SLS and LABSA Market, by Type, 2017-2022 (US$ Bn)
TABLE 178 Rest of Latin America SLS and LABSA Market, by Type, 2023-2030 (US$ Bn)
TABLE 179 Rest of Latin America SLS and LABSA Market, by Function, 2017-2022 (US$ Bn)
TABLE 180 Rest of Latin America SLS and LABSA Market, by Function, 2023-2030 (US$ Bn)
TABLE 181 Rest of Latin America SLS and LABSA Market, by End-Use, 2017-2022 (US$ Bn)
TABLE 182 Rest of Latin America SLS and LABSA Market, by End-Use, 2023-2030 (US$ Bn)
TABLE 183 Middle East and Africa SLS and LABSA Market, by Type, 2017-2022 (US$ Bn)
TABLE 184 Middle East and Africa SLS and LABSA Market, by Type, 2023-2030 (US$ Bn)
TABLE 185 Middle East and Africa SLS and LABSA Market, by Function, 2017-2022 (US$ Bn)
TABLE 186 Middle East and Africa SLS and LABSA Market, by Function, 2023-2030 (US$ Bn)
TABLE 187 Middle East and Africa SLS and LABSA Market, by End-Use, 2017-2022 (US$ Bn)
TABLE 188 Middle East and Africa SLS and LABSA Market, by End-Use, 2023-2030 (US$ Bn)
TABLE 189 GCC Countries SLS and LABSA Market, by Type, 2017-2022 (US$ Bn)
TABLE 190 GCC Countries SLS and LABSA Market, by Type, 2023-2030 (US$ Bn)
TABLE 191 GCC Countries SLS and LABSA Market, by Function, 2017-2022 (US$ Bn)
TABLE 192 GCC Countries SLS and LABSA Market, by Function, 2023-2030 (US$ Bn)
TABLE 193 GCC Countries SLS and LABSA Market, by End-Use, 2017-2022 (US$ Bn)
TABLE 194 GCC Countries SLS and LABSA Market, by End-Use, 2023-2030 (US$ Bn)
TABLE 195 South Africa SLS and LABSA Market, by Type, 2017-2022 (US$ Bn)
TABLE 196 South Africa SLS and LABSA Market, by Type, 2023-2030 (US$ Bn)
TABLE 197 South Africa SLS and LABSA Market, by Function, 2017-2022 (US$ Bn)
TABLE 198 South Africa SLS and LABSA Market, by Function, 2023-2030 (US$ Bn)
TABLE 199 South Africa SLS and LABSA Market, by End-Use, 2017-2022 (US$ Bn)
TABLE 200 South Africa SLS and LABSA Market, by End-Use, 2023-2030 (US$ Bn)
TABLE 201 Rest of Middle East and Africa SLS and LABSA Market, by Type, 2017-2022 (US$ Bn)
TABLE 202 Rest of Middle East and Africa SLS and LABSA Market, by Type, 2023-2030 (US$ Bn)
TABLE 203 Rest of Middle East and Africa SLS and LABSA Market, by Function, 2017-2022 (US$ Bn)
TABLE 204 Rest of Middle East and Africa SLS and LABSA Market, by Function, 2023-2030 (US$ Bn)
TABLE 205 Rest of Middle East and Africa SLS and LABSA Market, by End-Use, 2017-2022 (US$ Bn)
TABLE 206 Rest of Middle East and Africa SLS and LABSA Market, by End-Use, 2023-2030 (US$ Bn)

Frequently Asked Questions

What is the current size of the global SLS and LABSA market?

The global SLS and LABSA market was valued at USD 4.7 Billion in 2022.

What is the expected growth rate of the SLS and LABSA market between 2023 and 2030?

The SLS and LABSA market is expected to grow at a CAGR of 4.50% between 2023 and 2030, reaching USD 6.4 Billion in 2030.

Which segment is leading the market share in terms of type?

Linear alkyl benzene sulfonic acid is the leading segment by material, holding over 64% share in terms of value in 2022.

Which function segment governs the demand for SLS and LABSAs in the world?

The cleansing segment governs the demand for SLS and LABSAs globally, holding a massive share of over 35% in 2022.

Which segment is expected to post the highest CAGR during the forecast period?

The agrochemicals segment is expected to post the highest CAGR during the forecast period.

Which region is fueling the growth of the SLS and LABSA industry?

North America is fueling the growth of the SLS and LABSA industry, with an over 35% share in 2022.

Who are the major players in the global SLS and LABSA market?

The top players include BASF SE; Solvey; Kao Corporation; Stepan Company; Sinopec Jinling Petrochemical Co.Ltd.

What are the major market drivers of the SLS and LABSA industry?

Growing disposable income in developing nations, rising personal hygiene and cleanliness awareness, and expanding demand for household and personal care products are the major market drivers.

What are the major market restraints of the SLS and LABSA industry?

Environmental regulations that are strict and a growing awareness of sustainability are the major market restraints.

What are the major market opportunities of the SLS and LABSA industry?

Increasing agrochemical sector and emerging economies are the major opportunities in the SLS and LABSA industry.

Purchase Options

$2999
Delivery Format: Excel.
$4999
Designed for the individual purchaser.
$6999
Users located at a single corporate site or regional office.
$7999
Allowed for unlimited sharing globally within one company.
Smallform of Sample request

Have a question?

User Profile

Don’t settle for less – trust Mitul to help you find the best solution.

Report delivery within 24 to 48 hours

– Other Info –

What people say?-

User Review

I am very impressed with the information in this report. The author clearly did their research when they came up with this product and it has already given me a lot of ideas.

Jana Schmidt
CEDAR CX Technologies

– Connect with us –

Phone

+91 6232 49 3207


support

24/7 Research Support


sales@credenceresearch.com

– Research Methodology –

Going beyond the basics: advanced techniques in research methodology

– Trusted By –

Pepshi, LG, Nestle
Motorola, Honeywell, Johnson and johnson
LG Chem, SIEMENS, Pfizer
Unilever, Samsonite, QIAGEN