| REPORT ATTRIBUTE |
DETAILS |
| Historical Period |
2020-2023 |
| Base Year |
2024 |
| Forecast Period |
2025-2032 |
| Password Management Market Size 2024 |
USD 3,810.95 million |
| Password Management Market, CAGR |
21.37% |
| Password Management Market Size 2032 |
USD 17,909.18 million |
Market Overview:
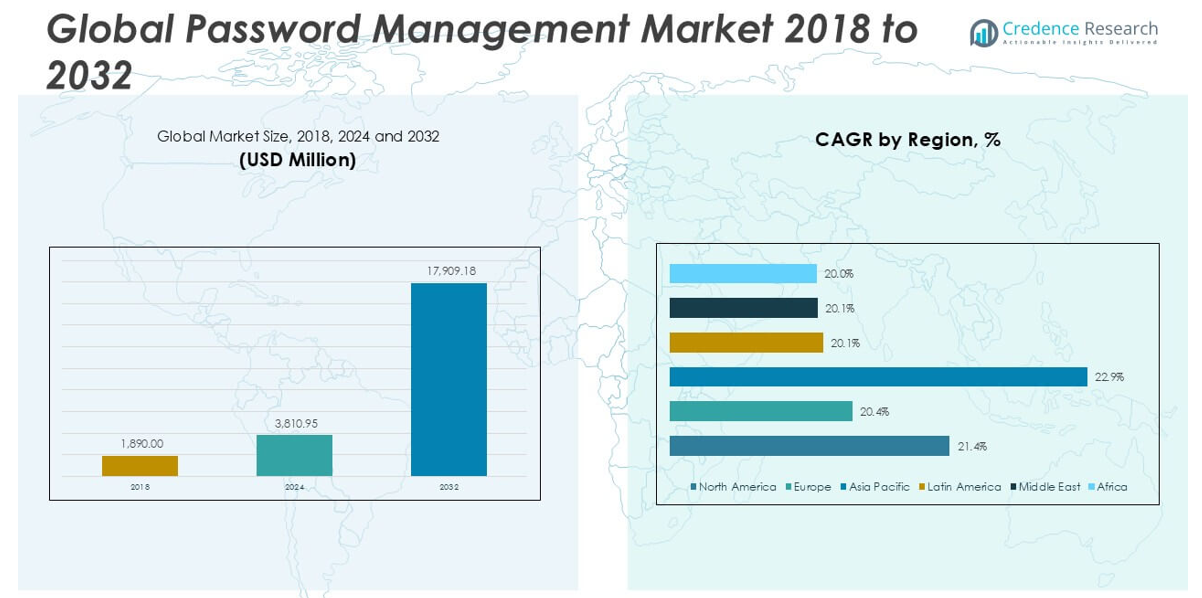
The Password Management market size was valued at USD 1,890.00 million in 2018, reached USD 3,810.95 million in 2024, and is anticipated to reach USD 17,909.18 million by 2032, growing at a CAGR of 21.37% during the forecast period.
The Password Management market is driven by key players such as 1Password, Avatier, Bravura Security Inc., Fortra, LLC (Core Security Technologies), Dashlane Inc., EmpowerID, Inc., FastPassCorp A/S, Intuit Inc., Keeper Security, Inc., LastPass US LP, Microsoft, SailPoint Technologies, Inc., Siber Systems, Inc., Trend Micro Incorporated, and Zoho Corporation Pvt. Ltd. These companies focus on expanding their product portfolios, integrating multi-factor authentication, and enhancing cloud-based solutions to strengthen their market presence. North America dominates the market with a 39.5% share in 2024, supported by advanced cybersecurity adoption, stringent regulations, and significant investments in enterprise security infrastructure, making it the leading region globally.\
Market Insights
- The Password Management market was valued at USD 1,890.00 million in 2018, reached USD 3,810.95 million in 2024, and is projected to reach USD 17,909.18 million by 2032, growing at a CAGR of 21.37% during the forecast period.
- Increasing cybersecurity threats, regulatory compliance requirements, and rising demand for self-service password management are key drivers fueling market growth globally.
- Key market trends include the growing integration of multi-factor authentication, rising adoption of mobile and voice-enabled access, and increasing demand for cloud-based password management solutions.
- The market is highly competitive, with leading players such as 1Password, Dashlane Inc., LastPass US LP, Keeper Security, Inc., Microsoft, and Zoho Corporation actively expanding through product innovation and strategic partnerships.
- North America leads with a 39.5% regional share in 2024, followed by Europe at 26.5% and Asia Pacific at 22.4%; the self-service password management segment holds the largest share at approximately 65%.
Access crucial information at unmatched prices!
Request your sample report today & start making informed decisions powered by Credence Research Inc.!
Download Sample
Market Segmentation Analysis:
By Type
In the Password Management market, the Self-Service Password Management segment holds the largest market share, accounting for approximately 65% of the total market in 2024. This dominance is driven by its ability to reduce helpdesk costs and improve user convenience by allowing end-users to reset or manage their passwords independently. The growing adoption of self-service platforms across enterprises to minimize downtime and enhance productivity further supports this segment’s growth. Additionally, the increasing demand for user-centric security solutions in large organizations significantly contributes to the segment’s leading position.
- For instance, Microsoft reported that implementing self-service password reset reduced their internal helpdesk calls by 30,000 per month, significantly lowering IT support costs.
By Access
The Desktops & Laptops sub-segment dominates the Access Segment, capturing around 50% of the market share in 2024. Its dominance is attributed to the widespread use of password management solutions in traditional workplace settings where desktops and laptops remain the primary access points. The increasing focus on securing endpoints and mitigating credential-based cyber threats drives the demand in this segment. While mobile devices and voice-enabled password systems are gaining traction, desktops and laptops remain the core platforms for password management due to their extensive usage in daily business operations.
- For instance, LastPass reported that over 70% of its active users primarily access its password manager via desktop browsers and laptop-based applications, reinforcing the platform’s strong desktop user base.
By End-Use
The BFSI (Banking, Financial Services, and Insurance) sector leads the end-use segment, holding approximately 30% of the market share in 2024. The BFSI industry’s need for stringent security measures and regulatory compliance to protect sensitive financial data is the primary growth driver. Increasing incidents of cyber-attacks and the rising adoption of digital banking platforms necessitate robust password management solutions. Additionally, the sector’s heavy reliance on multi-layered authentication and privileged access management further accelerates the adoption of password management systems within financial institutions.
Market Overview
Rising Incidents of Cybersecurity Breaches
The increasing frequency of cyberattacks and data breaches is a major growth driver for the Password Management market. Organizations are recognizing the critical need to safeguard user credentials and sensitive information from unauthorized access. Password management solutions offer enhanced security through encrypted storage, multi-factor authentication, and password generation tools that minimize human error. As cyber threats grow in sophistication, businesses across sectors are adopting robust password management systems to strengthen their cybersecurity infrastructure and comply with evolving data protection regulations.
- For instance, in 2023, Keeper Security successfully blocked over 80 million attempted brute-force password attacks across its global user base, demonstrating the effectiveness of password management in mitigating cybersecurity risks.
Growing Adoption of Cloud-Based Solutions
The widespread shift toward cloud computing significantly fuels the growth of the Password Management market. Cloud-based password management solutions offer flexibility, scalability, and remote accessibility, making them particularly attractive to businesses with distributed teams. The increasing reliance on Software-as-a-Service (SaaS) applications and cloud storage has expanded the need for centralized credential management. Cloud-based solutions enable seamless integration across multiple platforms, enhancing user convenience while providing real-time updates and security patches, which collectively drive their rapid adoption in both SMEs and large enterprises.
- For instance, Dashlane’s cloud-based platform currently secures over 2.5 billion passwords globally, offering automatic synchronization across multiple devices for over 15 million users.
Regulatory Compliance Requirements
Stringent regulatory frameworks, such as GDPR, HIPAA, and PCI DSS, are pushing organizations to strengthen their password management practices. Compliance with these regulations demands secure authentication processes, detailed access logs, and periodic password updates, all of which are efficiently managed through password management systems. Failure to comply can result in heavy penalties and reputational damage, prompting companies to invest in advanced solutions. The growing complexity of regulatory environments across industries is driving password management adoption as a critical component of corporate governance and risk management strategies.
Key Trends & Opportunities
Increasing Integration of Multi-Factor Authentication (MFA)
The integration of multi-factor authentication (MFA) with password management systems is emerging as a key trend in the market. Organizations are moving beyond traditional single-password access to implement additional security layers such as biometrics, OTPs, and smart tokens. This integration significantly enhances security by reducing the risk of credential theft and unauthorized access. As businesses aim to achieve higher security standards, the growing preference for MFA-enabled password management solutions presents a valuable opportunity for market players to offer more comprehensive, adaptive security frameworks.
- For instance, Zoho Vault has integrated MFA across its entire user base, with over 1 million active enterprise users now using MFA protocols such as biometric and time-based OTP authentication to strengthen account security.
Expanding Mobile and Voice-Enabled Access
The shift towards mobile-first work environments and voice-enabled platforms presents a promising growth opportunity for the Password Management market. Increasing demand for mobile accessibility and the rising use of smart assistants are encouraging vendors to develop password management applications compatible with mobile devices and voice-command systems. This trend enhances user convenience and productivity while maintaining high-security standards. The growing reliance on remote access solutions further supports the adoption of mobile and voice-enabled password management systems, opening new avenues for innovation and market expansion.
- For instance, 1Password’s mobile application has been downloaded over 10 million times on the Google Play Store alone, demonstrating the growing demand for mobile-accessible password management solutions
Key Challenges
User Resistance to Adoption
One of the key challenges in the Password Management market is user resistance, especially in organizations where employees are accustomed to traditional password practices. Many users perceive password management solutions as complex or time-consuming, leading to poor adoption rates. Additionally, initial training requirements and changes to login workflows can create friction. Overcoming this resistance requires user-friendly interfaces, intuitive design, and effective change management strategies to ensure smooth implementation and long-term usage across all organizational levels.
Risk of Single Point of Failure
While password management systems enhance security, they can also present a single point of failure if compromised. Centralized storage of sensitive credentials makes these systems an attractive target for cybercriminals. A breach can potentially grant attackers access to multiple applications and networks, significantly amplifying security risks. Ensuring robust encryption, multi-layered security protocols, and regular system audits is essential to mitigate this vulnerability and maintain trust in password management solutions.
Integration Complexity with Legacy Systems
Integrating password management solutions with existing legacy systems can be a significant challenge, particularly for large enterprises with outdated IT infrastructures. Compatibility issues, data migration risks, and system downtime during implementation can hinder seamless adoption. Organizations often require customized integration efforts, increasing deployment time and costs. Addressing these challenges necessitates the development of adaptable, flexible password management platforms that can smoothly integrate with diverse, legacy, and modern IT environments.
Regional Analysis
North America
North America leads the Password Management market, holding the largest regional share of 39.5% in 2024. The market size in this region grew from USD 753.54 million in 2018 to USD 1,505.04 million in 2024 and is projected to reach USD 7,105.56 million by 2032, expanding at a CAGR of 21.4%. The growth is primarily driven by the early adoption of advanced cybersecurity solutions, strict regulatory frameworks, and the presence of leading technology providers. Increasing cybersecurity breaches and rising enterprise demand for secure password management further contribute to the region’s dominance.
Europe
Europe accounts for 26.5% of the global Password Management market share in 2024. The regional market size expanded from USD 519.75 million in 2018 to USD 1,009.04 million in 2024, and it is forecasted to reach USD 4,455.32 million by 2032, growing at a CAGR of 20.4%. The surge in demand is driven by stringent data protection regulations such as GDPR and the growing emphasis on digital security across financial, healthcare, and public sectors. Europe’s strong focus on privacy, regulatory compliance, and adoption of cloud-based solutions continues to accelerate market growth.
Asia Pacific
Asia Pacific holds approximately 22.4% of the Password Management market share in 2024 and is the fastest-growing region with a CAGR of 22.9%. The market grew from USD 402.57 million in 2018 to USD 853.07 million in 2024, and it is expected to reach USD 4,440.02 million by 2032. Rapid digitization, growing cyber threats, and increasing cloud adoption across emerging economies like China, India, and Southeast Asia are key growth drivers. Expanding IT infrastructure, rising internet penetration, and the shift towards mobile and remote working environments further boost regional demand.
Latin America
Latin America represents 4.8% of the global Password Management market share in 2024. The market grew from USD 92.42 million in 2018 to USD 184.03 million in 2024 and is projected to reach USD 792.84 million by 2032, registering a CAGR of 20.1%. The increasing focus on cybersecurity, especially in the BFSI and telecom sectors, is driving growth in the region. Latin American organizations are progressively adopting password management solutions to mitigate rising cyber threats and ensure regulatory compliance. The growing awareness of data security among enterprises further supports market expansion.
Middle East
The Middle East holds 3.5% of the global Password Management market share in 2024. The regional market size rose from USD 69.93 million in 2018 to USD 131.83 million in 2024 and is expected to reach USD 565.81 million by 2032, growing at a CAGR of 20.1%. Increasing investments in digital infrastructure, smart city projects, and the rising demand for advanced cybersecurity solutions are key drivers. Enterprises across the region are focusing on improving security frameworks and adopting password management systems to protect sensitive data in sectors such as banking, government, and telecommunications.
Africa
Africa contributes 3.4% to the global Password Management market share in 2024. The market size increased from USD 51.79 million in 2018 to USD 127.95 million in 2024 and is forecasted to reach USD 549.63 million by 2032, registering a CAGR of 20.0%. Growing digitalization, rising cyber risks, and increasing cloud adoption are driving the market’s growth. While the adoption rate is slower compared to developed regions, increasing awareness of cybersecurity, expanding internet access, and governmental initiatives to improve digital security infrastructure are expected to fuel steady demand for password management solutions in Africa.
Market Segmentations:
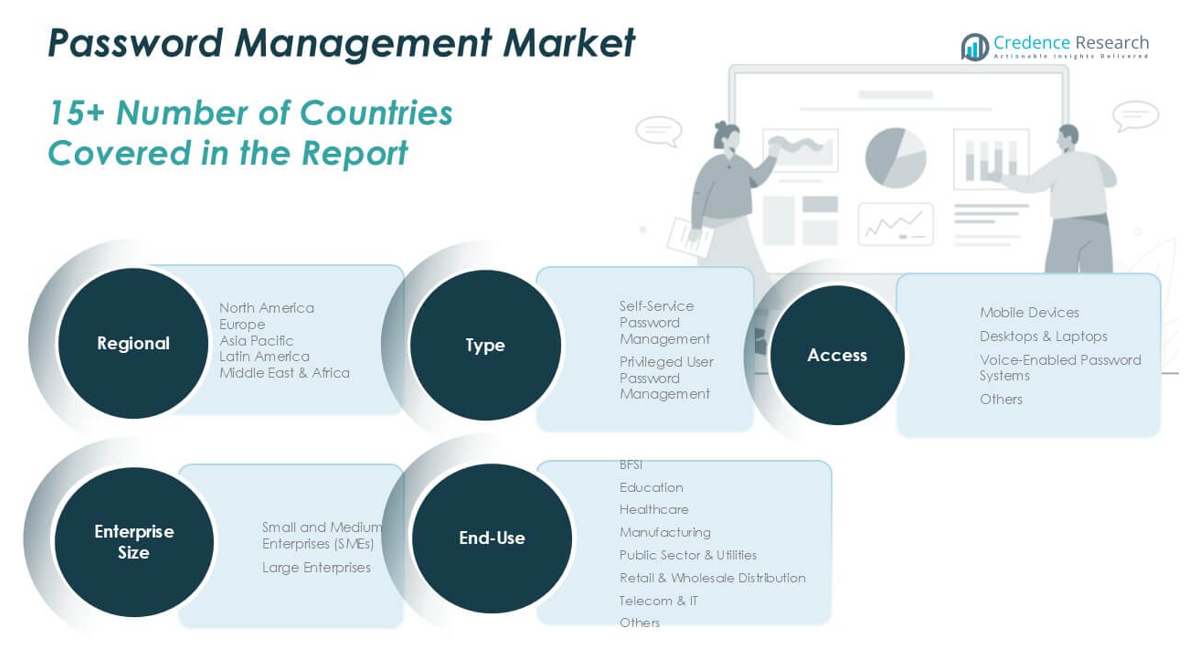
By Type
- Self-Service Password Management
- Privileged User Password Management
By Access
- Mobile Devices
- Desktops & Laptops
- Voice-Enabled Password Systems
- Others
By End-Use
- BFSI
- Education
- Healthcare
- Manufacturing
- Public Sector & Utilities
- Retail & Wholesale Distribution
- Telecom & IT
- Others
By Enterprise Size
- Small and Medium Enterprises (SMEs)
- Large Enterprises
By Geography
- North America
- Europe
- Germany
- France
- U.K.
- Italy
- Spain
- Rest of Europe
- Asia Pacific
- China
- Japan
- India
- South Korea
- South-east Asia
- Rest of Asia Pacific
- Latin America
- Brazil
- Argentina
- Rest of Latin America
- Middle East & Africa
- GCC Countries
- South Africa
- Rest of the Middle East and Africa
Competitive Landscape
The Password Management market is highly competitive, with both established technology giants and specialized cybersecurity firms actively shaping the landscape. Key players such as 1Password, Avatier, Bravura Security Inc., Dashlane Inc., Keeper Security, Inc., LastPass US LP, Microsoft, SailPoint Technologies, Inc., Trend Micro Incorporated, and Zoho Corporation Pvt. Ltd. are focusing on product innovation, cloud integration, and enhanced user experience to maintain their market positions. Companies are increasingly investing in multi-factor authentication, AI-driven security features, and mobile-friendly platforms to address evolving cybersecurity threats and user demands. Strategic collaborations, mergers, and acquisitions are also common, enabling firms to expand their global footprint and strengthen their service portfolios. The market also witnesses active participation from niche providers like FastPassCorp A/S, EmpowerID, Inc., and Siber Systems, Inc., which offer specialized solutions targeting enterprise and individual users. Continuous technological advancements and a strong emphasis on regulatory compliance further intensify competition within the industry.
Shape Your Report to Specific Countries or Regions & Enjoy 30% Off!
Key Player Analysis
- 1Password
- Avatier
- Bravura Security Inc.
- Fortra, LLC (Core Security Technologies)
- Dashlane Inc.
- EmpowerID, Inc.
- FastPassCorp A/S
- Intuit Inc.
- Keeper Security, Inc.
- LastPass US LP
- Microsoft
- SailPoint Technologies, Inc.
- Siber Systems, Inc.
- Trend Micro Incorporated
- Zoho Corporation Pvt. Ltd.
Recent Developments
- In November 2023, ExpressVPN announced the official launch of its password manager, ExpressVPN Keys. These keys help people manage their passwords and enjoy a secure and effortless online experience and are designed for security and convenience.
- In November 2022, 1Password completed the acquisition of Passage Identity, which developed authentication platforms that aided organizations in integrating biometric and passwordless login techniques. The acquisition resulted in the implementation of Face ID, Touch ID, and Windows Hello to enhance consumer experience and boost business growth.
- In July 2022, Google updated its password managers by including several highly requested features to aid consumers, such as auto-login, credential saving, and password generation, among others. This resulted in enhanced market growth due to higher utilization of the Google Chrome browser for web surfing and remote working.
- In June 2022, Lookout Inc. acquired SaferPass, which provides secure and simple password managers for enterprises and individuals. The acquisition resulted in delivering proactive security platforms to safeguard user data and privacy while expanding the business footprint.
- In January 2022, Keepers Security launched Secrets Manager, which secured infrastructure credentials such as certificates, API keys, access keys, and database passwords, among others. The solution included cloud-based integration, with a zero-knowledge security model similar to their enterprise password management platfor
Market Concentration & Characteristics
The Password Management Market is moderately concentrated, with a mix of global technology leaders and specialized cybersecurity firms actively competing. It features strong participation from established players such as Microsoft, 1Password, LastPass US LP, Keeper Security, Inc., and Zoho Corporation Pvt. Ltd., who maintain significant market positions through product development, mergers, and strategic partnerships. It shows rapid growth driven by increasing cybersecurity threats, regulatory pressure, and the demand for seamless user authentication. Cloud-based solutions, mobile accessibility, and multi-factor authentication dominate product offerings, reflecting a shift toward flexible and scalable security platforms. Vendors focus on enhancing user experience, improving integration capabilities, and supporting diverse enterprise requirements. North America remains the leading region, driven by advanced IT infrastructure and high cybersecurity adoption rates. Europe and Asia Pacific follow closely, showing strong growth potential supported by regulatory mandates and expanding digital ecosystems. The Password Management Market continues to evolve with frequent innovations and a focus on securing complex IT environments
Report Coverage
The research report offers an in-depth analysis based on Type, Access, End-Use, Enterprise Size and Geography. It details leading market players, providing an overview of their business, product offerings, investments, revenue streams, and key applications. Additionally, the report includes insights into the competitive environment, SWOT analysis, current market trends, as well as the primary drivers and constraints. Furthermore, it discusses various factors that have driven market expansion in recent years. The report also explores market dynamics, regulatory scenarios, and technological advancements that are shaping the industry. It assesses the impact of external factors and global economic changes on market growth. Lastly, it provides strategic recommendations for new entrants and established companies to navigate the complexities of the market.
Future Outlook
- The Password Management market is expected to witness sustained growth driven by increasing cybersecurity threats.
- Cloud-based password management solutions will continue to gain popularity due to their scalability and ease of access.
- The adoption of multi-factor authentication will become a standard feature in most password management systems.
- Mobile device integration will expand, supporting remote workforces and enhancing security for on-the-go users.
- Enterprises will increasingly focus on self-service password management to reduce IT support costs and improve user efficiency.
- Regulatory compliance will remain a key driver, pushing organizations to invest in advanced security solutions.
- AI and machine learning will play a greater role in enhancing password security and detecting breaches.
- Small and medium-sized enterprises will adopt password management solutions at a faster rate, driven by cost-effective cloud options.
- Integration challenges with legacy systems will gradually decrease as more flexible and adaptable solutions enter the market.
- The Asia Pacific region is expected to become a major growth hub due to rapid digitalization and increasing cybersecurity awareness.


