CHAPTER NO. 1 : GENESIS OF THE MARKE
1.1 Market Prelude – Introduction & Scope
1.2 The Big Picture – Objectives & Vision
1.3 Strategic Edge – Unique Value Proposition
1.4 Stakeholder Compass – Key Beneficiaries
CHAPTER NO. 2 : EXECUTIVE LENS
2.1 Pulse of the Industry – Market Snapshot
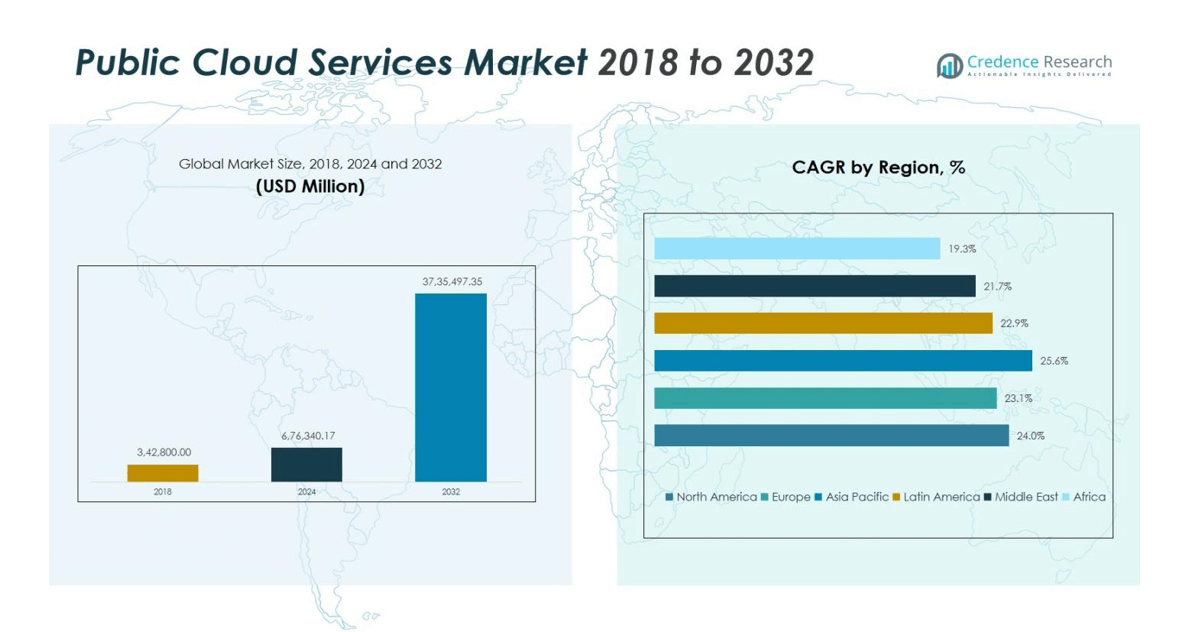
2.2 Growth Arc – Revenue Projections (USD Million)
2.3. Premium Insights – Based on Primary Interviews
CHAPTER NO. 3 : PUBLIC CLOUD SERVICES MARKET FORCES & INDUSTRY PULSE
3.1 Foundations of Change – Market Overview
3.2 Catalysts of Expansion – Key Market End Userrs
3.2.1 Momentum Boosters – Growth Triggers
3.2.2 Innovation Fuel – Disruptive Technologies
3.3 Headwinds & Crosswinds – Market Restraints
3.3.1 Regulatory Tides – Compliance Challenges
3.3.2 Economic Frictions – Inflationary Pressures
3.4 Untapped Horizons – Growth Potential & Opportunities
3.5 Strategic Navigation – Industry Frameworks
3.5.1 Market Equilibrium – Porter’s Five Forces
3.5.2 Ecosystem Dynamics – Value Chain Analysis
3.5.3 Macro Forces – PESTEL Breakdown
3.6 Price Trend Analysis
3.6.1 Regional Price Trend
3.6.2 Price Trend by product
CHAPTER NO. 4 : KEY INVESTMENT EPICENTER
4.1 Regional Goldmines – High-Growth Geographies
4.2 Product Frontiers – Lucrative Product Categories
4.3 Services Sweet Spots – Emerging Demand Segments
CHAPTER NO. 5: REVENUE TRAJECTORY & WEALTH MAPPING
5.1 Momentum Metrics – Forecast & Growth Curves
5.2 Regional Revenue Footprint – Market Share Insights
5.3 Segmental Wealth Flow – Type & Services Revenue
CHAPTER NO. 6 : TRADE & COMMERCE ANALYSIS
6.1. Import Analysis by Region
6.1.1. Global Public Cloud Services Market Import Revenue By Region
6.2. Export Analysis by Region
6.2.1. Global Public Cloud Services Market Export Revenue By Region
CHAPTER NO. 7 : COMPETITION ANALYSIS
7.1. Company Market Share Analysis
7.1.1. Global Public Cloud Services Market: Company Market Share
7.2. Global Public Cloud Services Market Company Revenue Market Share
7.3. Strategic Developments
7.3.1. Acquisitions & Mergers
7.3.2. New Product Launch
7.3.3. Regional Expansion
7.4. Competitive Dashboard
7.5. Company Assessment Metrics, 2024
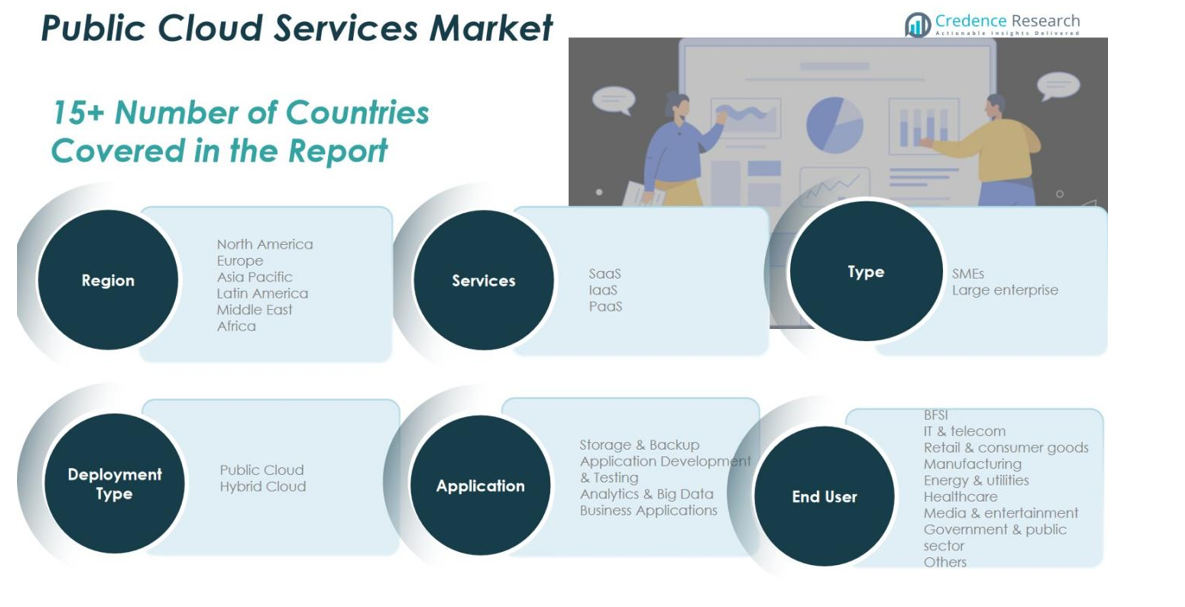
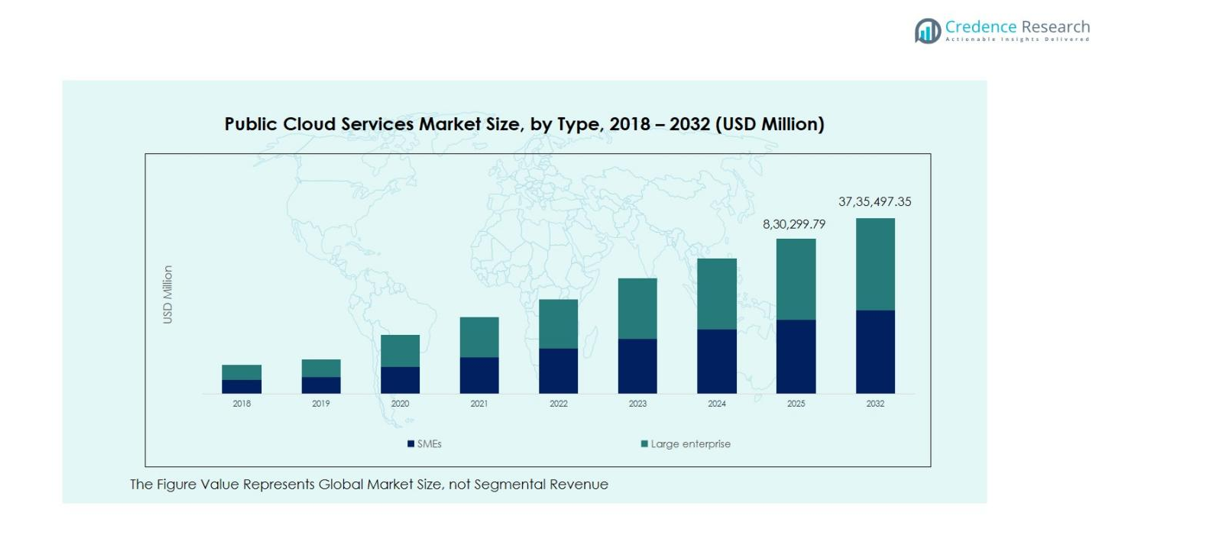
CHAPTER NO. 8 : PUBLIC CLOUD SERVICES MARKET – BY TYPE SEGMENT ANALYSIS
8.1. Public Cloud Services Market Overview by Type Segment
8.1.1. Public Cloud Services Market Revenue Share By Type
8.2. SMEs
8.3. Large enterprise
CHAPTER NO. 9 : PUBLIC CLOUD SERVICES MARKET – BY SERVICES SEGMENT ANALYSIS
9.1. Public Cloud Services Market Overview by Services Segment
9.1.1. Public Cloud Services Market Revenue Share By Services
9.2. SaaS
9.3. IaaS
9.4. PaaS
CHAPTER NO. 10 : PUBLIC CLOUD SERVICES MARKET – BY END USER SEGMENT ANALYSIS
10.1. Public Cloud Services Market Overview by End User Segment
10.1.1. Public Cloud Services Market Revenue Share By End User
10.2. BFSI
10.3. IT & telecom
10.4. Retail & consumer goods
10.5. Manufacturing
10.6. Energy & utilities
10.7. Healthcare
10.8. Media & entertainment
10.9. Government & public sector
10.10. Others
CHAPTER NO. 11 : PUBLIC CLOUD SERVICES MARKET – BY APPLICATION SEGMENT ANALYSIS
11.1. Public Cloud Services Market Overview by Application Segment
11.1.1. Public Cloud Services Market Revenue Share By Application
11.2. Storage & Backup
11.3. Application Development & Testing
11.4. Analytics & Big Data
11.5. Business Applications
CHAPTER NO. 12 : PUBLIC CLOUD SERVICES MARKET – BY DEPLOYMENT SEGMENT ANALYSIS
12.1. Public Cloud Services Market Overview by Deployment Segment
12.1.1. Public Cloud Services Market Revenue Share By Deployment
12.2. Public Cloud
12.3. Hybrid Cloud
CHAPTER NO. 13 : PUBLIC CLOUD SERVICES MARKET – REGIONAL ANALYSIS
13.1. Public Cloud Services Market Overview by Region Segment
13.1.1. Global Public Cloud Services Market Revenue Share By Region
13.1.2. Regions
13.1.3. Global Public Cloud Services Market Revenue By Region
13.1.4. Type
13.1.5. Global Public Cloud Services Market Revenue By Type
13.1.6. Services
13.1.7. Global Public Cloud Services Market Revenue By Services
13.1.8. End User
13.1.9. Global Public Cloud Services Market Revenue By End User
13.1.10. Application
13.1.12. Global Public Cloud Services Market Revenue By Application
13.1.13. Deployment
13.1.14. Global Public Cloud Services Market Revenue By Deployment
CHAPTER NO. 14 : NORTH AMERICA PUBLIC CLOUD SERVICES MARKET – COUNTRY ANALYSIS
14.1. North America Public Cloud Services Market Overview by Country Segment
14.1.1. North America Public Cloud Services Market Revenue Share By Region
14.2. North America
14.2.1. North America Public Cloud Services Market Revenue By Country
14.2.2. Type
14.2.3. North America Public Cloud Services Market Revenue By Type
14.2.4. Services
14.2.5. North America Public Cloud Services Market Revenue By Services
14.2.6. End User
14.2.7. North America Public Cloud Services Market Revenue By End User
14.2.8. Application
14.2.9. North America Public Cloud Services Market Revenue By Application
14.2.10. Deployment
14.2.11. North America Public Cloud Services Market Revenue By Deployment
14.3. U.S.
14.4. Canada
14.5. Mexico
CHAPTER NO. 15 : EUROPE PUBLIC CLOUD SERVICES MARKET – COUNTRY ANALYSIS
15.1. Europe Public Cloud Services Market Overview by Country Segment
15.1.1. Europe Public Cloud Services Market Revenue Share By Region
15.2. Europe
15.2.1. Europe Public Cloud Services Market Revenue By Country
15.2.2. Type
15.2.3. Europe Public Cloud Services Market Revenue By Type
15.2.4. Services
15.2.5. Europe Public Cloud Services Market Revenue By Services
15.2.6. End User
15.2.7. Europe Public Cloud Services Market Revenue By End User
15.2.8. Application
15.2.9. Europe Public Cloud Services Market Revenue By Application
15.2.10. Deployment
15.2.11. Europe Public Cloud Services Market Revenue By Deployment
15.3. UK
15.4. France
15.5. Germany
15.6. Italy
15.7. Spain
15.8. Russia
15.9. Rest of Europe
CHAPTER NO. 16 : ASIA PACIFIC PUBLIC CLOUD SERVICES MARKET – COUNTRY ANALYSIS
16.1. Asia Pacific Public Cloud Services Market Overview by Country Segment
16.1.1. Asia Pacific Public Cloud Services Market Revenue Share By Region
16.2. Asia Pacific
16.2.1. Asia Pacific Public Cloud Services Market Revenue By Country
16.2.2. Type
16.2.3. Asia Pacific Public Cloud Services Market Revenue By Type
16.2.4. Services
16.2.5. Asia Pacific Public Cloud Services Market Revenue By Services
16.2.6. End User
16.2.7. Asia Pacific Public Cloud Services Market Revenue By End User
16.2.8. Application
16.2.9. Asia Pacific Public Cloud Services Market Revenue By Application
16.2.10. Deployment
16.2.11. Asia Pacific Public Cloud Services Market Revenue By Deployment
16.3. China
16.4. Japan
16.5. South Korea
16.6. India
16.7. Australia
16.8. Southeast Asia
16.9. Rest of Asia Pacific
CHAPTER NO. 17 : LATIN AMERICA PUBLIC CLOUD SERVICES MARKET – COUNTRY ANALYSIS
17.1. Latin America Public Cloud Services Market Overview by Country Segment
17.1.1. Latin America Public Cloud Services Market Revenue Share By Region
17.2. Latin America
17.2.1. Latin America Public Cloud Services Market Revenue By Country
17.2.2. Type
17.2.3. Latin America Public Cloud Services Market Revenue By Type
17.2.4. Services
17.2.5. Latin America Public Cloud Services Market Revenue By Services
17.2.6. End User
17.2.7. Latin America Public Cloud Services Market Revenue By End User
17.2.8. Application
17.2.9. Latin America Public Cloud Services Market Revenue By Application
17.2.10. Deployment
17.2.11. Latin America Public Cloud Services Market Revenue By Deployment
17.3. Brazil
17.4. Argentina
17.5. Rest of Latin America
CHAPTER NO. 18 : MIDDLE EAST PUBLIC CLOUD SERVICES MARKET – COUNTRY ANALYSIS
18.1. Middle East Public Cloud Services Market Overview by Country Segment
18.1.1. Middle East Public Cloud Services Market Revenue Share By Region
18.2. Middle East
18.2.1. Middle East Public Cloud Services Market Revenue By Country
18.2.2. Type
18.2.3. Middle East Public Cloud Services Market Revenue By Type
18.2.4. Services
18.2.5. Middle East Public Cloud Services Market Revenue By Services
18.2.6. End User
18.2.7. Middle East Public Cloud Services Market Revenue By End User
18.2.8. Application
18.2.9. Middle East Public Cloud Services Market Revenue By Application
18.2.10. Deployment
18.2.11. Middle East Public Cloud Services Market Revenue By Deployment
18.3. GCC Countries
18.4. Israel
18.5. Turkey
18.6. Rest of Middle East
CHAPTER NO. 19 : AFRICA PUBLIC CLOUD SERVICES MARKET – COUNTRY ANALYSIS
19.1. Africa Public Cloud Services Market Overview by Country Segment
19.1.1. Africa Public Cloud Services Market Revenue Share By Region
19.2. Africa
19.2.1. Africa Public Cloud Services Market Revenue By Country
19.2.2. Type
19.2.3. Africa Public Cloud Services Market Revenue By Type
19.2.4. Services
19.2.5. Africa Public Cloud Services Market Revenue By Services
19.2.6. End User
19.2.7. Africa Public Cloud Services Market Revenue By End User
19.2.8. Application
19.2.9. Africa Public Cloud Services Market Revenue By Application
19.2.10. Deployment
19.2.11. Africa Public Cloud Services Market Revenue By Deployment
19.3. South Africa
19.4. Egypt
19.5. Rest of Africa
CHAPTER NO. 20 : COMPANY PROFILES
20.1. Adobe Inc.
20.1.1. Company Overview
20.1.2. Product Portfolio
20.1.3. Financial Overview
20.1.4. Recent Developments
20.1.5. Growth Strategy
20.1.6. SWOT Analysis
20.2. Alibaba Group Holding Ltd.
20.3. Alphabet Inc.
20.4. Amazon.com Inc.
20.5. AT and T Inc.
20.6. Cisco Systems Inc.
20.7. Dell Technologies Inc.
20.8. Fujitsu Ltd.
20.9. Hewlett Packard Enterprise Co.
20.10. International Business Machines Corp.
20.11. Microsoft Corp.
20.12. Oracle Corp.
20.13. Rackspace Technology Inc.
20.14. Salesforce Inc.
20.15. SAP SE
20.16. Tencent Holdings Ltd.
20.17. Verizon Communications Inc.
20.18. VMware Inc.
20.19. Workday Inc.