Market Overview
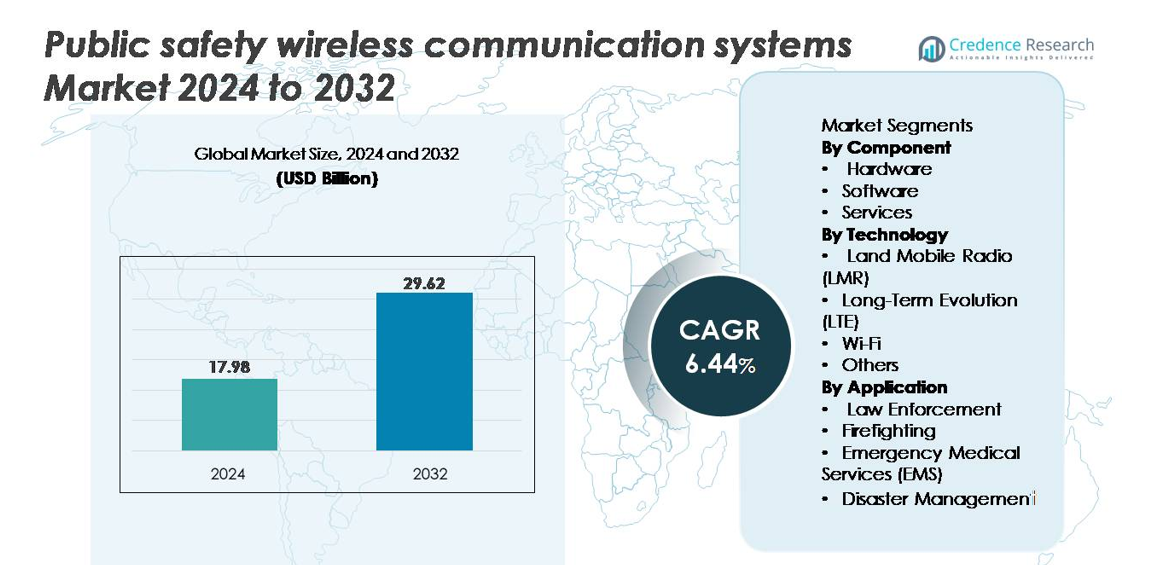
The public safety wireless communication systems market was valued at USD 17.98 billion in 2024 and is projected to reach USD 29.62 billion by 2032, reflecting a CAGR of 6.44% during the forecast period.
| REPORT ATTRIBUTE |
DETAILS |
| Historical Period |
2020-2023 |
| Base Year |
2024 |
| Forecast Period |
2025-2032 |
| Public Safety Wireless Communication Systems Market Size 2024 |
USD 17.98 billion |
| Public Safety Wireless Communication Systems Market, CAGR |
6.44% |
| Public Safety Wireless Communication Systems Market Size 2032 |
USD 29.62 billion |
The public safety wireless communication systems market is shaped by globally established players such as Ericsson AB, Hytera Communications Corporation Limited, Motorola Solutions, Inc., Nokia Networks, Cisco Systems, Inc., JVCKENWOOD Corporation, ZTE Corporation, Airbus Group, Sepura PLC, and Harris Corporation. These companies compete by offering advanced LMR, LTE/5G mission-critical communication platforms, multi-band radios, encrypted networks, and interoperable command-and-control solutions. North America leads the market with an estimated 34% share, driven by strong federal investment, rapid adoption of hybrid LMR–LTE systems, and the presence of major technology providers. Europe and Asia-Pacific follow closely, supported by nationwide modernization programs and growing digital public safety initiatives.
Market Insights
- The public safety wireless communication systems market was valued at USD 17.98 billion in 2024 and is projected to reach USD 29.62 billion by 2032, registering a CAGR of 6.44% during the forecast period.
- The market grows rapidly due to rising demand for mission-critical communication, real-time situational awareness, and large-scale upgrades of LMR and LTE-based public safety networks across law enforcement, firefighting, EMS, and disaster management.
- Key trends include adoption of hybrid LMR–LTE architectures, expansion of AI-enabled command centers, and integration of broadband, IoT sensors, and multi-band communication devices to support next-generation emergency operations.
- Competitive intensity increases as global players such as Motorola Solutions, Ericsson, Nokia, Hytera, and Harris Corporation strengthen portfolios through encrypted networks, interoperable systems, and broadband-driven mission-critical solutions.
- Regionally, North America leads with ~34% share, followed by Asia-Pacific (~29%) and Europe (~27%); by segment, hardware dominates due to the extensive deployment of radios, base stations, and rugged communication infrastructure.
Access crucial information at unmatched prices!
Request your sample report today & start making informed decisions powered by Credence Research Inc.!
Download Sample
Market Segmentation Analysis:
By Component
Hardware dominates the component segment, driven by the widespread deployment of rugged communication devices, base stations, repeaters, and high-reliability network infrastructure required for mission-critical operations. Agencies prioritize hardware investments to ensure uninterrupted connectivity, especially in remote or high-risk zones where system resilience is essential. Growth is further propelled by modernization of public safety networks, including expanded deployment of next-generation radios, sensors, and interoperable gateways that support multi-band operations and real-time incident response. As governments upgrade legacy communication frameworks, hardware retains the largest share due to its foundational role in system performance and reliability.
- For instance, Motorola Solutions’ APX NEXT XE specs are authentic. The model includes a 4.7-inch glove-ready touchscreen, IP68/IP66 protection, and a 3 W speaker, as stated. Hytera’s HR1065 DMR repeater details are also correct, including 50 W RF output and up to 64 channels support.
By Technology
Land Mobile Radio (LMR) remains the dominant technology, supported by its proven reliability, dedicated frequency access, and strong performance in harsh environments where commercial networks may fail. LMR continues to be the primary communication backbone for police, fire, and emergency teams due to its guaranteed coverage, instant push-to-talk capability, and secure, encrypted channels. Although LTE and hybrid broadband-LMR architectures are gaining momentum, agencies still rely heavily on LMR for mission-critical voice communication. Its long-established infrastructure, combined with ongoing digital upgrades and expanded interoperability standards, sustains its leading share in the technology mix.
- For instance, L3Harris’ XL-200P radio is authentic in featuring VHF, UHF, and 700/800 MHz multiband support and AES-256 encryption for secure communication. The series also reaches transmit power levels up to 4 W, as stated in official specs. Kenwood’s NX-5000 series is accurate in offering DMR, NXDN, and P25 support along with battery options that range from roughly 2500 mAh to above 3000 mAh.
By Application
Law Enforcement holds the largest share of the application segment, driven by high demand for real-time communication, situational awareness, and coordinated response during crime prevention, surveillance, and tactical operations. Police agencies depend on secure wireless channels to exchange field intelligence, track units, and maintain operational continuity across jurisdictions. The rising need for video streaming, body-worn camera integration, and data-rich dispatch systems further accelerates adoption. As public security pressures intensify and digital policing ecosystems expand, law enforcement continues to invest heavily in advanced communication platforms, reinforcing its dominant market position within the public safety communication landscape.
Key Growth Drivers
Rising Demand for Mission-Critical Communication and Real-Time Situational Awareness
The market experiences strong growth as public safety agencies increasingly rely on mission-critical wireless systems to support real-time situational awareness, rapid decision-making, and coordinated field operations. Law enforcement, fire services, and emergency medical teams require communication platforms capable of delivering instant, reliable, and secure information exchange during emergencies. The surge in unpredictable natural disasters, urban crime complexities, and high-risk public events has intensified demand for high-performance systems that ensure uninterrupted connectivity. Agencies are prioritizing upgrades that bridge gaps between voice, video, sensor data, and geospatial intelligence, supporting a more holistic response framework. Integrated wireless communication systems now form the backbone of incident command operations, enabling seamless information flow from dispatch centers to field teams. As governments strengthen national resilience strategies and invest in modern public safety infrastructure, this demand continues to accelerate, reinforcing communication networks as essential assets in emergency preparedness and response.
- For instance, Motorola Solutions’ APX NEXT include a dedicated LTE modem that supports fast mission-critical data updates. The V500 body-worn camera also records at 30 fps and offers an operational battery life designed for a full shift. These features highlight real, performance-driven tools that improve situational awareness.
Government-Led Modernization of Public Safety Infrastructure
Government investments and regulatory mandates significantly drive the expansion of public safety wireless communication systems. National and regional authorities are implementing modernization initiatives to replace aging analog networks with advanced digital, broadband, and interoperable systems capable of supporting cross-agency collaboration. Funding programs for critical infrastructure, smart city development, and disaster resilience further accelerate procurement cycles for next-generation communication technologies. Emergency services increasingly require systems aligned with national safety standards, cybersecurity protocols, and interoperability frameworks, prompting widespread adoption of unified communication architectures. In many regions, governments are deploying broadband-enabled networks to support high-data applications such as real-time video, telemetry, fleet tracking, and emergency alerts. This policy-driven momentum ensures stable long-term demand for both infrastructure upgrades and new deployments across municipal and national safety agencies. The resulting ecosystem fosters technological innovation, accelerates standardization, and reinforces public-private collaboration in securing resilient communication capabilities.
- For instance, Nokia’s AirScale baseband supports up to ~90,000 simultaneous connections per cell and delivers high throughput with low-latency 5G performance. Ericsson’s mission-critical offering includes MCPTT (Mission Critical Push-to-Talk), enabling reliable group voice/data for public-safety and critical operations over LTE/5G networks.
Growing Integration of IoT, AI, and Broadband Technologies in Public Safety Networks
The adoption of IoT sensors, AI-enabled analytics, and high-speed broadband technologies is reshaping public safety communication systems, driving substantial market expansion. Emergency response agencies increasingly deploy connected devices such as surveillance cameras, environmental sensors, body-worn units, and mobile data terminals that generate continuous data streams requiring robust wireless backbones. AI-powered analytics enable real-time threat detection, predictive resource allocation, and automated incident reporting, strengthening operational efficiency. Broadband advancements, especially LTE-based mission-critical push-to-talk (MCPTT) platforms, support rich data applications such as live drone feeds, vehicle telematics, and remote diagnostics. This convergence enhances situational intelligence and promotes faster, more accurate response strategies. As digital transformation accelerates across public safety environments, agencies prioritize networks capable of supporting advanced analytics, multi-modal data exchange, and device interoperability. The growing reliance on connected ecosystems continues to fuel investment in high-capacity, secure, and resilient wireless communication infrastructure.
Key Trends & Opportunities
Expansion of Hybrid LMR–LTE Communication Models
A major industry trend is the rapid shift toward hybrid communication architectures that integrate traditional Land Mobile Radio (LMR) with broadband LTE-based systems. While LMR remains indispensable for mission-critical voice services, agencies increasingly require high-bandwidth capabilities for video, data streaming, and advanced analytics. Hybrid systems bridge this gap by enabling seamless voice-data convergence, allowing public safety teams to maintain legacy reliability while accessing next-generation digital features. This transition opens new opportunities for vendors offering gateways, multi-mode devices, and interoperable software platforms. The growing adoption of MCPTT solutions, cloud-based dispatch centers, and shared radio access networks further accelerates hybrid deployment. As agencies aim to achieve long-term modernization without disrupting mission-critical operations, hybrid LMR–LTE platforms become a strategic investment path, creating sustained growth opportunities for integrators, device manufacturers, and network service providers.
- For instance, Ericsson’s MCPTT platform supports more than 100,000 push-to-talk sessions per hour for large emergency networks
Increasing Adoption of AI-Enabled Command & Control Platforms
AI-driven analytics platforms represent one of the most transformative opportunities within the public safety communication ecosystem. Agencies are integrating AI into command and control centers to analyze real-time data from sensors, surveillance systems, and communication networks. These platforms enhance situational awareness by identifying anomalies, predicting incident escalation, and automating threat classification. AI-backed tools enable dispatchers to process incoming data more efficiently, prioritize critical events, and allocate resources with greater precision. Opportunities are emerging for technology providers offering AI-enabled mapping, behavior analysis, and incident forecasting solutions. The growing demand for multi-source data fusion combining text, audio, video, and IoT inputs further drives innovation in AI-based decision support systems. As communication networks evolve to support these advanced applications, AI adoption continues to expand, improving operational accuracy and enabling fully interconnected emergency environments.
- For instance, Hexagon’s HxGN OnCall platform applies AI-assisted call classification that shortens intake time by analyzing voice patterns and keyword triggers with high accuracy
Growth of Smart City Investments and Intelligent Infrastructure
Public safety wireless communication systems benefit significantly from global smart city development initiatives focused on automating urban infrastructure and enhancing citizen safety. Governments increasingly deploy intelligent traffic systems, environmental monitoring solutions, emergency warning platforms, and smart surveillance networks linked through high-capacity wireless communication backbones. This trend opens opportunities for solutions supporting wide-area connectivity, cross-agency coordination, and real-time public information systems. Smart mobility hubs, integrated disaster alert systems, and connected street infrastructure generate sustained demand for interoperable communication systems capable of supporting massive IoT deployments. Vendors offering scalable, cloud-managed, and analytics-ready platforms are well positioned to gain from these expanding smart city ecosystems. As urbanization rises and smart governance models advance, the role of advanced wireless communication architecture becomes central to building safe, resilient, and digitally integrated cities.
Key Challenges
Interoperability Limitations Across Agencies and Legacy Networks
One of the most persistent challenges in the public safety wireless communication systems market is achieving seamless interoperability among diverse agencies, jurisdictions, and communication technologies. Many regions continue to operate a mix of legacy analog networks, digital LMR systems, and newer broadband platforms that do not naturally align with each other. This fragmentation complicates joint operations, delays information exchange, and increases operational risk during multi-agency responses such as large-scale disasters or cross-border incidents. Upgrading legacy systems is often costly and technically complex, requiring coordinated planning, spectrum harmonization, and integration of multi-band devices. Interoperability gaps also affect data sharing, particularly as agencies adopt high-bandwidth applications like video transmission and geospatial analytics. Addressing these limitations requires significant investment, standardization efforts, and long-term modernization strategies, posing continued challenges for agencies with budget constraints and aging communication infrastructure.
Cybersecurity Threats Targeting Public Safety Communication Networks
The rapid digitalization of public safety communication systems exposes agencies to heightened cybersecurity risks, creating a major operational challenge. As wireless networks integrate broadband, IoT devices, cloud-based dispatch systems, and AI-driven analytics, the attack surface expands significantly. Cyber threats including network breaches, ransomware, signal jamming, and data interception can compromise mission-critical operations, disrupt emergency responses, and jeopardize sensitive information. Many public agencies lack the cybersecurity maturity required to protect interconnected systems, especially when operating legacy equipment or underfunded IT frameworks. The growing reliance on IP-based communication increases the need for encryption, intrusion detection, zero-trust policies, and resilient network design. Vendors must implement advanced security protocols, continuous monitoring, and robust authentication mechanisms. Failure to address these risks may result in operational downtime, compromised public safety, and regulatory non-compliance, making cybersecurity a central barrier to market adoption.
Regional Analysis
North America
North America holds the largest share of the public safety wireless communication systems market, accounting for approximately 34%, driven by strong federal and state-level investments in mission-critical LTE, upgraded LMR networks, and NG911 modernization programs. The U.S. leads adoption through nationwide broadband public safety initiatives, expanding MCPTT capabilities, and rapid integration of AI-enabled command centers. Canada also accelerates deployments to strengthen disaster resilience and cross-agency interoperability. High technology readiness, mature infrastructure, and early adoption of hybrid LMR–LTE architectures reinforce North America’s leadership position and ongoing demand for advanced communication platforms.
Europe
Europe captures around 27% of the market, supported by ongoing modernization of emergency communication systems, cross-border interoperability frameworks, and strong regulatory mandates for secure digital communication. EU member states continue transitioning from legacy TETRA systems to broadband-enabled public safety networks, enhancing real-time coordination across law enforcement, fire services, and medical responders. Countries such as the U.K., Germany, and France are expanding 4G/5G-based mission-critical communication infrastructure to support data-rich applications. Europe’s structured investment programs, cybersecurity mandates, and unified safety standards promote sustained technology upgrades across both national and municipal emergency operations.
Asia-Pacific
Asia-Pacific accounts for approximately 29% of the market, reflecting rapid urbanization, rising disaster events, and significant government-backed infrastructure development. China, Japan, South Korea, and India are major contributors, expanding broadband public safety networks to support real-time surveillance, incident command, and emergency response modernization. The region is shifting from analog and fragmented systems to integrated platforms combining LMR, LTE, and IoT-based communication layers. Smart city deployments, high-density urban safety requirements, and increased investment in secure communication frameworks accelerate technology adoption. Asia-Pacific’s fast-paced digital transformation positions it as the fastest-growing regional market.
Latin America
Latin America holds roughly 6% of the market, with growth driven by the need to modernize outdated communication systems and improve cross-agency coordination amid rising public safety pressures. Countries such as Brazil, Mexico, and Chile are upgrading LMR networks and adopting LTE-based public safety solutions to enhance emergency response, disaster resilience, and urban security infrastructure. Budget constraints slow nationwide deployments, yet targeted investments in high-risk urban zones and critical infrastructure support incremental progress. Regional initiatives promoting interoperability, digital command centers, and secure communication backbones are strengthening adoption across emergency and law enforcement agencies.
Middle East & Africa
The Middle East & Africa region captures around 4% of the market, reflecting expanding investments in security modernization, especially in the Gulf Cooperation Council (GCC) countries. Nations such as the UAE, Saudi Arabia, and Qatar are deploying advanced broadband-enabled public safety networks to support large-scale events, critical infrastructure protection, and national emergency preparedness. In Africa, adoption progresses gradually, driven by urban security needs and international aid-supported modernization projects. Despite infrastructure limitations in some areas, rising demand for secure, interoperable, and resilient communication platforms fuels steady market expansion across both subregions
Market Segmentations:
By Component
- Hardware
- Software
- Services
By Technology
- Land Mobile Radio (LMR)
- Long-Term Evolution (LTE)
- Wi-Fi
- Others
By Application
- Law Enforcement
- Firefighting
- Emergency Medical Services (EMS)
- Disaster Management
By Geography
- North America
- Europe
- Germany
- France
- U.K.
- Italy
- Spain
- Rest of Europe
- Asia Pacific
- China
- Japan
- India
- South Korea
- South-east Asia
- Rest of Asia Pacific
- Latin America
- Brazil
- Argentina
- Rest of Latin America
- Middle East & Africa
- GCC Countries
- South Africa
- Rest of the Middle East and Africa
Competitive Landscape
The competitive landscape of the public safety wireless communication systems market is characterized by a mix of global network solution providers, communication equipment manufacturers, and specialized mission-critical technology vendors. Leading companies such as Motorola Solutions, L3Harris Technologies, Nokia, Ericsson, and Huawei play a central role, offering integrated platforms combining LMR, LTE/5G broadband, and mission-critical push-to-talk capabilities. These players compete through advancements in interoperability frameworks, encrypted communication networks, and AI-enabled command-and-control applications. Partnerships with governments, emergency agencies, and infrastructure operators remain essential for securing long-term national and regional contracts. Vendors increasingly focus on hybrid LMR–LTE devices, multi-band radios, cloud-based dispatch systems, and secure IoT-enabled public safety solutions. Ongoing investments in cybersecurity, network resilience, and broadband integration further intensify competition. Additionally, regional players and system integrators strengthen the landscape by offering cost-effective deployments and customization for local operating conditions, contributing to a dynamic and evolving competitive environment.
Shape Your Report to Specific Countries or Regions & Enjoy 30% Off!
Key Player Analysis
Recent Developments
- In June 2025, Ericsson unveiled two next-generation high-performance antennas (Antenna 1005 and 1006) at Critical Communications World in Brussels, designed specifically for Public Protection and Disaster Relief (PPDR) and other mission-critical networks, to enhance secure and reliable coverage for public safety users.
- In April 2025, Motorola Solutions introduced the SVX device and Assist AI platform, combining a two-way radio accessory, body camera, and embedded AI assistant to help first responders speed up emergency response and reduce administrative workload in public safety operations.
- In November 2024, Hytera showcased new DMR and PoC “Innovations for a Safer World” at PMRExpo 2024 in Cologne, launching the DS-6250S SDR base station, P5 Series PoC radios, and the SC780 body-worn camera, targeting professional and public safety communications.
Report Coverage
The research report offers an in-depth analysis based on Component, Technology, Application and Geography. It details leading market players, providing an overview of their business, product offerings, investments, revenue streams, and key applications. Additionally, the report includes insights into the competitive environment, SWOT analysis, current market trends, as well as the primary drivers and constraints. Furthermore, it discusses various factors that have driven market expansion in recent years. The report also explores market dynamics, regulatory scenarios, and technological advancements that are shaping the industry. It assesses the impact of external factors and global economic changes on market growth. Lastly, it provides strategic recommendations for new entrants and established companies to navigate the complexities of the market.
Future Outlook
- Demand for hybrid LMR–LTE and emerging 5G mission-critical networks will accelerate modernization of public safety communication infrastructures.
- Agencies will increasingly adopt AI-enabled command platforms to enhance threat detection, incident prediction, and real-time decision support.
- Growth in smart city deployments will expand opportunities for integrated public safety networks linked to sensors, video systems, and IoT infrastructure.
- Interoperability solutions will advance, enabling seamless communication across agencies, jurisdictions, and mixed legacy-broadband environments.
- Cloud-based dispatch centers and remote operations platforms will gain adoption for scalable, resilient emergency communication.
- Public safety agencies will invest more in cybersecurity-hardened networks to counter rising digital threats targeting mission-critical systems.
- Wearable technologies, drones, and connected field devices will drive higher data throughput needs and richer situational awareness.
- Broadband-driven mission-critical push-to-talk services will replace traditional voice-only systems in many regions.
- Developing economies will accelerate infrastructure upgrades to improve disaster response and urban security.
- Vendor competition will intensify as global players expand multi-band radios, interoperable gateways, and next-generation communication platforms.


