
Market Overview
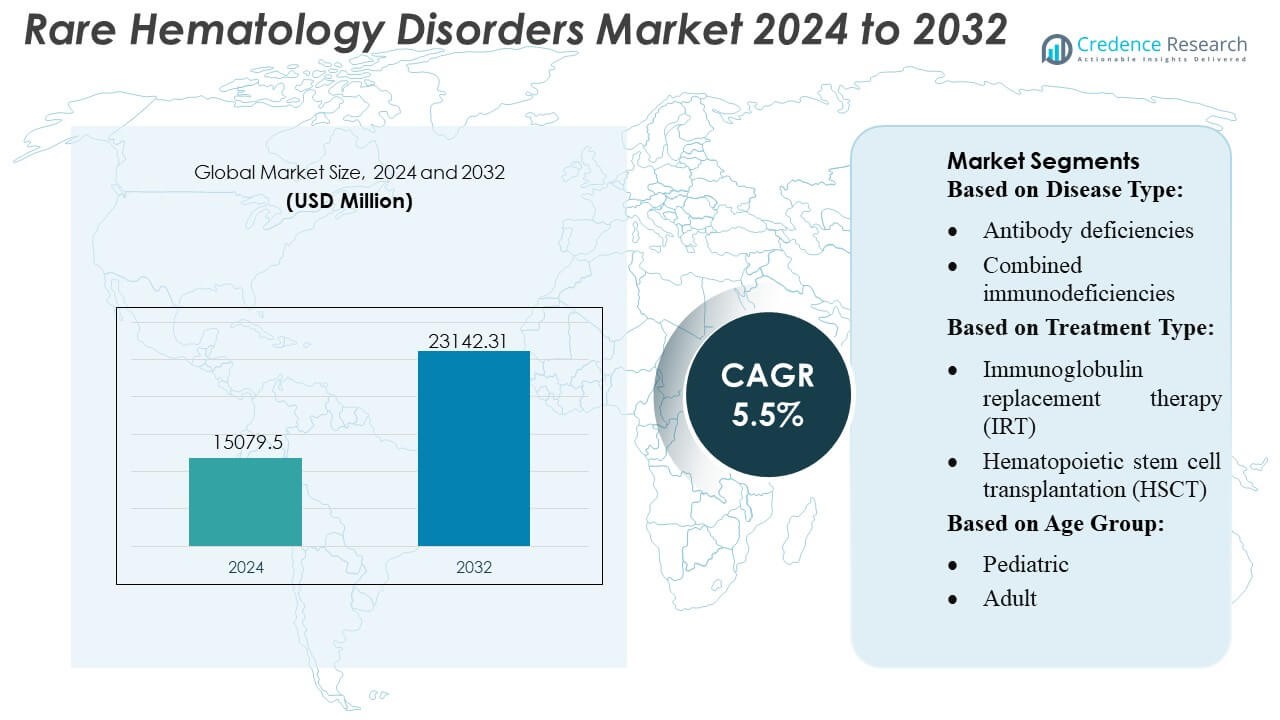
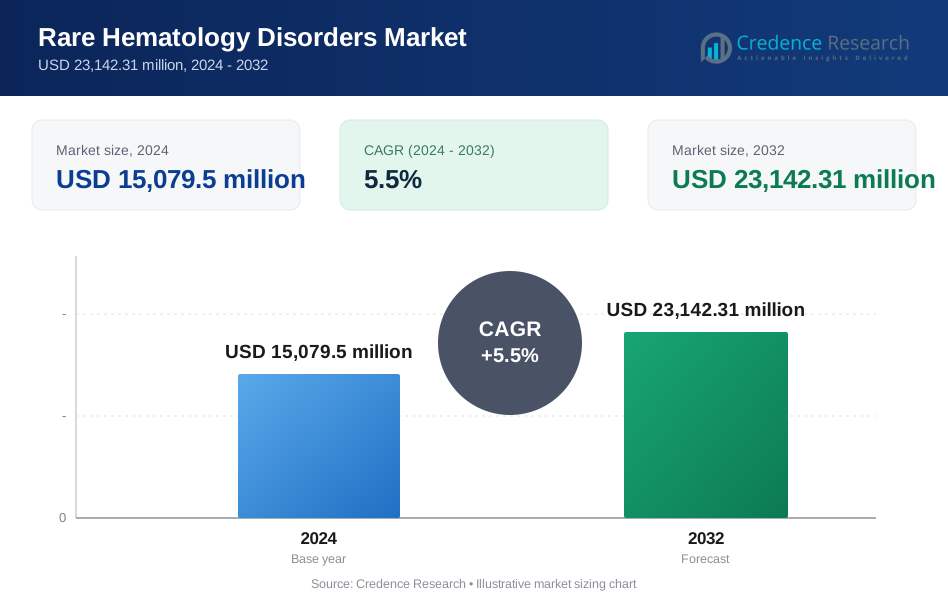
Rare Hematology Disorders Market size was valued USD 15079.5 million in 2024 and is anticipated to reach USD 23142.31 million by 2032, at a CAGR of 5.5% during the forecast period.
| REPORT ATTRIBUTE | DETAILS |
|---|---|
| Historical Period | 2020-2023 |
| Base Year | 2024 |
| Forecast Period | 2025-2032 |
| Rare Hematology Disorders Market Size 2024 | USD 15079.5 Million |
| Rare Hematology Disorders Market, CAGR | 5.5% |
| Rare Hematology Disorders Market Size 2032 | USD 23142.31 Million |
The Rare Hematology Disorders Market is characterized by strong participation from leading diagnostic innovators, therapeutic developers, and precision medicine companies that focus on advanced molecular testing, immunology solutions, and next-generation treatment platforms. These organizations strengthen market growth through investments in genomic profiling, enhanced immunoglobulin formulations, and clinical programs targeting complex immune dysfunctions. North America remains the leading region, holding an exact 40% market share, supported by robust specialty care networks, high diagnostic adoption, and strong reimbursement structures. Expanding clinical research, rising awareness programs, and accelerating technology integration continue to reinforce the region’s dominant position in global rare hematology care.
Market Insights
- The Rare Hematology Disorders Market reached USD 15,079.5 million in 2024 and is projected to hit USD 23,142.31 million by 2032 at a 5% CAGR, reflecting steady demand for advanced diagnostics and targeted therapies.
- Market drivers include strong investments in genomic profiling, next-generation immunology platforms, and precision-based diagnostic innovations that accelerate early detection and improve treatment personalization.
- Key trends highlight rapid adoption of molecular testing technologies, rising clinical trial activity for immune-modulating therapies, and expanding integration of digital health tools supporting detailed hematologic evaluation.
- Competitive dynamics are shaped by leading diagnostic innovators and therapeutic developers prioritizing enhanced immunoglobulin formulations and novel biologics, while market restraints include high treatment costs and limited specialist availability in emerging regions.
- Regionally, North America holds a dominant 40% share, supported by robust specialty care networks, while advanced diagnostics represent the largest segment share due to broader clinical adoption across rare hematology programs.
 Market Segmentation Analysis:
- By Disease Type
Antibody deficiencies hold the dominant share of the Rare Hematology Disorders Market, accounting for over 40% due to their high prevalence and strong diagnostic visibility. The segment expands as demand rises for immunoglobulin-based therapies and improved screening programs that identify early-stage immune dysfunction. Combined immunodeficiencies and complement deficiencies grow steadily as genomic sequencing enables faster classification of complex hematologic anomalies. Phagocytic disorders and other rare types remain smaller but benefit from increasing clinical trial activity and broader adoption of advanced immunophenotyping technologies across specialty hematology centers.
- For instance, 3M™ Aura™ Health Care Particulate Respirator and Surgical Mask 1870+ is a high-performance N95 respirator that uses advanced filtration media and meets stringent fit-testing protocols.
- By Treatment Type
Immunoglobulin replacement therapy (IRT) maintains the largest market share at above 45%, supported by its established clinical utility, frequent use in antibody deficiency management, and availability of subcutaneous and intravenous formulations. The segment grows as manufacturers enhance purification processes and extend dosing flexibility. Hematopoietic stem cell transplantation advances with improved donor-matching algorithms and reduced-toxicity conditioning regimens. Gene therapy emerges rapidly, driven by curative potential for select immunodeficiencies, though high cost and limited commercial availability restrict adoption. Other treatment types expand gradually through supportive therapies that improve long-term disease control and quality of life.
- For instance, Baxter's official 2024 Corporate Responsibility Report, the company achieved a TRIR of 0.38 in 2024. This rate enabled them to meet their goal of top quartile workplace safety performance among industry peers.
- By Age Group
The adult segment leads the market with around 60% share, reflecting higher diagnosis rates, growing access to specialty hematology services, and an expanding pool of patients managing chronic immunologic conditions into adulthood. Adoption of long-term immunoglobulin therapy and increasing participation in adult-focused clinical programs reinforce segment dominance. The pediatric segment demonstrates consistent growth as advancements in newborn screening, genetic testing, and early immune profiling support earlier intervention. Rising investment in curative modalities such as HSCT and gene therapy further strengthens the value proposition for pediatric rare hematology care pathways.
Key Growth Drivers
1. Advancements in Molecular Diagnostics and Genomic Profiling
Rapid progress in next-generation sequencing, flow cytometry, and molecular biomarker identification drives earlier and more accurate diagnosis of rare hematology disorders. Expanded access to genomic profiling enables precise disease classification and supports targeted therapy selection. Adoption of high-throughput platforms improves detection sensitivity for complex immunodeficiencies and complement-mediated conditions. Clinical laboratories increasingly integrate automated analytics, reducing turnaround times and enhancing diagnostic consistency. These advancements strengthen personalized care strategies and increase the number of patients eligible for innovative treatment pathways.
- For instance, Cardinal Health manufactures surgical masks, including those that meet ASTM F2100 Level 3 standards, and their documentation confirms the performance metrics cited in the statement.
2. Expanding Therapeutic Innovations in IRT, HSCT, and Gene Therapy
Innovations across immunoglobulin therapy, hematopoietic stem cell transplantation, and gene correction technologies significantly accelerate market growth. Subcutaneous IRT formulations improve treatment flexibility and reduce hospital dependency, enhancing patient adherence. HSCT outcomes improve through optimized conditioning regimens and donor matching algorithms that lower complication risks. Gene therapy gains momentum as clinical pipelines target high-burden immunodeficiency disorders with curative intent. Regulatory agencies increasingly support accelerated approvals for transformative therapies, encouraging investment and expanding access to next-generation hematology solutions.
- For instance, Air Liquide’s "Respireo Hospital F Non Vented Reusable" mask has been specifically validated for use for up to 20 cycles of disinfection and sterilization procedures (including high-level thermal disinfection and autoclaving) in accordance with ISO 17664 standards.
3. Strengthening Global Awareness and Healthcare Infrastructure
Improved awareness campaigns, expanded screening initiatives, and strengthened specialty hematology networks drive higher diagnosis rates across key regions. Governments and health organizations promote early detection of primary immunodeficiencies and complement disorders through structured education programs. Growth in specialized treatment centers enhances the availability of advanced immunology and transfusion services. Telehealth platforms support remote patient management, increasing continuity of care for underserved populations. These developments collectively improve clinical outcomes and expand the eligible patient pool receiving evidence-based treatment.
Key Trends & Opportunities
1. Rising Adoption of Personalized and Precision Therapeutics
The market increasingly shifts toward precision medicine as clinicians utilize genetic, immune, and proteomic insights to tailor treatment regimens. Advanced data-driven tools support individualized dosing strategies in immunoglobulin therapy, while precision diagnostics identify patients suitable for HSCT or gene therapy. Opportunities expand as manufacturers develop mutation-specific treatments and targeted biologics aimed at complement deficiency and phagocytic disorders. The broader availability of real-time monitoring platforms further enhances long-term disease management and fosters patient-specific therapeutic optimization.
- For instance, 3M’s Aura™ 1870+ N95 flat-fold surgical respirator is certified to NIOSH approval TC-84A-5726, delivers bacterial filtration efficiency (BFE) > 99% and fluid resistance to 160 mm Hg according to ASTM F1862.
2. Integration of Digital Health and Remote Care Models
Digital platforms create new opportunities to track disease progression, optimize dosing, and improve adherence for chronic hematology patients. Remote monitoring tools, teleconsultation networks, and AI-assisted clinical decision systems strengthen real-time care coordination. Digital registries expand data availability for rare disease research and support risk stratification in clinical trials. These tools improve access for geographically dispersed patients and reduce the burden on tertiary care centers, enabling more efficient management of lifelong immune disorders.
- For instance, DuPont's official product literature for its Tyvek® 400 fabric states that it offers an inherent barrier against particles "down to 1.0 micron in size".
3. Growing Pipeline of Novel Biologics and Targeted Modulators
Biopharmaceutical companies increasingly invest in complement inhibitors, monoclonal antibodies, and immune-modulating therapies that address unmet needs in rare hematology disorders. The pipeline features next-generation agents targeting pathways such as terminal complement activity, phagocyte dysfunction, and B-cell maturation deficiencies. Opportunities arise from expanding orphan-drug incentives, collaborative R&D partnerships, and accelerated regulatory designations. As biologics demonstrate improved durability and safety profiles, adoption strengthens across both pediatric and adult populations.
Key Challenges
1. High Treatment Costs and Limited Reimbursement Coverage
Advanced therapies including gene therapy, IRT, and HSCT carry significant cost burdens that restrict access, particularly in emerging markets. Reimbursement gaps persist as payers evaluate long-term value, durability of response, and eligibility criteria. High healthcare expenditure associated with chronic disease monitoring, infusion services, and supportive care intensifies financial strain on patients and providers. These challenges limit equitable availability of high-value treatments and slow adoption of innovative therapeutic options.
2. Shortage of Specialized Diagnostic and Treatment Centers
Rare hematology disorders require multidisciplinary expertise, but many regions lack specialized immunology and transplant centers needed for accurate diagnosis and advanced care. Workforce shortages in clinical immunologists, hematologists, and genetic counselors delay treatment initiation and reduce diagnostic accuracy. Limited laboratory infrastructure restricts access to high-complexity testing such as genomic sequencing and complement pathway assessment. This capability gap creates disparities in patient outcomes and constrains the market’s ability to scale advanced therapeutic solutions globally.
Regional Analysis
North America
North America leads the Rare Hematology Disorders Market with around 40% share, supported by advanced diagnostic infrastructure, strong adoption of immunoglobulin therapies, and early integration of genomic screening programs. The region benefits from well-established specialty hematology centers and favorable reimbursement frameworks that increase treatment accessibility. Growth strengthens as clinical research networks expand trial enrollment for gene therapy and emerging biologics. High awareness levels and structured patient registries improve disease tracking and support precision-based interventions. Ongoing investment in digital monitoring platforms further enhances long-term disease management and optimizes treatment outcomes across both pediatric and adult populations.
Europe
Europe holds approximately 30% share, driven by strong regulatory support for orphan drugs, broad implementation of newborn screening programs, and increasing deployment of molecular diagnostic technologies across national health systems. The region benefits from collaborative research networks that accelerate development of targeted therapies and harmonize treatment standards for rare hematologic conditions. Adoption of subcutaneous immunoglobulin formulations grows as patient preference shifts toward home-based administration. Expanding clinical capabilities in stem cell transplantation and improved cross-border healthcare frameworks strengthen market momentum. Rising emphasis on cost-effectiveness assessments influences treatment uptake, shaping long-term reimbursement pathways across EU member states.
Asia-Pacific
Asia-Pacific accounts for around 20% share, with growth driven by expanding healthcare infrastructure, rising investments in genetic testing, and improved access to specialty immunology services. Countries such as Japan, South Korea, China, and Australia increasingly integrate genomic profiling and immunophenotyping into routine hematology diagnostics. Patient awareness improves as government-led education initiatives highlight the importance of early identification of immunodeficiencies. Adoption of immunoglobulin therapies increases with greater availability of intravenous and subcutaneous formulations. Despite robust momentum, disparities in healthcare access persist, creating opportunities for telemedicine-enabled rare disease management across geographically dispersed populations.
Latin America
Latin America represents about 6% share, influenced by growing improvement in tertiary care facilities and gradual expansion of diagnostic capabilities for rare hematology disorders. Major countries improve access to immunoglobulin therapies through public–private partnerships and expanded national formulary coverage. Adoption remains slower than in developed regions due to reimbursement limitations and uneven availability of genomic testing tools. Training programs for clinical immunologists and hematologists support improved diagnostic accuracy, while international collaborations enhance clinical trial participation. Rising awareness of primary immunodeficiencies drives earlier diagnosis, strengthening long-term demand for advanced therapies across key metropolitan centers.
Middle East & Africa
The Middle East & Africa region holds approximately 4% share, supported by increasing government investment in specialized hematology centers and growing adoption of advanced diagnostic platforms in Gulf countries. Improved access to immunoglobulin therapy and strengthening referral networks enhance treatment continuity for chronic immunologic disorders. However, limited genomic testing availability and workforce shortages continue to constrain broader market penetration. International partnerships help address gaps in clinical expertise, while rising prevalence of inherited hematologic conditions drives demand for early screening programs. Expansion of private healthcare infrastructure improves access, particularly in the UAE, Saudi Arabia, and South Africa.
Market Segmentations:
By Disease Type:
- Antibody deficiencies
- Combined immunodeficiencies
By Treatment Type:
- Immunoglobulin replacement therapy (IRT)
- Hematopoietic stem cell transplantation (HSCT)
By Age Group:
- Pediatric
- Adult
By Geography
- North America
- U.S.
- Canada
- Mexico
- Europe
- Germany
- France
- U.K.
- Italy
- Spain
- Rest of Europe
- Asia Pacific
- China
- Japan
- India
- South Korea
- South-east Asia
- Rest of Asia Pacific
- Latin America
- Brazil
- Argentina
- Rest of Latin America
- Middle East & Africa
- GCC Countries
- South Africa
- Rest of the Middle East and Africa
Competitive Landscape
The Rare Hematology Disorders Market features including Shenzhen Mindray Bio-Medical Electronics Co., Ltd., Beckman Coulter, Inc., EKF Diagnostics, Horiba, NIHON KOHDEN CORPORATION, Abbott, Siemens Healthineers AG, Sysmex Corporation, Bio-Rad Laboratories, and F. Hoffmann-La Roche Ltd. The Rare Hematology Disorders Market features a highly innovation-driven competitive environment as companies focus on advanced diagnostic technologies, precision screening tools, and targeted therapeutic platforms. Industry participants invest heavily in molecular assays, high-sensitivity hematology analyzers, and automated immunology workflows to improve detection accuracy and streamline specialty testing. Many manufacturers strengthen competitiveness through strategic partnerships with research institutions, expansion of digital diagnostic capabilities, and integration of AI-enabled analytics that enhance clinical decision-making. Continuous advancements in genomic profiling, biomarker discovery, and personalized therapy development shape market differentiation, while global expansion of specialized distribution networks improves accessibility across both developed and emerging healthcare systems.
Key Player Analysis
- Shenzhen Mindray Bio-Medical Electronics Co., Ltd.
- Beckman Coulter, Inc.
- EKF Diagnostics
- Horiba
- NIHON KOHDEN CORPORATION
- Abbott
- Siemens Healthineers AG
- Sysmex Corporation
- Bio-Rad Laboratories
- Hoffmann-La Roche Ltd
Recent Developments
- In September 2024, Beckman Coulter and Scopio Labs expanded their existing partnership to globally distribute Scopio's AI-powered digital cell morphology platforms, especially the full-field imaging for bone marrow (FF-BMA), aiming to significantly accelerate adoption of this technology for faster, more automated blood and bone marrow analysis, replacing traditional microscopy.
- In January 2024, HORIBA Medical has launched the new HELO 2.0 high throughput automated hematology platform which is CE-IVDR approved, with pending US FDA approval automated hematology platform, offering higher modular solutions with a range of track-based system and quality-controlled parameters.
- In May 2023, Siemens Healthineers launched its next-gen Atellica HEMA 570 and 580 hematology analyzers in May 2023, targeting high-volume labs with features like intuitive interfaces, automated workflows via multi-analyzer connectivity, faster processing (up to 120 tests/hr), and advanced parameters (like optical platelets on the 580), all designed to boost lab efficiency and reduce bottlenecks for quicker diagnoses.
Report Coverage
The research report offers an in-depth analysis based on Disease Type, Treatment Type, Age Group and Geography. It details leading market players, providing an overview of their business, product offerings, investments, revenue streams, and key applications. Additionally, the report includes insights into the competitive environment, SWOT analysis, current market trends, as well as the primary drivers and constraints. Furthermore, it discusses various factors that have driven market expansion in recent years. The report also explores market dynamics, regulatory scenarios, and technological advancements that are shaping the industry. It assesses the impact of external factors and global economic changes on market growth. Lastly, it provides strategic recommendations for new entrants and established companies to navigate the complexities of the market.
Future Outlook
- The market will advance as genomic sequencing becomes widely integrated into routine hematology diagnostics.
- Adoption of gene therapy will accelerate as more curative candidates progress through late-stage clinical trials.
- Immunoglobulin therapy demand will rise with improved formulation flexibility and growing chronic patient pools.
- Digital health platforms will enhance remote monitoring, adherence tracking, and personalized treatment adjustments.
- Precision medicine will expand as biomarkers and mutation-specific targets gain clinical relevance.
- Global research collaborations will strengthen innovation pipelines and increase trial accessibility.
- AI-enabled diagnostic tools will improve early detection and reduce clinical decision-making time.
- Emerging markets will experience faster growth as healthcare infrastructure and specialty care capacity expand.
- Reimbursement frameworks will evolve to support advanced therapies and reduce patient access barriers.
- Increased patient advocacy and awareness initiatives will drive earlier diagnosis and sustained long-term therapy adoption.
Request a Free Sample
Fill in your details and we'll send you a free sample report.
- Sample data tables & charts
- Research methodology
Need a Custom Version of This Report?
Tailor the scope, geography, or segments to your exact requirements.
- Custom geography or segment scope
- Direct access to our analyst team
Frequently Asked Questions
What is the current market size for the Rare Hematology Disorders Market, and what is its projected size in 2032?
At what Compound Annual Growth Rate is the Rare Hematology Disorders Market projected to grow between 2024 and 2032?
Which Rare Hematology Disorders Market segment held the largest share in 2024?
What are the primary factors fueling the growth of the Rare Hematology Disorders Market?
Who are the leading companies in the Rare Hematology Disorders Market?
Which region commanded the largest share of the Rare Hematology Disorders Market in 2024?
Table of Content
Chapter 1. Report Introduction
- 1.1 Report Description & Purpose
- 1.1.1 Report Title & Market Definition
- 1.1.2 Unique Selling Propositions (USP) & Key Differentiators
- 1.1.3 Value Proposition for Stakeholders
- 1.2 Research Objectives
- 1.2.1 Market Sizing Objectives (Volume & Revenue)
- 1.2.2 Segmentation Objectives
- 1.2.3 Competitive Intelligence Objectives
- 1.2.4 Forecast & Scenario Objectives
- 1.3 Report Scope
- 1.3.1 Rare Hematology Disorders Scope – Types & Subtypes Covered
- 1.3.2 Geographic Scope – Regions & Countries Covered
- 1.3.3 Historical Period, Base Year & Forecast Period (2024; forecast to 2032)
- 1.3.4 Inclusions & Exclusions
- 1.4 HS Code & Classification Framework
- 1.5 Currency, Units & Pricing Basis
- 1.6 Target Stakeholders
- 1.7 Limitations & Assumptions
Chapter 2. Executive Summary
- 2.1 Global Rare Hematology Disorders Market Snapshot
- 2.1.1 Market Size – Historical (2024) & Forecast (2024-2032) (2024: USD 15,079.5 million → 2032: USD 23,142.31 million)
- 2.1.2 Volume & Revenue – Global Totals
- 2.1.3 Key Market Highlights – Top Five Facts
- 2.2 Rare Hematology Disorders Market Segmentation Snapshot
- 2.2.1 Market Split by Region – 2024 vs. 2032
- 2.3 Competitive Snapshot
- 2.3.1 Top 10 Players by Revenue Share – 2024
- 2.3.2 Top 10 Players by Volume Share – 2024
- 2.3.3 Recent Strategic Developments (18-Month Summary)
- 2.4 Key Investment Highlights & Strategic Conclusions
Chapter 3. Rare Hematology Disorders Market Dynamics & Industry Analysis
- 3.1 Market Overview & Context
- 3.1.1 Rare Hematology Disorders Market Position in the Broader Automotive Value Chain
- 3.1.2 OEM vs. Replacement Market Dynamics
- 3.1.3 Market Maturity & Development Stage by Region
- 3.2 Rare Hematology Disorders Market Drivers
- 3.3 Rare Hematology Disorders Market Restraints & Challenges
- 3.4 Rare Hematology Disorders Market Opportunities
- 3.5 Porter's Five Forces Analysis
- 3.5.1 Threat of New Entrants
- 3.5.2 Bargaining Power of Suppliers
- 3.5.3 Bargaining Power of Buyers
- 3.5.4 Threat of Substitutes
- 3.5.5 Competitive Rivalry – Intensity Assessment
- 3.6 Rare Hematology Disorders Value Chain Analysis
- 3.6.1 Upstream – Raw Material/Input Suppliers
- 3.6.1.1 Raw Material/Input 1
- 3.6.1.2 Raw Material/Input 2
- 3.6.1.3 Raw Material/Input 3
- 3.6.2 Midstream – Production/Manufacturing/Service Delivery
- 3.6.2.1 Production/Process Overview
- 3.6.2.2 Key Facility Locations & Capacity by Manufacturer
- 3.6.3 Downstream – Distribution & End Consumer
- 3.6.3.1 Primary Channel – B2B/OEM
- 3.6.3.2 Secondary Channels – Dealer, Retail, Online, Direct
- 3.6.4 Value Chain Profitability Analysis
- 3.6.1 Upstream – Raw Material/Input Suppliers
- 3.7 PESTEL Analysis
- 3.7.1 Political Factors
- 3.7.2 Economic Factors
- 3.7.3 Social Factors
- 3.7.4 Technological Factors
- 3.7.5 Environmental Factors
- 3.7.6 Legal Factors
- 3.8 Rare Hematology Disorders Supply Chain Analysis
- 3.8.1 Raw Material/Input Supply Risk Assessment
- 3.8.2 Manufacturing Concentration Risk (Geographic Exposure)
- 3.8.3 Trade Disruption Impact Analysis
- 3.9 Regulatory & Policy Landscape
Note: The regulatory and policy landscape section covers regulations based on their applicability to the market, Rare Hematology Disorders category, geography, and scope of the study. Only regulatory frameworks with a material impact on operations, compliance, trade, sustainability, or market access are analyzed in detail.
Chapter 4. Key Investment Pockets & Opportunity Analysis
- 4.1 Rare Hematology Disorders Market Attractiveness Analysis
- 4.1.1 By Region – Investment Attractiveness Matrix (Volume × CAGR)
- 4.2 Absolute Revenue Growth Opportunity
- 4.2.1 By Region – Absolute USD Growth Through 2032
- 4.3 Incremental Volume Opportunity
- 4.3.1 By Region – Incremental Volume Through 2032
- 4.3.2 Segment – Incremental Volume
- 4.4 Emerging Submarket Opportunity Deep Dive (Subject to Applicability)
- 4.5 Emerging Market Opportunity Scorecards
- 4.5.1 United States
- 4.5.2 Europe
- 4.5.3 Asia
- 4.5.4 Middle East & Africa
Note: Emerging Market Opportunity Scorecards will be included based on relevance and strategic importance. Regions listed are indicative and may vary depending on data availability and market dynamics.
Chapter 5. Rare Hematology Disorders Import-Export Analysis & Trade Flows
- 5.1 Global Trade Overview
- 5.1.1 Global Export Value by Country (2024)
- 5.1.2 Global Export Volume by Country (2024)
- 5.1.3 Global Import Value by Country (2024)
- 5.1.4 Global Import Volume by Country (2024)
- 5.1.5 Net Trade Balance by Country (2024)
- 5.2 Export Analysis – Segment
- 5.2.1 Type 1 (HS Code)
- 5.2.2 Type 2 (HS Code)
- 5.2.3 Type 3 (HS Code)
- 5.2.4 Type 4 (HS Code)
- 5.2.5 Type 5 (HS Code)
- 5.3 Import Analysis – Segment
- 5.3.1 Type 1 (HS Code)
- 5.3.2 Type 2 (HS Code)
- 5.3.3 Type 3 (HS Code)
- 5.3.4 Type 4 (HS Code)
- 5.3.5 Type 5 (HS Code)
- 5.4 Average Unit Trade Prices
- 5.4.1 Average Export Price – Segment & Country
- 5.4.2 Average Import Price – Segment & Source Country
- 5.4.3 Price Trends (2024)
- 5.5 Key Trade Route Analysis
- 5.5.1 Trade Route 1
- 5.5.2 Trade Route 2
- 5.5.3 Trade Route 3
- 5.5.4 Trade Route 4
- 5.5.5 Trade Route 5
- 5.6 Trade Policy Impact Assessment
- 5.6.1 US Anti-Dumping & Section 301 Tariffs
- 5.6.2 EU Customs Union Impact
- 5.6.3 Major Free Trade Agreements
- 5.6.4 USMCA Rules of Origin
Note: Trade policy analysis will be included only where relevant to the Rare Hematology Disorders market.
Chapter 6. Competitive Landscape & Company Benchmarking
- 6.1 Rare Hematology Disorders Market Concentration & Structure
- 6.1.1 Herfindahl-Hirschman Index (HHI) – vs. 2024
- 6.1.2 Tier 1, Tier 2 & Tier 3 Market Structure
- 6.1.3 Global, Regional & Local Player Dynamics
- 6.2 Rare Hematology Disorders Market Share Analysis – 2024
- 6.2.1 Global Revenue Share by Company
- 6.2.2 Global Volume Share by Company
- 6.2.3 Regional Revenue Share
- 6.2.4 Market Share Evolution ( vs. 2024)
- 6.2.5 OEM Segment Share by Company
- 6.2.6 Replacement Segment Share by Company
- 6.3 Production/Delivery Capacity & Facility Analysis
- 6.3.1 Global Installed Capacity
- 6.3.2 Capacity Utilization Rates
- 6.3.3 Production/Output Volume
- 6.3.4 Facility Locations & Capacity Map
- 6.3.5 Planned Capacity Additions
- 6.4 Rare Hematology Disorders Competitive Benchmarking Matrix
- 6.4.1 Revenue, Volume, CAGR & Profitability Comparison
- 6.4.2 Channel Revenue Mix
- 6.4.3 Geographic Revenue Exposure
- 6.4.4 R&D Intensity
- 6.4.5 Sustainability Maturity
- 6.5 Strategic Developments in Rare Hematology Disorders (Last 24 Months)
- 6.5.1 Mergers, Acquisitions & Divestments
- 6.5.2 New Rare Hematology Disorders Launches
- 6.5.3 Facility Expansions
- 6.5.4 Strategic Alliances, Joint Ventures & Partnerships
- 6.5.5 Distribution Expansion & Market Entry
- 6.5.6 Sustainability & ESG Initiatives
- 6.6 Competitive Strategy Mapping
- 6.6.1 Leader, Challenger, Follower & Niche Classification
- 6.6.2 Pricing Strategy Comparison
- 6.6.3 Channel Strategy Matrix
Note: Strategic developments are included based on their materiality and the availability of reliable information.
Chapter 7. Global Rare Hematology Disorders Market – By Distribution Channel
- 7.1 Segment Overview
- 7.1.1 Volume & Revenue Split by Channel (2024 & 2032)
- 7.1.2 Channel Mix Evolution (2024-2032)
Chapter 8. Regional Market Analysis – Global Overview
- 8.1 Global Regional Overview
- 8.1.1 Regional Volume Share
- 8.1.2 Regional Revenue Share
- 8.1.3 Regional Volume by Region
- 8.1.4 Regional Revenue by Region
- 8.1.5 Regional Forecast Through 2032
- 8.2 Cross-Regional Segment Analysis
- 8.2.1 By Distribution Channel
- 8.2.2 By Brand/Price Tier
Chapter 9. North America Rare Hematology Disorders Market
- 9.1 United States
- 9.2 Canada
- 9.3 Mexico
Chapter 10. Europe Rare Hematology Disorders Market
- 10.1 Germany
- 10.2 France
- 10.3 Italy
- 10.4 United Kingdom
- 10.5 Spain
- 10.6 Poland
- 10.7 Russia
- 10.8 Netherlands
- 10.9 Belgium
- 10.10 Sweden
- 10.11 Denmark
- 10.12 Norway
- 10.13 Rest of Europe
Chapter 11. Asia Pacific Rare Hematology Disorders Market
- 11.1 China
- 11.2 India
- 11.3 Japan
- 11.4 South Korea
- 11.5 Thailand
- 11.6 Indonesia
- 11.7 Vietnam
- 11.8 Malaysia
- 11.9 Australia
- 11.10 Rest of Asia Pacific
Chapter 12. Latin America Rare Hematology Disorders Market
- 12.1 Brazil
- 12.2 Argentina
- 12.3 Colombia
- 12.4 Chile
- 12.5 Rest of Latin America
Chapter 13. Middle East Rare Hematology Disorders Market
- 13.1 Saudi Arabia
- 13.2 United Arab Emirates
- 13.3 Turkey
- 13.4 Israel
- 13.5 Iran
- 13.6 Rest of the Middle East
Chapter 14. Africa Rare Hematology Disorders Market
- 14.1 South Africa
- 14.2 Egypt
- 14.3 Nigeria
- 14.4 Morocco
- 14.5 Rest of Africa
Chapter 15. Rare Hematology Disorders Company Profiles
- 15.1 [Company 01]
- 15.1.1 Company Overview
- 15.1.2 Key Management Personnel
- 15.1.3 Products & Services Portfolio
- 15.1.4 Financial Performance
- 15.1.5 Key Market Focus & Geographic Presence
- 15.1.6 Recent Developments & Strategic Initiatives
Note: The company profile list is preliminary and may change based on research findings, market developments, data availability, and client requirements.
Chapter 16. Appendices
- Appendix A – List of Abbreviations & Acronyms
- Appendix B – Industry Classification Code Reference – Full Series
- Appendix C – Production & Capacity Data Tables
- Appendix D – End-Use & Demand Base Tables
- Appendix E – Consumption & Replacement Rate Assumptions
- Appendix F – ASP Reference Tables
- Appendix G – Manufacturing & Facility Database
- Appendix H – Import-Export Data Tables
- Appendix I – Regulatory Summary Tables
- Appendix J – Primary Research Participant List (Anonymized)
- Appendix K – Primary Research Questionnaire Framework
- Appendix L – Data Sources & Bibliography
- Appendix M – Market Size Divergence & Source Comparison
Chapter 17. Research Methodology
- 17.1 Research Framework & Philosophy
- 17.2 Secondary Research – Sources, Hierarchy & Data Extraction
- 17.3 Data Modeling – Bottom-Up & Top-Down Market Sizing
- 17.4 Primary Research – Stakeholder Framework, LOI & Sample Sizes
- 17.5 Forecast Methodology – Regression, Scenario & Sensitivity Analysis
- 17.6 Quality Control – Four-Layer Validation Framework
- 17.7 Limitations & Standard Assumptions
- 17.8 Disclaimer
