Market Overview
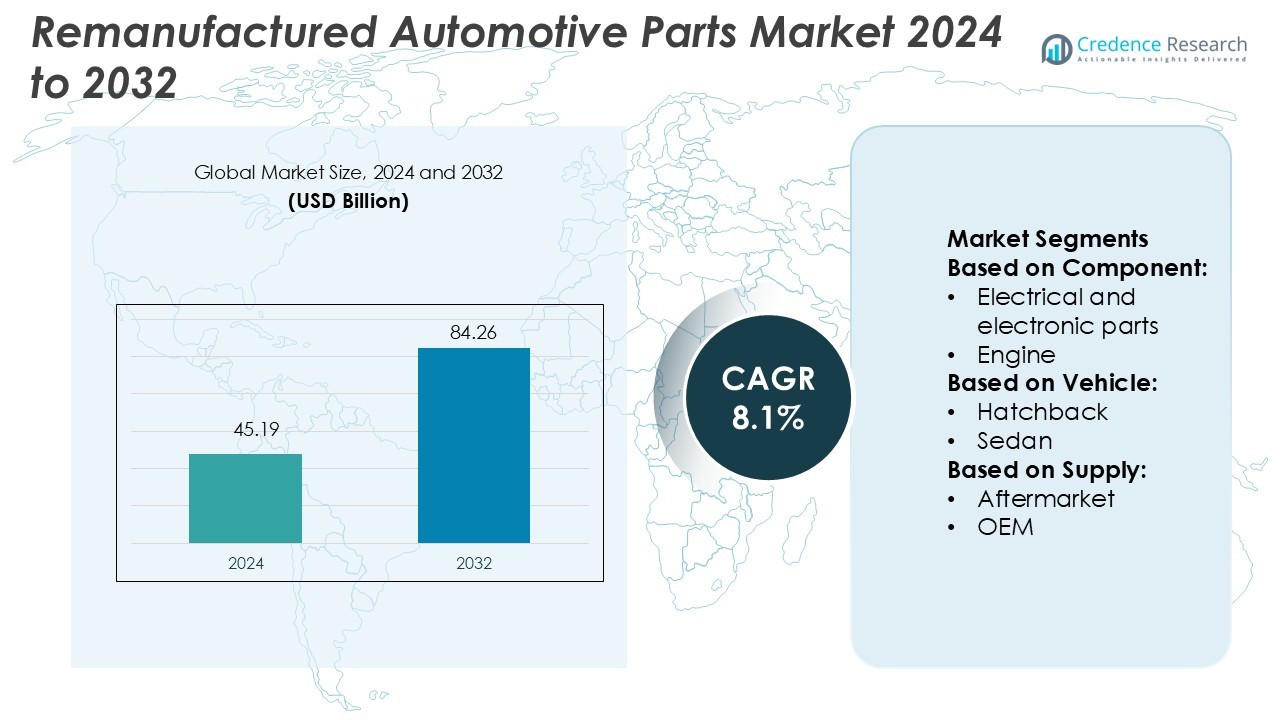
Remanufactured Automotive Parts Market size was valued USD 45.19 billion in 2024 and is anticipated to reach USD 84.26 billion by 2032, at a CAGR of 8.1% during the forecast period.
| REPORT ATTRIBUTE |
DETAILS |
| Historical Period |
2020-2023 |
| Base Year |
2024 |
| Forecast Period |
2025-2032 |
| Remanufactured Automotive Parts Market Size 2024 |
USD 45.19 Billion |
| Remanufactured Automotive Parts Market, CAGR |
8.1% |
| Remanufactured Automotive Parts Market Size 2032 |
USD 84.26 Billion |
The remanufactured automotive parts market is driven by top players including NAPA, Eaton, Bosch, Carwood, Motorcar Parts of America, Stellantis, Denso, BorgWarner, Valeo, and Cardone. These companies focus on product diversification, technological innovation, and sustainable remanufacturing practices to strengthen their competitive position. Many have expanded their distribution networks through partnerships with OEMs and aftermarket channels, ensuring wide availability and consistent quality. North America leads the global market with a 34% share, supported by advanced infrastructure, a mature aftermarket, and strong consumer acceptance of remanufactured parts. This leadership is expected to remain stable as regulatory and sustainability initiatives continue to advance.
Access crucial information at unmatched prices!
Request your sample report today & start making informed decisions powered by Credence Research Inc.!
Download Sample
Market Insights
- The remanufactured automotive parts market was valued at USD 45.19 billion in 2024 and is projected to reach USD 84.26 billion by 2032, growing at a CAGR of 8.1%.
- Rising demand for cost-effective, sustainable replacement parts is driving market growth, supported by the expansion of aftermarket networks and increasing OEM participation.
- Key players focus on technological innovation and partnerships to strengthen market presence, with strong competition shaping product quality and distribution strategies.
- Quality concerns and inconsistent standards among small manufacturers remain major restraints, limiting consumer trust and slowing adoption in some regions.
- North America leads with a 34% market share, followed by Europe and Asia Pacific, while electrical and electronic parts hold the largest segment share due to high replacement frequency and standardization.
Market Segmentation Analysis:
By Component
Electrical and electronic parts hold the dominant market share in the remanufactured automotive parts segment. Their high replacement frequency and cost-effectiveness drive demand. Components like alternators, starters, and control modules are easy to remanufacture with standardized processes, ensuring consistent quality. Engine and transmission parts also account for a notable share due to their high value and demand in older vehicles. The growing availability of advanced testing and diagnostic tools supports large-scale remanufacturing. Wheels, brakes, and other components contribute steadily, supported by rising consumer awareness of sustainable automotive solutions.
- For instance, NAPA’s Remanufactured Alternators are rigorously tested using computer-aided technology to ensure reliability. The process includes 100% electronic testing of the rotor and stator for maximum output, with rectifiers also undergoing 100% testing.
By Vehicle
Passenger vehicles represent the largest segment in the remanufactured automotive parts market. High vehicle ownership rates and frequent maintenance cycles increase demand for remanufactured components. Within this category, SUVs lead due to their strong global sales and rising adoption in both urban and rural areas. Sedans and hatchbacks also contribute significantly, supported by affordable maintenance options. Commercial vehicles, including LCVs, MCVs, and HCVs, show growing interest in remanufacturing to extend fleet life and lower operational costs. This demand is especially strong in logistics, construction, and transportation industries.
- For instance, Eaton’s standard remanufactured transmissions are built using 100 % genuine Eaton components, undergo 100 % dyno testing, and ship with a 2-year warranty for line-haul and vocational applications.
By Supply
The aftermarket segment holds the dominant market share in the remanufactured automotive parts market. Independent service centers and distributors offer competitive pricing and faster availability compared to OEM channels. Consumers often choose aftermarket remanufactured parts to reduce repair costs while maintaining performance standards. OEMs are increasing participation to ensure quality assurance and brand trust, but aftermarket channels remain preferred due to their wide reach. Expanding e-commerce platforms and specialized workshops further support aftermarket growth, enabling easier sourcing and installation of remanufactured components.
Key Growth Drivers
Rising Focus on Cost-Effective Vehicle Maintenance
The growing demand for affordable repair and maintenance solutions is a major market driver. Remanufactured parts offer lower prices without compromising performance, making them attractive to cost-sensitive consumers. Fleet operators and individual vehicle owners prefer these components to extend vehicle life and reduce downtime. Strong availability through aftermarket channels further supports adoption. As vehicle ownership ages globally, demand for cost-efficient replacement parts continues to rise, strengthening the remanufactured automotive parts market across passenger and commercial vehicle segments.
- For instance, Bosch’s eXchange programme remanufactures around 250,000 alternators annually at its Bernolákovo plant in Slovakia to full original-equipment specification.
Increasing Emphasis on Sustainability and Circular Economy
Sustainability goals and circular economy initiatives are accelerating market growth. Remanufacturing reduces raw material consumption, lowers carbon emissions, and minimizes waste generation. Governments and OEMs are promoting eco-friendly automotive solutions, which boosts remanufactured component adoption. Consumer preferences are shifting toward sustainable products, especially in developed regions. By reusing core components, manufacturers can cut production costs and environmental impact. This alignment with global sustainability targets enhances market attractiveness and encourages wider industry participation.
- For instance, Carwood reports its remanufactured solutions use up to 70% less raw material than new parts and consume 85% less energy in production. UK operations now source 100% of their electricity from renewable and clean energy sources to support zero-carbon supply.
OEM Involvement and Aftermarket Expansion
OEMs are increasingly integrating remanufacturing programs into their product strategies. This move builds consumer trust through warranty-backed remanufactured parts and ensures quality assurance. Aftermarket players are also expanding their product portfolios to cover a wide range of vehicle components. The growing collaboration between OEMs and aftermarket suppliers strengthens distribution networks and improves service availability. E-commerce platforms are further boosting accessibility. This ecosystem expansion drives market penetration and accelerates adoption in both developed and emerging economies.
Key Trends & Opportunities
Technological Advancements in Remanufacturing Processes
Automation, robotics, and advanced testing tools are transforming the remanufacturing process. These technologies enhance precision, reduce turnaround time, and ensure consistent quality. AI-based diagnostics and 3D scanning enable accurate fault detection, improving recovery rates for complex components. Enhanced quality assurance builds consumer confidence in remanufactured products. This trend offers manufacturers a chance to scale operations efficiently and tap into high-value segments like electronics and powertrain systems, where demand for remanufactured solutions is growing rapidly.
- For instance, SUSTAINera Circular Economy Hub in Turin (73,000 m² facility, of which 55,000 m² were repurposed) the company has achieved a 55% savings in equipment procurement by re-using existing machinery.
Growing E-Commerce and Digital Distribution
E-commerce platforms are reshaping the supply and distribution landscape for remanufactured parts. Online marketplaces allow consumers and service providers to access a wider range of components at competitive prices. Easy availability, transparent pricing, and faster delivery drive online purchases. Many aftermarket players are launching digital storefronts to strengthen their customer base. This shift creates opportunities for market expansion, especially in regions with rising digital adoption and demand for convenient, cost-effective vehicle maintenance solutions.
- For instance, DENSO Aftermarket Europe’s B2B e-commerce portal supports distributor users in 22 countries, with more than 3,500 participants in its e-learning modules linked to the digital platform.
Key Challenges
Quality Concerns and Consumer Perception
Consumer trust remains a major hurdle for the remanufactured automotive parts market. Many buyers perceive remanufactured components as inferior to new parts, despite strict quality checks. Inconsistent standards among small manufacturers further amplify this issue. Lack of proper certification and labeling creates confusion, reducing confidence. Addressing these concerns through stronger quality assurance programs, OEM involvement, and awareness campaigns is essential to strengthen market acceptance and drive long-term growth.
Regulatory and Core Supply Constraints
Regulatory requirements and limited availability of core components pose significant challenges. Remanufacturers must comply with strict environmental and safety standards, which increase production costs and complexity. Securing high-quality cores for remanufacturing is often difficult, affecting production volumes. Supply chain disruptions further limit availability and impact delivery schedules. These factors can restrict market scalability, especially in price-sensitive regions, making efficient core collection systems and regulatory alignment critical for sustainable growth.
Regional Analysis
North America
North America holds a 34% market share in the remanufactured automotive parts market. The region benefits from a mature automotive aftermarket, strong OEM participation, and advanced remanufacturing infrastructure. High vehicle ownership rates and longer vehicle lifecycles drive demand for affordable, sustainable replacement parts. Regulatory support for circular economy practices encourages the use of remanufactured components. The U.S. leads regional growth, supported by well-established distribution networks and growing e-commerce penetration. Strong adoption in passenger and commercial vehicle segments further boosts market expansion, with increasing consumer confidence in quality-certified remanufactured parts driving steady revenue growth.
Europe
Europe accounts for 28% of the market share, supported by strict environmental regulations and strong sustainability initiatives. Countries such as Germany, France, and the U.K. lead in circular economy practices, encouraging remanufacturing over replacement. The presence of major automotive OEMs accelerates the use of quality-certified remanufactured components. A well-developed aftermarket network ensures broad product availability. The region also benefits from government incentives promoting low-emission vehicle maintenance solutions. Rising demand from both passenger and commercial vehicle fleets, along with growing technological advancements in remanufacturing processes, continues to strengthen Europe’s leadership position in sustainable automotive practices.
Asia Pacific
Asia Pacific holds a 24% market share and represents one of the fastest-growing regions in the remanufactured automotive parts market. Expanding vehicle ownership, rising average vehicle age, and growing demand for cost-effective maintenance drive market growth. China, India, and Japan play a significant role, supported by rapid development of aftermarket distribution networks. Increasing awareness of environmental impact and government-led sustainability initiatives are improving market acceptance. The growth of digital platforms and e-commerce channels is boosting accessibility. Strong opportunities exist in commercial vehicle fleets, where remanufactured components offer significant cost savings and extended service life.
Latin America
Latin America represents 8% of the global market share, with Brazil and Mexico leading regional demand. The region is witnessing growing adoption of remanufactured components as vehicle ownership expands and consumers seek affordable repair solutions. Limited disposable income and rising maintenance costs make remanufactured parts a practical alternative to new components. Strengthening aftermarket networks and growing awareness of environmental benefits are supporting market growth. Government policies encouraging sustainable manufacturing practices are also emerging. The commercial vehicle segment contributes significantly, driven by logistics and transportation growth across key economies.
Middle East & Africa
The Middle East & Africa region holds a 6% market share, with the UAE, Saudi Arabia, and South Africa driving growth. The market is at an early stage but shows strong potential due to the increasing average age of vehicles and rising demand for cost-effective repair solutions. Expansion of aftermarket service centers and growing import of remanufactured components are improving accessibility. Fleet operators are adopting remanufactured parts to lower operational costs. Gradual regulatory developments promoting sustainable practices are expected to accelerate adoption. Economic diversification efforts in the Gulf region further support steady market expansion.
Market Segmentations:
By Component:
- Electrical and electronic parts
- Engine
By Vehicle:
By Supply:
By Geography
- North America
- Europe
- Germany
- France
- U.K.
- Italy
- Spain
- Rest of Europe
- Asia Pacific
- China
- Japan
- India
- South Korea
- South-east Asia
- Rest of Asia Pacific
- Latin America
- Brazil
- Argentina
- Rest of Latin America
- Middle East & Africa
- GCC Countries
- South Africa
- Rest of the Middle East and Africa
Competitive Landscape
The competitive landscape of the remanufactured automotive parts market is shaped by key players such as NAPA, Eaton, Bosch, Carwood, Motorcar Parts of America, Stellantis, Denso, BorgWarner, Valeo, and Cardone. The remanufactured automotive parts market is defined by intense innovation, expanding global reach, and a strong focus on quality. Manufacturers are investing in advanced technologies such as automated testing, precision machining, and AI-driven diagnostics to enhance efficiency and ensure consistent product performance. Strategic collaborations with OEMs and aftermarket distributors are strengthening supply chains and improving accessibility across regions. Many companies are adopting circular economy models to reduce environmental impact and optimize core recovery processes. This competitive environment is driving continuous improvement in product standards, accelerating market expansion, and supporting the growing demand for cost-effective, sustainable vehicle components.
Key Player Analysis
- NAPA
- Eaton
- Bosch
- Carwood
- Motorcar Parts of America
- Stellantis
- Denso
- BorgWarner
- Valeo
- Cardone
Recent Developments
- In Jan 2025, SIRIM QAS International introduced the 4R2S Certification to promote sustainability in Malaysia’s automotive industry, aligning with NAP 2020 goals. This initiative supports Repair, Reuse, Recycle, and Remanufacture (4R) for parts and ensures safe aftermarket services (2S), enhancing global competitiveness and environmental responsibility.
- In November 2024, Injectronics launched a 48-hour remanufacturing service to help workshops in Australia and New Zealand repair electronic components faster. The service covers engine control modules, ABS units, and more, offering a cost-effective alternative to new parts.
- In August 2024, BBB Industries announced its acquisition of All Star Auto Parts, a U.S.-based provider of remanufactured OEM and aftermarket lights and wheels., All Star serves the collision repair market through a nationwide distribution network.
- In April 2023, ZF Aftermarket announced an expansion of its range of offerings for the Indian passenger car market with introduction of three newly manufactured TRW products in India comprising shock absorbers, brake pads, and brake discs. The company emphasizes that a crucial aspect of the independent aftermarket is the repair of brakes for passenger vehicles.
Shape Your Report to Specific Countries or Regions & Enjoy 30% Off!
Report Coverage
The research report offers an in-depth analysis based on Component, Vehicle, Supply and Geography. It details leading market players, providing an overview of their business, product offerings, investments, revenue streams, and key applications. Additionally, the report includes insights into the competitive environment, SWOT analysis, current market trends, as well as the primary drivers and constraints. Furthermore, it discusses various factors that have driven market expansion in recent years. The report also explores market dynamics, regulatory scenarios, and technological advancements that are shaping the industry. It assesses the impact of external factors and global economic changes on market growth. Lastly, it provides strategic recommendations for new entrants and established companies to navigate the complexities of the market.
Future Outlook
- Demand for cost-effective replacement parts will continue to drive market expansion globally.
- OEM involvement in remanufacturing programs will increase to enhance product reliability and trust.
- Technological advancements will improve remanufacturing efficiency and product quality.
- Circular economy initiatives will strengthen as sustainability regulations become stricter.
- E-commerce platforms will play a larger role in distribution and customer reach.
- Fleet operators will adopt remanufactured components to reduce operational costs.
- Emerging markets will experience strong growth due to rising vehicle ownership.
- Standardization and certification will improve consumer confidence in remanufactured products.
- Strategic collaborations will grow between OEMs, suppliers, and aftermarket players.
- Supply chain optimization will become a key focus to meet rising global demand.


