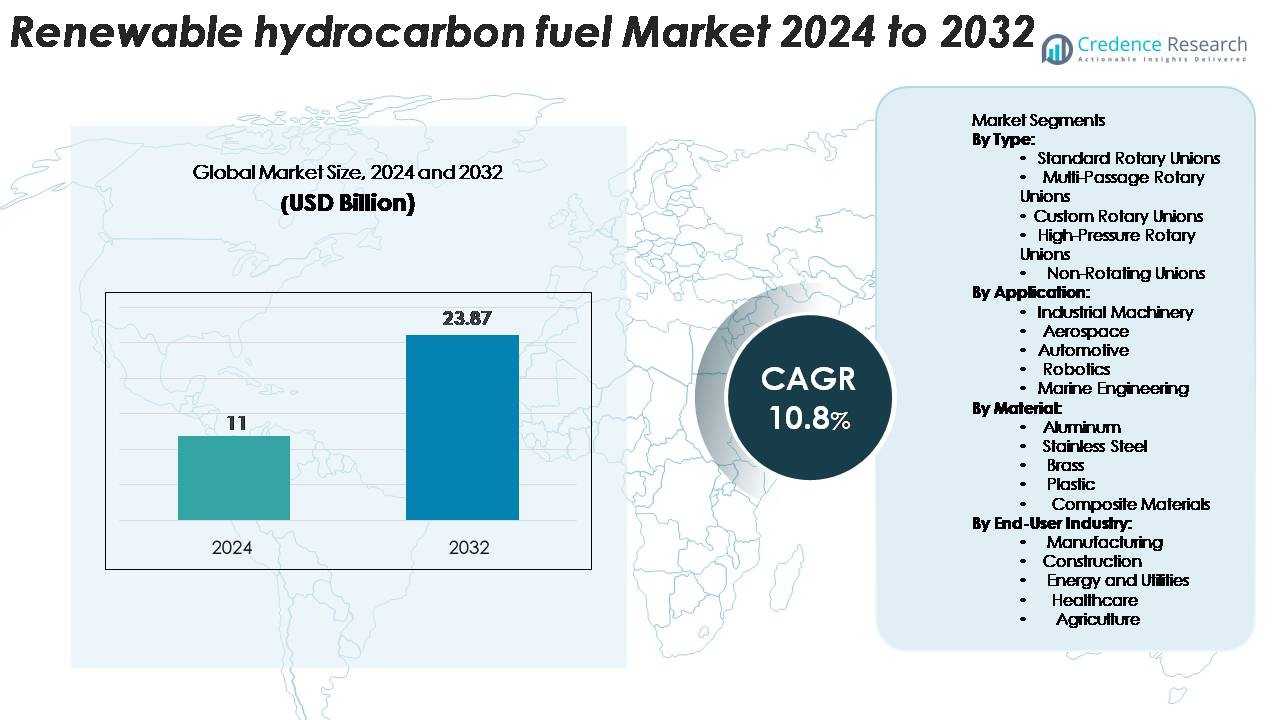
Home » Energy » Renewable Hydrocarbon Fuel Market

Renewable Hydrocarbon Fuel Market By Type (Lipids, Cellulosic Biomass) By Applications (Locomotive, Ships, Power Plant, Other)-Growth, Future Prospects & Competitive Analysis, 2016 – 2030

Price: $4999

Published: | Report ID: 19372 | Report Format : PDF

Key Highlights of the Report

The global renewable hydrocarbon fuel market is segmented by type, applications, and region. The lipids segment is the most popular, while cellulosic biomass is the primary type segment. Locomotive is the applications segment, with Asia-Pacific leading the market growth.

The global renewable hydrocarbon fuel market has been driven by several factors, such as the need to reduce dependency on fossil fuels and enhance energy security & growing concerns about climate change and environmental degradation. However, the market also faces significant challenges, including the renewable hydrocarbon fuel industry requires a robust infrastructure for production, storage, and distribution, and facing technological competition from other renewable energy technologies, such as solar, wind, and electric vehicles.

Nonetheless, the global renewable hydrocarbon fuel market offers significant growth opportunities, such as the global shift towards a low-carbon economy and the need to reduce greenhouse gas emissions.

Renewable hydrocarbon fuel market

What Are the Main Drivers Of The Global Renewable hydrocarbon fuel Market?

The global Renewable hydrocarbon fuel market is driven by several factors, including the availability and sustainability of feedstock for renewable hydrocarbon fuel production & though there have been technological advancements in renewable hydrocarbon fuel production, there are still technical challenges.

Design Element 2

Access crucial information at unmatched prices!

Request your free sample report today & start making informed decisions powered by Credence Research!

Download Free Sample
CTA Design Element 3

What Are the Major Challenges Faced by The Global Renewable hydrocarbon fuel Market?

The global Renewable hydrocarbon fuel market also faces several challenges, including the renewable hydrocarbon fuel industry requires a robust infrastructure for production, storage, and distribution and facing technological competition from other renewable energy technologies, such as wind, solar, and EV.

What Are the Growth Opportunities in The Global Renewable hydrocarbon fuel market?

The need to reduce greenhouse gas emissions and the global transition to a low-carbon economy, as well as the circular economy’s emphasis on reducing waste, reusing materials, and promoting resource efficiency, all present significant growth opportunities for the renewable hydrocarbon fuel market.

Executive Summary

Overview of the Global Renewable hydrocarbon fuel market

The desire to lessen reliance on fossil fuels, improve energy security, and rise in worries about climate change and environmental degradation have all contributed to the steady growth of the worldwide market for renewable hydrocarbon fuels in recent years. The market is distinguished by a vast variety of tools, styles, and dimensions that appeal to various consumer tastes.

Market Definition

The renewable hydrocarbon fuel market refers to the sector focused on the production, distribution, and utilization of sustainable liquid or gaseous fuels derived from renewable sources. These fuels are created using procedures that transform biomass or other renewable feedstocks into hydrocarbon-based fuels, such as biofuels or synthetic fuels. The market includes a number of industries, including those that produce, refine, distribute, and use biofuels for industrial and transportation purposes. The goal of the market for renewable hydrocarbon fuels is to offer less polluting, low-carbon substitutes for traditional fossil fuels, thereby lowering greenhouse gas emissions and promoting the development of a more sustainable energy future.

Market Insights

  • The global demand for Renewable hydrocarbon fuel was valued at USD 351.9 Billion in 2022 and is expected to reach USD 639.1671188 Billion in 2030, growing at a CAGR of 8.90% between 2023 and 2030.
  • Lipids are the leading segment and held around half of the share in terms of value in 2022, while the cellulosic biomass segment is likely to exhibit the fastest CAGR during the forecast period.
  • Locomotive is expected to post the highest CAGR during the forecast period & leading the market share with more than 30% share in 2022.
  • Asia-pacific is fueling the growth of the Renewable hydrocarbon fuel industry with nearly three-fifth share in 2022, while Europe and North America collectively accounted for just nearly under 55% share in 2022. Europe held over 25% share in 2022.
  • The need to reduce dependency on fossil fuels and enhance energy security & growing concerns about climate change and environmental degradation are the major drivers of the market.
  • At the same time, availability and sustainability of feedstock for renewable hydrocarbon fuel production & though there have been technological advancements in renewable hydrocarbon fuel production but there are still technical challenges are the main restraints.

Renewable hydrocarbon fuel market

Market Overview

The global renewable hydrocarbon fuel market has witnessed steady growth in recent years and is expected to grow at a CAGR of 8.90% between 2023 and 2030. The market was valued at USD 351.9 billion in 2022 and is expected to reach USD 639.1671188 billion in 2030.

Segmentation by Type

  • Lipids type is the leading segment and held around half a share in value in 2022.
  • Cellulosic biomass will likely exhibit the fastest CAGR during the forecast period.

Segmentation by Applications

  • The Locomotive segment governs the demand for the renewable hydrocarbon fuel industry in the world, holding a massive share, and is also expected to grow at a rapid CAGR.
  • The Power Plant segment contributes to the rest of the demand for renewable hydrocarbon fuel market.

Segmentation by Region

  • Asia-pacific was fueling the growth of the Renewable hydrocarbon fuel industry with a nearly three-fifths share in 2022.
  • Europe and North America collectively account for nearly under 55% share in 2022, with Europe holding over 25% share in the same year.
  • The rest of the world, including Latin America, The Middle East, and Africa, contributes the remainder to the demand for Renewable hydrocarbon fuels.

The market is driven by the need to lessen reliance on fossil fuels, improve energy security, and raise awareness of climate change and environmental deterioration. However, the market is restrained by the availability and sustainability of feedstock for renewable hydrocarbon fuel production & though there have been technological advancements in renewable hydrocarbon fuel production, there are still technical challenges.

China, as the world’s largest energy consumer, faces challenges related to energy security and air pollution. The country heavily relies on imported fossil fuels, leading to energy security concerns. Renewable hydrocarbon fuels provide a more sustainable and clean energy choice, lowering both pollution levels and reliance on imports. The Chinese government has put in place encouraging rules and incentives to promote the use of renewable energy sources and reduce carbon emissions. These regulations include tax breaks, production and consumption subsidies for renewable fuels, and targets for the consumption of renewable energy.

The USA has implemented supportive policies and regulations to promote renewable energy sources, including renewable hydrocarbon fuels. A favourable climate for the industry’s expansion has been established by federal and state-level efforts including the Renewable Fuel Standard (RFS), Low Carbon Fuel Standard (LCFS), and tax incentives for the production of renewable fuels. These policies provide incentives and market opportunities for renewable hydrocarbon fuel producers.

Market Drivers

Several factors drive the global renewable hydrocarbon fuel market. The following are the key drivers of the global Renewable hydrocarbon fuel market:

Environmental Sustainability and Climate Change Mitigation

Significant volumes of greenhouse gases (GHGs) are released into the atmosphere during the burning of fossil fuels, which contributes to climate change and global warming. In contrast, renewable hydrocarbon fuels offer a lower-carbon alternative, reducing GHG emissions and mitigating their environmental impact. By producing and utilizing renewable hydrocarbon fuels, the industry aims to minimize carbon dioxide (CO2) and other pollutant emissions, thereby promoting environmental sustainability.

Many countries and regions have implemented renewable fuel standards and regulations to reduce greenhouse gas emissions. For instance, the Renewable Fuel Standard (RFS) in the United States and the Renewable Energy Directive (RED) in the European Union mandate the use of renewable hydrocarbon fuels in transportation. These policies create a market demand for renewable fuels and drive the growth of the industry.

Technological Advancements and Innovation

Technological advancements and innovation play a crucial role in driving the renewable hydrocarbon fuel industry. Research and development efforts have led to significant progress in biomass conversion processes, catalysis, and refining techniques, improving the efficiency and cost-effectiveness of renewable fuel production. Innovations such as advanced biofuel pathways, thermochemical conversion technologies, and synthetic fuel production methods have enabled the industry to expand and become more commercially viable.

Market Restraints

The global Renewable hydrocarbon fuel market faces some challenges that may hinder its growth. These include the following:

High Cost of Production and Infrastructure Development

The availability and cost of biomass feedstock, such as agricultural residues or energy crops, can significantly impact the overall production cost of renewable hydrocarbon fuels. Limited availability of suitable feedstock or competition with other industries, such as food production, can drive up the cost of acquiring biomass feedstock. The conversion of biomass feedstock into renewable hydrocarbon fuels often involves complex and energy-intensive processes. Advanced technologies such as pyrolysis, gasification, or thermochemical conversion require substantial investment in research, development, and implementation. The capital and operational costs associated with these technologies can contribute to the high production cost of renewable hydrocarbon fuels.

The renewable hydrocarbon fuel industry is still in the early stages of development and has not reached the same economies of scale as the fossil fuel industry. As a result, the production volumes are relatively lower, leading to higher per-unit costs. With increased production capacity and technological advancements, economies of scale can be achieved, and production costs can be reduced.

Opportunities

The global renewable hydrocarbon fuel market offers significant growth opportunities. These include the following:

Growing Demand for Sustainable Aviation Fuels

One of the main sources of worldwide greenhouse gas emissions is the aviation industry. There is an increasing need for sustainable aviation fuels (SAF) as a way to decarbonize the aviation sector as climate change and environmental sustainability worries develop. This presents a significant opportunity for the renewable hydrocarbon fuel industry.

Governments and international organizations are implementing regulations and targets to reduce aviation emissions. For instance, the International Civil Aviation Organization (ICAO) has set goals to achieve carbon-neutral growth and a 50% reduction in aviation emissions by 2050. The renewable hydrocarbon fuel industry is attracting partnerships and investments from aviation stakeholders, including airlines, aircraft manufacturers, and airports. Collaborations between these entities and renewable fuel producers help drive innovation, research, and development efforts to improve the production processes and reduce costs of SAF. These partnerships also facilitate the expansion of production capacities and the development of dedicated supply chains for renewable hydrocarbon fuels.

Shape Your Report to Specific Countries or Regions & Enjoy 30% Off!

Competitive Landscape

Key Players

The global Renewable hydrocarbon fuel market is highly competitive, with the presence of several key players. Some of the major players in the market and their market share are as follows:

  • Global Bioenergies
  • Ensyn Corp
  • Iogen
  • Neste
  • REG
  • Star Oilco
  • Sunshine Biofuels
  • Valero
  • Next Chem (Maire Tecnimont)
  • GEVO
  • Musket
  • Next Renewable Fuels
  • Marathon Petroleum (Marathon Oil)
  • Phillips 66
  • Shell
  • BP
  • PBF Energy
  • Vertimass LLC

These companies focus on product innovation, expanding their applications, mergers, and acquisitions to stay ahead in the market.

The major players in the global Renewable hydrocarbon fuel market constantly strive to stay ahead by introducing new products and innovations.

In July 2022, Holland Hydrogen I will be Europe’s largest renewable hydrogen plant once it is operational in 2025 according to the final investment decision made by Shell plc through its subsidiaries Shell Nederland B.V. and Shell Overseas Investments B.V.

n May 2022, Renewable Energy Group, Inc. (REG), a global manufacturer and supplier of bio-based diesel, entered into collaboration agreements with CFN and Pacific Pride, two of North America’s largest cardlock fueling networks, to provide cleaner fuels through their branded cardlock networks.

Summary of Key Findings

  • Requirement to reduce dependency on fossil fuels and enhance energy security & growing concerns about climate change and environmental degradation driving market growth
  • Market segmented by type, applications, and region.
  • The lipids type is the most popular, with cellulosic biomass type as the primary type segment.
  • The locomotive is the most common applications segment.
  • Asia-Pacific is leading market growth; the market is highly competitive with key players including Ensyn Corp, Star Oilco, Sunshine Biofuels, Iogen, Neste, NextChem(Maire Tecnimont), and others.

Future Outlook

  • Positive outlook for the global renewable hydrocarbon fuel market with significant growth potential in the Europe region
  • Growth is fueled by the desire to improve energy security, lessen reliance on fossil fuels, and address rising concerns about climate change and environmental damage.
  • Issues like the need for renewable hydrocarbon fuels necessitate a strong production, storage, and distribution infrastructure in addition to facing technical competition from other renewable energy technologies like solar, wind, and electric cars.

Segmentation

  • By Type
    • Lipids
    • Cellulosic Biomass
  • By Applications
    • Locomotive
    • Ships
    • Power Plant
    • Other
  • By Region
  • North America
    • The US.
    • Canada
    • Mexico
  • Europe
    • Germany
    • France
    • The U.K.
    • Italy
    • Spain
    • Rest of Europe
  • Asia Pacific
    • China
    • Japan
    • India
    • South Korea
    • South-east Asia
    • Rest of Asia Pacific
  • Latin America
    • Brazil
    • Argentina
    • Rest of Latin America
  • Middle East & Africa
    • GCC Countries
    • South Africa
    • Rest of the Middle East and Africa

1. Preface

1.1. Report Description

1.1.1. Purpose of the Report

1.1.2. Target Audience

1.1.3. USP and Key Offerings

1.2. Research Scope

1.3. Research Methodology

1.3.1. Phase I – Secondary Research

1.3.2. Phase II – Data Modelling

1.3.2.1. Company Share Analysis Model

1.3.2.2. Revenue Based Modelling

1.3.3. Phase III – Primary Research

1.3.4. Research Limitations

1.3.5. Assumptions

1.4. Market Introduction

1.5. Market Research Scope


2. Executive Summary

2.1. Market Snapshot: Global Renewable hydrocarbon fuel Market

2.2. Global Renewable hydrocarbon fuel Market, By Type

2.3. Global Renewable hydrocarbon fuel Market, By Application

2.4. Global Renewable hydrocarbon fuel Market, By Region


3. Market Dynamics & Factors Analysis

3.1. Introduction

3.1.1. Global Renewable hydrocarbon fuel Market Value, 2017-2030, (US$ Bn)

3.1.2. Y-o-Y Growth Trend Analysis

3.2. Market Dynamics

3.2.1. Market Drivers

3.2.2. Market Restraints

3.2.3. Market Opportunities

3.2.4. Major Industry Challenges

3.3. Growth and Development Patterns

3.4. Investment Feasibility Analysis

3.5. Market Opportunity Analysis

3.5.1. Type

3.5.2. Application

3.5.3. Geography


4. Premium Insights

4.1. STAR (Situation, Task, Action, Results) Analysis

4.2. Porter’s Five Forces Analysis

4.2.1. Threat of New Entrants

4.2.2. Bargaining Power of Buyers/Consumers

4.2.3. Bargaining Power of Suppliers

4.2.4. Threat of Substitute Types

4.2.5. Intensity of Competitive Rivalry

4.3. Key Market Trends

4.3.1. Demand Side Trends

4.3.2. Supply Side Trends

4.4. Value Chain Analysis

4.5. Technology Analysis

4.6. Analysis and Recommendations

4.7. Marketing Strategy Analysis

4.7.1. Direct Marketing

4.7.2. Indirect Marketing

4.7.3. Marketing Channel Development Trend


5. Market Positioning of Key Players, 2022

5.1. Company market share of key players, 2022

5.2. Competitive Benchmarking

5.3. Market Positioning of Key Vendors

5.4. Geographical Presence Analysis

5.5. Major Strategies Adopted by Key Players

5.5.1. Key Strategies Analysis

5.5.2. Mergers and Acquisitions

5.5.3. Partnerships

5.5.4. Product Launch

5.5.5. Geographical Expansion

5.5.6. Others


6. Economic Impact Analysis

6.1. Recession Impact

6.1.1. North America

6.1.2. Europe

6.1.3. Asia Pacific

6.1.4. Latin America

6.1.5. Middle East and Africa

6.2. Ukraine-Russia War Impact

6.2.1. North America

6.2.2. Europe

6.2.3. Asia Pacific

6.2.4. Latin America

6.2.5. Middle East and Africa

6.3. COVID-19 Impact Analysis

6.3.1. North America

6.3.2. Europe

6.3.3. Asia Pacific

6.3.4. Latin America

6.3.5. Middle East and Africa


7. Global Renewable hydrocarbon fuel Market, By Type

7.1. Global Renewable hydrocarbon fuel Market Overview, by Type

7.1.1. Global Renewable hydrocarbon fuel Market Revenue Share, By Type, 2022 Vs 2030 (in %)

7.2. Lipids

7.2.1. Global Renewable hydrocarbon fuel Market, By Region, 2017-2030 (US$ Bn)

7.3. Cellulosic Biomass

7.3.1. Global Renewable hydrocarbon fuel Market, By Region, 2017-2030 (US$ Bn)


8. Global Renewable hydrocarbon fuel Market, By Application

8.1. Global Renewable hydrocarbon fuel Market Overview, by Application

8.1.1. Global Renewable hydrocarbon fuel Market, By Application, 2022 vs 2030 (in %)

8.2. Locomotive

8.2.1. Global Renewable hydrocarbon fuel Market, By Region, 2017-2030 (US$ Bn)

8.3. Ships

8.3.1. Global Renewable hydrocarbon fuel Market, By Region, 2017-2030 (US$ Bn)

8.4. Power Plant

8.4.1. Global Renewable hydrocarbon fuel Market, By Region, 2017-2030 (US$ Bn)

8.5. Other

8.5.1. Global Renewable hydrocarbon fuel Market, By Region, 2017-2030 (US$ Bn)


9. Global Renewable hydrocarbon fuel Market, By Region

9.1. Global Renewable hydrocarbon fuel Market Overview, by Region

9.1.1. Global Renewable hydrocarbon fuel Market, By Region, 2022 vs 2030 (in%)

9.2. Type

9.2.1. Global Renewable hydrocarbon fuel Market, By Type, 2017-2030 (US$ Bn)

9.3. Application

9.3.1. Global Renewable hydrocarbon fuel Market, By Application, 2017-2030 (US$ Bn)


10. North America Renewable hydrocarbon fuel Market Analysis

10.1. North America Renewable hydrocarbon fuel Market, by Type, 2017-2030(US$ Bn)

10.1.1. Overview

10.1.2. SRC Analysis

10.2. North America Renewable hydrocarbon fuel Market, by Application, 2017-2030(US$ Bn)

10.2.1. Overview

10.2.2. SRC Analysis

10.3. North America Renewable hydrocarbon fuel Market, by Country, 2017-2030 (US$ Bn)

10.3.1. North America Renewable hydrocarbon fuel Market, by Country, 2022 Vs 2030 (in%)

10.3.2. U.S.

10.3.2.1. U.S. Renewable hydrocarbon fuel Market Estimates and Forecast, 2017-2030 (US$ Bn)

10.3.2.2. U.S. Renewable hydrocarbon fuel, By Type, 2017-2030 (US$ Bn)

10.3.2.3. U.S. Renewable hydrocarbon fuel, By Application, 2017-2030 (US$ Bn)

10.3.3. Canada

10.3.3.1. Canada Renewable hydrocarbon fuel Market Estimates and Forecast, 2017-2030 (US$ Bn)

10.3.3.2. Canada Renewable hydrocarbon fuel, By Type, 2017-2030 (US$ Bn)

10.3.3.3. Canada Renewable hydrocarbon fuel, By Application, 2017-2030 (US$ Bn)

10.3.4. Mexico

10.3.4.1. Mexico Renewable hydrocarbon fuel Market Estimates and Forecast, 2017-2030 (US$ Bn)

10.3.4.2. Mexico Renewable hydrocarbon fuel, By Type, 2017-2030 (US$ Bn)

10.3.4.3. Mexico Renewable hydrocarbon fuel, By Application, 2017-2030 (US$ Bn)


11. Europe Renewable hydrocarbon fuel Market Analysis

11.1. Europe Renewable hydrocarbon fuel Market, by Type, 2017-2030(US$ Bn)

11.1.1. Overview

11.1.2. SRC Analysis

11.2. Europe Renewable hydrocarbon fuel Market, by Application, 2017-2030(US$ Bn)

11.2.1. Overview

11.2.2. SRC Analysis

11.3. Europe Renewable hydrocarbon fuel Market, by Country, 2017-2030 (US$ Bn)

11.3.1. Europe Renewable hydrocarbon fuel Market, by Country, 2022 Vs 2030 (in%)

11.3.2. Germany

11.3.2.1. Germany Renewable hydrocarbon fuel Market Estimates and Forecast, 2017-2030 (US$ Bn)

11.3.2.2. Germany Renewable hydrocarbon fuel, By Type, 2017-2030 (US$ Bn)

11.3.2.3. Germany Renewable hydrocarbon fuel, By Application, 2017-2030 (US$ Bn)

11.3.3. France

11.3.3.1. France Renewable hydrocarbon fuel Market Estimates and Forecast, 2017-2030 (US$ Bn)

11.3.3.2. France Renewable hydrocarbon fuel, By Type, 2017-2030 (US$ Bn)

11.3.3.3. France Renewable hydrocarbon fuel, By Application, 2017-2030 (US$ Bn)

11.3.4. UK

11.3.4.1. UK Renewable hydrocarbon fuel Market Estimates and Forecast, 2017-2030 (US$ Bn)

11.3.4.2. UK Renewable hydrocarbon fuel, By Type, 2017-2030 (US$ Bn)

11.3.4.3. UK Renewable hydrocarbon fuel, By Application, 2017-2030 (US$ Bn)

11.3.5. Italy

11.3.5.1. Italy Renewable hydrocarbon fuel Market Estimates and Forecast, 2017-2030 (US$ Bn)

11.3.5.2. Italy Renewable hydrocarbon fuel, By Type, 2017-2030 (US$ Bn)

11.3.5.3. Italy Renewable hydrocarbon fuel, By Application, 2017-2030 (US$ Bn)

11.3.6. Spain

11.3.6.1. Spain Renewable hydrocarbon fuel Market Estimates and Forecast, 2017-2030 (US$ Bn)

11.3.6.2. Spain Renewable hydrocarbon fuel, By Type, 2017-2030 (US$ Bn)

11.3.6.3. Spain Renewable hydrocarbon fuel, By Application, 2017-2030 (US$ Bn)

11.3.7. Rest of Europe

11.3.7.1. Rest of Europe Renewable hydrocarbon fuel Market Estimates and Forecast, 2017-2030 (US$ Bn)

11.3.7.2. Rest of Europe Renewable hydrocarbon fuel, By Type, 2017-2030 (US$ Bn)

11.3.7.3. Rest of Europe Renewable hydrocarbon fuel, By Application, 2017-2030 (US$ Bn)


12. Asia Pacific Renewable hydrocarbon fuel Market Analysis

12.1. Asia Pacific Renewable hydrocarbon fuel Market, by Type, 2017-2030(US$ Bn)

12.1.1. Overview

12.1.2. SRC Analysis

12.2. Asia Pacific Renewable hydrocarbon fuel Market, by Application, 2017-2030(US$ Bn)

12.2.1. Overview

12.2.2. SRC Analysis

12.3. Asia Pacific Renewable hydrocarbon fuel Market, by Country, 2017-2030 (US$ Bn)

12.3.1. Asia Pacific Renewable hydrocarbon fuel Market, by Country, 2022 Vs 2030 (in%)

12.3.2. China

12.3.2.1. China Renewable hydrocarbon fuel Market Estimates and Forecast, 2017-2030 (US$ Bn)

12.3.2.2. China Renewable hydrocarbon fuel, By Type, 2017-2030 (US$ Bn)

12.3.2.3. China Renewable hydrocarbon fuel, By Application, 2017-2030 (US$ Bn)

12.3.3. Japan

12.3.3.1. Japan Renewable hydrocarbon fuel Market Estimates and Forecast, 2017-2030 (US$ Bn)

12.3.3.2. Japan Renewable hydrocarbon fuel, By Type, 2017-2030 (US$ Bn)

12.3.3.3. Japan Renewable hydrocarbon fuel, By Application, 2017-2030 (US$ Bn)

12.3.4. India

12.3.4.1. India Renewable hydrocarbon fuel Market Estimates and Forecast, 2017-2030 (US$ Bn)

12.3.4.2. India Renewable hydrocarbon fuel, By Type, 2017-2030 (US$ Bn)

12.3.4.3. India Renewable hydrocarbon fuel, By Application, 2017-2030 (US$ Bn)

12.3.5. South Korea

12.3.5.1. South Korea Renewable hydrocarbon fuel Market Estimates and Forecast, 2017-2030 (US$ Bn)

12.3.5.2. South Korea Renewable hydrocarbon fuel, By Type, 2017-2030 (US$ Bn)

12.3.5.3. South Korea Renewable hydrocarbon fuel, By Application, 2017-2030 (US$ Bn)

12.3.6. South-East Asia

12.3.6.1. South-East Asia Renewable hydrocarbon fuel Market Estimates and Forecast, 2017-2030 (US$ Bn)

12.3.6.2. South-East Asia Renewable hydrocarbon fuel, By Type, 2017-2030 (US$ Bn)

12.3.6.3. South-East Asia Renewable hydrocarbon fuel, By Application, 2017-2030 (US$ Bn)

12.3.7. Rest of Asia Pacific

12.3.7.1. Rest of Asia Pacific Renewable hydrocarbon fuel Market Estimates and Forecast, 2017-2030 (US$ Bn)

12.3.7.2. Rest of Asia Pacific Renewable hydrocarbon fuel, By Type, 2017-2030 (US$ Bn)

12.3.7.3. Rest of Asia Pacific Renewable hydrocarbon fuel, By Application, 2017-2030 (US$ Bn)


13. Latin America Renewable hydrocarbon fuel Market Analysis

13.1. Latin America Renewable hydrocarbon fuel Market, by Type, 2017-2030(US$ Bn)

13.1.1. Overview

13.1.2. SRC Analysis

13.2. Latin America Renewable hydrocarbon fuel Market, by Application, 2017-2030(US$ Bn)

13.2.1. Overview

13.2.2. SRC Analysis

13.3. Latin America Renewable hydrocarbon fuel Market, by Country, 2017-2030 (US$ Bn)

13.3.1. Latin America Renewable hydrocarbon fuel Market, by Country, 2022 Vs 2030 (in%)

13.3.2. Brazil

13.3.2.1. Brazil Renewable hydrocarbon fuel Market Estimates and Forecast, 2017-2030 (US$ Bn)

13.3.2.2. Brazil Renewable hydrocarbon fuel, By Type, 2017-2030 (US$ Bn)

13.3.2.3. Brazil Renewable hydrocarbon fuel, By Application, 2017-2030 (US$ Bn)

13.3.3. Argentina

13.3.3.1. Argentina Renewable hydrocarbon fuel Market Estimates and Forecast, 2017-2030 (US$ Bn)

13.3.3.2. Argentina Renewable hydrocarbon fuel, By Type, 2017-2030 (US$ Bn)

13.3.3.3. Argentina Renewable hydrocarbon fuel, By Application, 2017-2030 (US$ Bn)

13.3.4. Rest of Latin America

13.3.4.1. Rest of Latin America Renewable hydrocarbon fuel Market Estimates and Forecast, 2017-2030 (US$ Bn)

13.3.4.2. Rest of Latin America Renewable hydrocarbon fuel, By Type, 2017-2030 (US$ Bn)

13.3.4.3. Rest of Latin America Renewable hydrocarbon fuel, By Application, 2017-2030 (US$ Bn)


14. Middle East and Africa Renewable hydrocarbon fuel Market Analysis

14.1. Middle East and Africa Renewable hydrocarbon fuel Market, by Type, 2017-2030(US$ Bn)

14.1.1. Overview

14.1.2. SRC Analysis

14.2. Middle East and Africa Renewable hydrocarbon fuel Market, by Application, 2017-2030(US$ Bn)

14.2.1. Overview

14.2.2. SRC Analysis

14.3. Middle East and Africa Renewable hydrocarbon fuel Market, by Country, 2017-2030 (US$ Bn)

14.3.1. Middle East and Africa Renewable hydrocarbon fuel Market, by Country, 2022 Vs 2030 (in%)

14.3.2. GCC Countries

14.3.2.1. GCC Countries Renewable hydrocarbon fuel Market Estimates and Forecast, 2017-2030 (US$ Bn)

14.3.2.2. GCC Countries Renewable hydrocarbon fuel, By Type, 2017-2030 (US$ Bn)

14.3.2.3. GCC Countries Renewable hydrocarbon fuel, By Application, 2017-2030 (US$ Bn)

14.3.3. South Africa

14.3.3.1. South Africa Renewable hydrocarbon fuel Market Estimates and Forecast, 2017-2030 (US$ Bn)

14.3.3.2. South Africa Renewable hydrocarbon fuel, By Type, 2017-2030 (US$ Bn)

14.3.3.3. South Africa Renewable hydrocarbon fuel, By Application, 2017-2030 (US$ Bn)

14.3.4. Rest of Middle East and Africa

14.3.4.1. Rest of Middle East and Africa Renewable hydrocarbon fuel Market Estimates and Forecast, 2017-2030 (US$ Bn)

14.3.4.2. Rest of Middle East and Africa Renewable hydrocarbon fuel, By Type, 2017-2030 (US$ Bn)

14.3.4.3. Rest of Middle East and Africa Renewable hydrocarbon fuel, By Application, 2017-2030 (US$ Bn)


15. Company Profiles

15.1. Global Bioenergies

15.1.1. Company Overview

15.1.2. Product /Services Portfolio

15.1.3. Geographical Presence

15.1.4. Financial Summary

15.1.4.1. Market Revenue and Net Profit (2019-2022)

15.1.4.2. Business Segment Revenue Analysis

15.1.4.3. Geographical Revenue Analysis

15.2. Ensyn Corp

15.3. Iogen

15.4. Neste

15.5. REG

15.6. Star Oilco

15.7. Sunshine Biofuels

15.8. Valero

15.9. NextChem(Maire Tecnimont)

15.10. GEVO

15.11. Musket

15.12. Next Renewable Fuels

15.13. Marathon Petroleum (Marathon Oil)

15.14. Phillips 66

15.15. Shell


List of Figures

FIG. 1 Global Renewable hydrocarbon fuel Market: Research Methodology

FIG. 2 Market Size Estimation – Top Down & Bottom up Approach

FIG. 3 Global Renewable hydrocarbon fuel Market Segmentation

FIG. 4 Global Renewable hydrocarbon fuel Market, by Type, 2022 (US$ Bn)

FIG. 5 Global Renewable hydrocarbon fuel Market, by Application, 2022 (US$ Bn)

FIG. 6 Global Renewable hydrocarbon fuel Market, by Geography, 2022 (US$ Bn)

FIG. 7 Attractive Investment Proposition, by Type, 2022

FIG. 8 Attractive Investment Proposition, by Application, 2022

FIG. 9 Attractive Investment Proposition, by Geography, 2022

FIG. 10 Global Market Share Analysis of Key Renewable hydrocarbon fuel Market Manufacturers, 2022

FIG. 11 Global Market Positioning of Key Renewable hydrocarbon fuel Market Manufacturers, 2022

FIG. 12 Global Renewable hydrocarbon fuel Market Value Contribution, By Type, 2022 & 2030 (Value %)

FIG. 13 Global Renewable hydrocarbon fuel Market, by Lipids, Value, 2017-2030 (US$ Bn)

FIG. 14 Global Renewable hydrocarbon fuel Market, by  Cellulosic Biomass, Value, 2017-2030 (US$ Bn)

FIG. 15 Global Renewable hydrocarbon fuel Market Value Contribution, By Application, 2022 & 2030 (Value %)

FIG. 16 Global Renewable hydrocarbon fuel Market, by Locomotive, Value, 2017-2030 (US$ Bn)

FIG. 17 Global Renewable hydrocarbon fuel Market, by Ships, 2017-2030 (US$ Bn)

FIG. 18 Global Renewable hydrocarbon fuel Market, by Power Plant, Value, 2017-2030 (US$ Bn)

FIG. 19 Global Renewable hydrocarbon fuel Market, by Other, 2017-2030 (US$ Bn)

FIG. 20 North America Renewable hydrocarbon fuel Market, 2017-2030 (US$ Bn)

FIG. 21 U.S. Renewable hydrocarbon fuel Market, 2017-2030 (US$ Bn)

FIG. 22 Canada Renewable hydrocarbon fuel Market, 2017-2030 (US$ Bn)

FIG. 23 Europe Renewable hydrocarbon fuel Market, 2017-2030 (US$ Bn)

FIG. 24 Germany Renewable hydrocarbon fuel Market, 2017-2030 (US$ Bn)

FIG. 25 France Renewable hydrocarbon fuel Market, 2017-2030 (US$ Bn)

FIG. 26 U.K. Renewable hydrocarbon fuel Market, 2017-2030 (US$ Bn)

FIG. 27 Italy Renewable hydrocarbon fuel Market, 2017-2030 (US$ Bn)

FIG. 28 Spain Renewable hydrocarbon fuel Market, 2017-2030 (US$ Bn)

FIG. 29 Rest of Europe Renewable hydrocarbon fuel Market, 2017-2030 (US$ Bn)

FIG. 30 Asia Pacific Renewable hydrocarbon fuel Market, 2017-2030 (US$ Bn)

FIG. 31 China Renewable hydrocarbon fuel Market, 2017-2030 (US$ Bn)

FIG. 32 Japan Renewable hydrocarbon fuel Market, 2017-2030 (US$ Bn)

FIG. 33 India Renewable hydrocarbon fuel Market, 2017-2030 (US$ Bn)

FIG. 34 South Korea Renewable hydrocarbon fuel Market, 2017-2030 (US$ Bn)

FIG. 35 South-East Asia Renewable hydrocarbon fuel Market, 2017-2030 (US$ Bn)

FIG. 36 Rest of Asia Pacific Renewable hydrocarbon fuel Market, 2017-2030 (US$ Bn)

FIG. 37 Latin America Renewable hydrocarbon fuel Market, 2017-2030 (US$ Bn)

FIG. 38 Brazil Renewable hydrocarbon fuel Market, 2017-2030 (US$ Bn)

FIG. 39 Mexico Renewable hydrocarbon fuel Market, 2017-2030 (US$ Bn)

FIG. 40 Rest of Latin America Renewable hydrocarbon fuel Market, 2017-2030 (US$ Bn)

FIG. 41 Middle East & Africa Renewable hydrocarbon fuel Market, 2017-2030 (US$ Bn)

FIG. 42 GCC Countries Renewable hydrocarbon fuel Market, 2017-2030 (US$ Bn)

FIG. 43 South Africa Renewable hydrocarbon fuel Market, 2017-2030 (US$ Bn)

FIG. 44 Rest of Middle East and Africa Renewable hydrocarbon fuel Market, 2017-2030 (US$ Bn)


List of Tables

TABLE 1 Market Snapshot: Global Renewable hydrocarbon fuel Market

TABLE 2 Global Renewable hydrocarbon fuel Market: Market Drivers Impact Analysis

TABLE 3 Global Renewable hydrocarbon fuel Market: Market Restraints Impact Analysis

TABLE 4 Global Renewable hydrocarbon fuel Market, by Competitive Benchmarking, 2022

TABLE 5 Global Renewable hydrocarbon fuel Market, by Geographical Presence Analysis, 2022

TABLE 6 Global Renewable hydrocarbon fuel Market, by Key Strategies Analysis, 2022

TABLE 7 Global Renewable hydrocarbon fuel Market, by Lipids, By Region, 2017-2022 (US$ Bn)

TABLE 8 Global Renewable hydrocarbon fuel Market, by Lipids, By Region, 2023-2030 (US$ Bn)

TABLE 9 Global Renewable hydrocarbon fuel Market, by Cellulosic Biomass, By Region, 2017-2022 (US$ Bn)

TABLE 10 Global Renewable hydrocarbon fuel Market, by Cellulosic Biomass, By Region, 2023-2030 (US$ Bn)

TABLE 11 Global Renewable hydrocarbon fuel Market, by Locomotive, By Region, 2017-2022 (US$ Bn)

TABLE 12 Global Renewable hydrocarbon fuel Market, by Locomotive, By Region, 2023-2030 (US$ Bn)

TABLE 13 Global Renewable hydrocarbon fuel Market, by Ships, By Region, 2017-2022 (US$ Bn)

TABLE 14 Global Renewable hydrocarbon fuel Market, by Ships, By Region, 2023-2030 (US$ Bn)

TABLE 15 Global Renewable hydrocarbon fuel Market, by Power Plant, By Region, 2017-2022 (US$ Bn)

TABLE 16 Global Renewable hydrocarbon fuel Market, by Power Plant, By Region, 2023-2030 (US$ Bn)

TABLE 17 Global Renewable hydrocarbon fuel Market, by Other, By Region, 2017-2022 (US$ Bn)

TABLE 18 Global Renewable hydrocarbon fuel Market, by Other, By Region, 2023-2030 (US$ Bn)

TABLE 19 Global Renewable hydrocarbon fuel Market, by Type, 2017-2022 (US$ Bn)

TABLE 20 Global Renewable hydrocarbon fuel Market, by Type, 2023-2030 (US$ Bn)

TABLE 21 Global Renewable hydrocarbon fuel Market, by Application, 2017-2022 (US$ Bn)

TABLE 22 Global Renewable hydrocarbon fuel Market, by Application, 2023-2030 (US$ Bn)

TABLE 23 Global Renewable hydrocarbon fuel Market, by Region, 2017-2022 (US$ Bn)

TABLE 24 Global Renewable hydrocarbon fuel Market, by Region, 2023-2030 (US$ Bn)

TABLE 25 North America Renewable hydrocarbon fuel Market, by Type, 2017-2022 (US$ Bn)

TABLE 26 North America Renewable hydrocarbon fuel Market, by Type, 2023-2030 (US$ Bn)

TABLE 27 North America Renewable hydrocarbon fuel Market, by Application, 2017-2022 (US$ Bn)

TABLE 28 North America Renewable hydrocarbon fuel Market, by Application, 2023-2030 (US$ Bn)

TABLE 29 North America Renewable hydrocarbon fuel Market, by Country, 2017-2022 (US$ Bn)

TABLE 30 North America Renewable hydrocarbon fuel Market, by Country, 2023-2030 (US$ Bn)

TABLE 31 United States Renewable hydrocarbon fuel Market, by Type, 2017-2022 (US$ Bn)

TABLE 32 United States Renewable hydrocarbon fuel Market, by Type, 2023-2030 (US$ Bn)

TABLE 33 United States Renewable hydrocarbon fuel Market, by Application, 2017-2022 (US$ Bn)

TABLE 34 United States Renewable hydrocarbon fuel Market, by Application, 2023-2030 (US$ Bn)

TABLE 35 Canada Renewable hydrocarbon fuel Market, by Type, 2017-2022 (US$ Bn)

TABLE 36 Canada Renewable hydrocarbon fuel Market, by Type, 2023-2030 (US$ Bn)

TABLE 37 Canada Renewable hydrocarbon fuel Market, by Application, 2017-2022 (US$ Bn)

TABLE 38 Canada Renewable hydrocarbon fuel Market, by Application, 2023-2030 (US$ Bn)

TABLE 39 Mexico Renewable hydrocarbon fuel Market, by Type, 2017-2022 (US$ Bn)

TABLE 40 Mexico Renewable hydrocarbon fuel Market, by Type, 2023-2030 (US$ Bn)

TABLE 41 Mexico Renewable hydrocarbon fuel Market, by Application, 2017-2022 (US$ Bn)

TABLE 42 Mexico Renewable hydrocarbon fuel Market, by Application, 2023-2030 (US$ Bn)

TABLE 43 Europe Renewable hydrocarbon fuel Market, by Type, 2017-2022 (US$ Bn)

TABLE 44 Europe Renewable hydrocarbon fuel Market, by Type, 2023-2030 (US$ Bn)

TABLE 45 Europe Renewable hydrocarbon fuel Market, by Application, 2017-2022 (US$ Bn)

TABLE 46 Europe Renewable hydrocarbon fuel Market, by Application, 2023-2030 (US$ Bn)

TABLE 47 Europe Renewable hydrocarbon fuel Market, by Country, 2017-2022 (US$ Bn)

TABLE 48 Europe Renewable hydrocarbon fuel Market, by Country, 2023-2030 (US$ Bn)

TABLE 49 Germany Renewable hydrocarbon fuel Market, by Type, 2017-2022 (US$ Bn)

TABLE 50 Germany Renewable hydrocarbon fuel Market, by Type, 2023-2030 (US$ Bn)

TABLE 51 Germany Renewable hydrocarbon fuel Market, by Application, 2017-2022 (US$ Bn)

TABLE 52 Germany Renewable hydrocarbon fuel Market, by Application, 2023-2030 (US$ Bn)

TABLE 53 France Renewable hydrocarbon fuel Market, by Type, 2017-2022 (US$ Bn)

TABLE 54 France Renewable hydrocarbon fuel Market, by Type, 2023-2030 (US$ Bn)

TABLE 55 France Renewable hydrocarbon fuel Market, by Application, 2017-2022 (US$ Bn)

TABLE 56 France Renewable hydrocarbon fuel Market, by Application, 2023-2030 (US$ Bn)

TABLE 57 United Kingdom Renewable hydrocarbon fuel Market, by Type, 2017-2022 (US$ Bn)

TABLE 58 United Kingdom Renewable hydrocarbon fuel Market, by Type, 2023-2030 (US$ Bn)

TABLE 59 United Kingdom Renewable hydrocarbon fuel Market, by Application, 2017-2022 (US$ Bn)

TABLE 60 United Kingdom Renewable hydrocarbon fuel Market, by Application, 2023-2030 (US$ Bn)

TABLE 61 Italy Renewable hydrocarbon fuel Market, by Type, 2017-2022 (US$ Bn)

TABLE 62 Italy Renewable hydrocarbon fuel Market, by Type, 2023-2030 (US$ Bn)

TABLE 63 Italy Renewable hydrocarbon fuel Market, by Application, 2017-2022 (US$ Bn)

TABLE 64 Italy Renewable hydrocarbon fuel Market, by Application, 2023-2030 (US$ Bn)

TABLE 65 Spain Renewable hydrocarbon fuel Market, by Type, 2017-2022 (US$ Bn)

TABLE 66 Spain Renewable hydrocarbon fuel Market, by Type, 2023-2030 (US$ Bn)

TABLE 67 Spain Renewable hydrocarbon fuel Market, by Application, 2017-2022 (US$ Bn)

TABLE 68 Spain Renewable hydrocarbon fuel Market, by Application, 2023-2030 (US$ Bn)

TABLE 69 Rest of Europe Renewable hydrocarbon fuel Market, by Type, 2017-2022 (US$ Bn)

TABLE 70 Rest of Europe Renewable hydrocarbon fuel Market, by Type, 2023-2030 (US$ Bn)

TABLE 71 Rest of Europe Renewable hydrocarbon fuel Market, by Application, 2017-2022 (US$ Bn)

TABLE 72 Rest of Europe Renewable hydrocarbon fuel Market, by Application, 2023-2030 (US$ Bn)

TABLE 73 Asia Pacific Renewable hydrocarbon fuel Market, by Type, 2017-2022 (US$ Bn)

TABLE 74 Asia Pacific Renewable hydrocarbon fuel Market, by Type, 2023-2030 (US$ Bn)

TABLE 75 Asia Pacific Renewable hydrocarbon fuel Market, by Application, 2017-2022 (US$ Bn)

TABLE 76 Asia Pacific Renewable hydrocarbon fuel Market, by Application, 2023-2030 (US$ Bn)

TABLE 77 Asia Pacific Renewable hydrocarbon fuel Market, by Country, 2017-2022 (US$ Bn)

TABLE 78 Asia Pacific Renewable hydrocarbon fuel Market, by Country, 2023-2030 (US$ Bn)

TABLE 79 China Renewable hydrocarbon fuel Market, by Type, 2017-2022 (US$ Bn)

TABLE 80 China Renewable hydrocarbon fuel Market, by Type, 2023-2030 (US$ Bn)

TABLE 81 China Renewable hydrocarbon fuel Market, by Application, 2017-2022 (US$ Bn)

TABLE 82 China Renewable hydrocarbon fuel Market, by Application, 2023-2030 (US$ Bn)

TABLE 83 Japan Renewable hydrocarbon fuel Market, by Type, 2017-2022 (US$ Bn)

TABLE 84 Japan Renewable hydrocarbon fuel Market, by Type, 2023-2030 (US$ Bn)

TABLE 85 Japan Renewable hydrocarbon fuel Market, by Application, 2017-2022 (US$ Bn)

TABLE 86 Japan Renewable hydrocarbon fuel Market, by Application, 2023-2030 (US$ Bn)

TABLE 87 India Renewable hydrocarbon fuel Market, by Type, 2017-2022 (US$ Bn)

TABLE 88 India Renewable hydrocarbon fuel Market, by Type, 2023-2030 (US$ Bn)

TABLE 89 India Renewable hydrocarbon fuel Market, by Application, 2017-2022 (US$ Bn)

TABLE 90 India Renewable hydrocarbon fuel Market, by Application, 2023-2030 (US$ Bn)

TABLE 91 South Korea Renewable hydrocarbon fuel Market, by Type, 2017-2022 (US$ Bn)

TABLE 92 South Korea Renewable hydrocarbon fuel Market, by Type, 2023-2030 (US$ Bn)

TABLE 93 South Korea Renewable hydrocarbon fuel Market, by Application, 2017-2022 (US$ Bn)

TABLE 94 South Korea Renewable hydrocarbon fuel Market, by Application, 2023-2030 (US$ Bn)

TABLE 95 South-East Asia Renewable hydrocarbon fuel Market, by Type, 2017-2022 (US$ Bn)

TABLE 96 South-East Asia Renewable hydrocarbon fuel Market, by Type, 2023-2030 (US$ Bn)

TABLE 97 South-East Asia Renewable hydrocarbon fuel Market, by Application, 2017-2022 (US$ Bn)

TABLE 98 South-East Asia Renewable hydrocarbon fuel Market, by Application, 2023-2030 (US$ Bn)

TABLE 99 Rest of Asia Pacific Renewable hydrocarbon fuel Market, by Type, 2017-2022 (US$ Bn)

TABLE 100 Rest of Asia Pacific Renewable hydrocarbon fuel Market, by Type, 2023-2030 (US$ Bn)

TABLE 101 Rest of Asia Pacific Renewable hydrocarbon fuel Market, by Application, 2017-2022 (US$ Bn)

TABLE 102 Rest of Asia Pacific Renewable hydrocarbon fuel Market, by Application, 2023-2030 (US$ Bn)

TABLE 103 Latin America Renewable hydrocarbon fuel Market, by Type, 2017-2022 (US$ Bn)

TABLE 104 Latin America Renewable hydrocarbon fuel Market, by Type, 2023-2030 (US$ Bn)

TABLE 105 Latin America Renewable hydrocarbon fuel Market, by Application, 2017-2022 (US$ Bn)

TABLE 106 Latin America Renewable hydrocarbon fuel Market, by Application, 2023-2030 (US$ Bn)

TABLE 107 Latin America Renewable hydrocarbon fuel Market, by Country, 2017-2022 (US$ Bn)

TABLE 108 Latin America Renewable hydrocarbon fuel Market, by Country, 2023-2030 (US$ Bn)

TABLE 109 Brazil Renewable hydrocarbon fuel Market, by Type, 2017-2022 (US$ Bn)

TABLE 110 Brazil Renewable hydrocarbon fuel Market, by Type, 2023-2030 (US$ Bn)

TABLE 111 Brazil Renewable hydrocarbon fuel Market, by Application, 2017-2022 (US$ Bn)

TABLE 112 Brazil Renewable hydrocarbon fuel Market, by Application, 2023-2030 (US$ Bn)

TABLE 113 Argentina Renewable hydrocarbon fuel Market, by Type, 2017-2022 (US$ Bn)

TABLE 114 Argentina Renewable hydrocarbon fuel Market, by Type, 2023-2030 (US$ Bn)

TABLE 115 Argentina Renewable hydrocarbon fuel Market, by Application, 2017-2022 (US$ Bn)

TABLE 116 Argentina Renewable hydrocarbon fuel Market, by Application, 2023-2030 (US$ Bn)

TABLE 117 Rest of Latin America Renewable hydrocarbon fuel Market, by Type, 2017-2022 (US$ Bn)

TABLE 118 Rest of Latin America Renewable hydrocarbon fuel Market, by Type, 2023-2030 (US$ Bn)

TABLE 119 Rest of Latin America Renewable hydrocarbon fuel Market, by Application, 2017-2022 (US$ Bn)

TABLE 120 Rest of Latin America Renewable hydrocarbon fuel Market, by Application, 2023-2030 (US$ Bn)

TABLE 121 Middle East and Africa Renewable hydrocarbon fuel Market, by Type, 2017-2022 (US$ Bn)

TABLE 122 Middle East and Africa Renewable hydrocarbon fuel Market, by Type, 2023-2030 (US$ Bn)

TABLE 123 Middle East and Africa Renewable hydrocarbon fuel Market, by Application, 2017-2022 (US$ Bn)

TABLE 124 Middle East and Africa Renewable hydrocarbon fuel Market, by Application, 2023-2030 (US$ Bn)

TABLE 125 Middle East and Africa Renewable hydrocarbon fuel Market, by Country, 2017-2022 (US$ Bn)

TABLE 126 Middle East and Africa Renewable hydrocarbon fuel Market, by Country, 2023-2030 (US$ Bn)

TABLE 127 GCC Countries Renewable hydrocarbon fuel Market, by Type, 2017-2022 (US$ Bn)

TABLE 128 GCC Countries Renewable hydrocarbon fuel Market, by Type, 2023-2030 (US$ Bn)

TABLE 129 GCC Countries Renewable hydrocarbon fuel Market, by Application, 2017-2022 (US$ Bn)

TABLE 130 GCC Countries Renewable hydrocarbon fuel Market, by Application, 2023-2030 (US$ Bn)

TABLE 131 South Africa Renewable hydrocarbon fuel Market, by Type, 2017-2022 (US$ Bn)

TABLE 132 South Africa Renewable hydrocarbon fuel Market, by Type, 2023-2030 (US$ Bn)

TABLE 133 South Africa Renewable hydrocarbon fuel Market, by Application, 2017-2022 (US$ Bn)

TABLE 134 South Africa Renewable hydrocarbon fuel Market, by Application, 2023-2030 (US$ Bn)

TABLE 135 Rest of Middle East and Africa Renewable hydrocarbon fuel Market, by Type, 2017-2022 (US$ Bn)

TABLE 136 Rest of Middle East and Africa Renewable hydrocarbon fuel Market, by Type, 2023-2030 (US$ Bn)

TABLE 137 Rest of Middle East and Africa Renewable hydrocarbon fuel Market, by Application, 2017-2022 (US$ Bn)

TABLE 138 Rest of Middle East and Africa Renewable hydrocarbon fuel Market, by Application, 2023-2030 (US$ Bn)

Frequently Asked Questions

What is the current size of the global renewable hydrocarbon fuel market?

The global Renewable hydrocarbon fuel market was valued at USD 351.9 Billion in 2022.

What is the expected growth rate of the Renewable hydrocarbon fuel market between 2023 and 2030?

The Renewable hydrocarbon fuel market is expected to grow at a CAGR of 8.90% between 2023 and 2030, reaching USD 639.1671188 Billion in 2030.

Which type segment is leading the market share in terms of product type?

Lipids is the leading segment by type, holding around half of the share in value in 2022.

Which applications governs the demand for Renewable hydrocarbon fuels in the world?

The Locomotive governs the demand for Renewable hydrocarbon fuels worldwide, holding a massive share of nearly 30% in 2022.

Which segment is expected to post the highest CAGR during the forecast period?

Cellulosic Biomass is expected to post the highest CAGR during the forecast period.

Which region is fueling the growth of the Renewable hydrocarbon fuel industry?

Asia-pacific is fueling the growth of the Renewable hydrocarbon fuel industry, with nearly three-fifth share in 2022.

Who are the major players in the global Renewable hydrocarbon fuel market?

The top players include Ensyn Corp, Star Oilco, Sunshine Biofuels, Iogen, Neste, Next Chem(Maire Tecnimont), Musket, Phillips 66, Next Renewable Fuels, and others.

What is the major market driver of the renewable hydrocarbon fuel industry?

The need to reduce dependency on fossil fuels and enhance energy security & growing concerns about climate change and environmental degradation are the major market drivers.

What are the major market restraints of the renewable hydrocarbon fuel industry?

Availability and sustainability of feedstock for renewable hydrocarbon fuel production & there have been technological advancements in renewable hydrocarbon fuel production, but some technical challenges are still restraints of the renewable hydrocarbon fuel industry.

What are the major market opportunities of the renewable hydrocarbon fuel industry?

The global shift towards a low-carbon economy and the need to reduce greenhouse gas emissions & concept of a circular economy that focuses on reducing waste, reusing materials, and promoting resource efficiency, aligns well with the renewable hydrocarbon fuel industry are opportunities for the renewable hydrocarbon fuel industry.

Produced Water Treatment Market

Published:
Report ID: 8130

Power Distribution Unit Market

Published:
Report ID: 11062

Smart Grid Market

Published:
Report ID: 6144

Hydraulic Fracturing Market

Published:
Report ID: 7544

Coal Bed Methane Market

Published:
Report ID: 3595

Solar Water Pump Market

Published:
Report ID: 36797

Artificial Lift Systems Market

Published:
Report ID: 2043

U.S. Ground Power Unit Market

Published:
Report ID: 36528

Germany Ground Power Unit Market

Published:
Report ID: 36282

Solar Generator Market

Published:
Report ID: 36226

Drilling Fluids Market

Published:
Report ID: 5398

Purchase Options

$2999
Delivery Format: Excel.
$4999
Designed for the individual purchaser.
$6999
Users located at a single corporate site or regional office.
$7999
Allowed for unlimited sharing globally within one company.
Smallform of Sample request

Have a question?

User Profile

Don’t settle for less – trust Mitul to help you find the best solution.

Report delivery within 24 to 48 hours

– Other Info –

What people say?-

User Review

I am very impressed with the information in this report. The author clearly did their research when they came up with this product and it has already given me a lot of ideas.

Jana Schmidt
CEDAR CX Technologies

– Connect with us –

Phone

+91 6232 49 3207


support

24/7 Research Support


sales@credenceresearch.com

– Research Methodology –

Going beyond the basics: advanced techniques in research methodology

– Trusted By –

Pepshi, LG, Nestle
Motorola, Honeywell, Johnson and johnson
LG Chem, SIEMENS, Pfizer
Unilever, Samsonite, QIAGEN