
Market Overview:
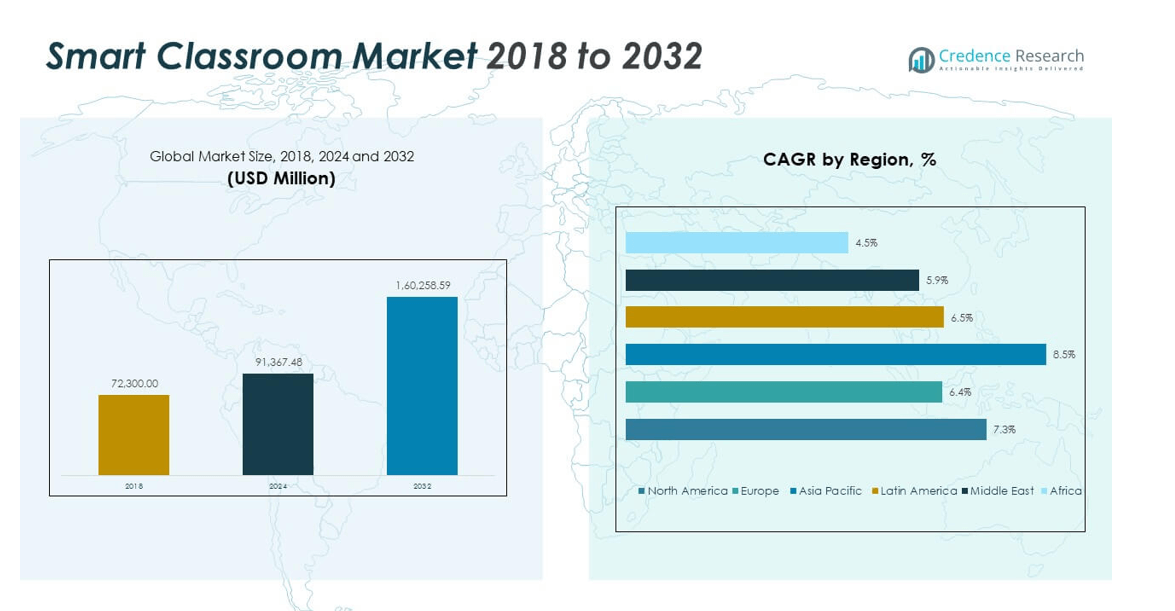
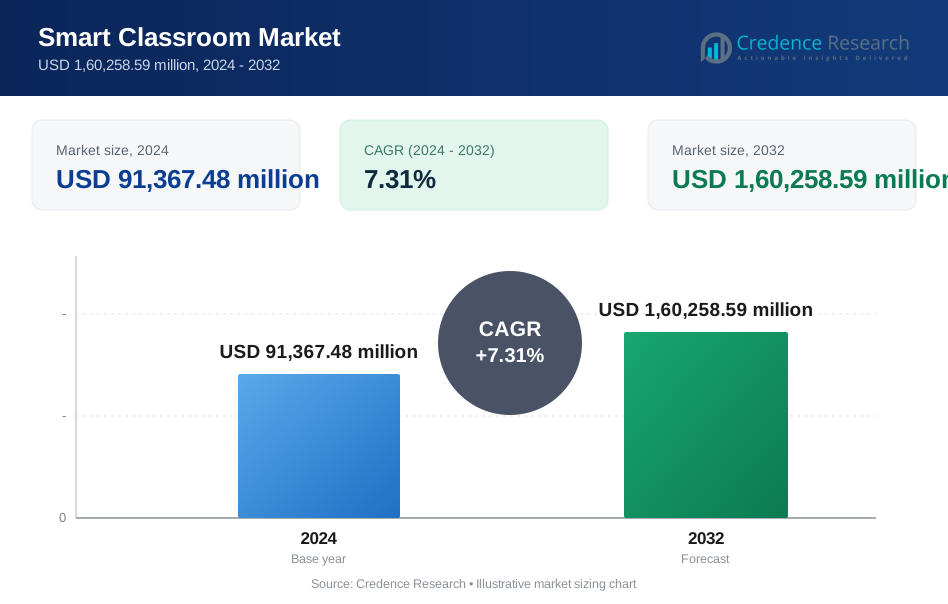
The Global Smart Classroom Market size was valued at USD 72,300.00 million in 2018 to USD 91,367.48 million in 2024 and is anticipated to reach USD 1,60,258.59 million by 2032, at a CAGR of 7.31% during the forecast period.
| REPORT ATTRIBUTE | DETAILS |
|---|---|
| Historical Period | 2020-2023 |
| Base Year | 2024 |
| Forecast Period | 2025-2032 |
| Smart Classroom Market Size 2024 | USD 91,367.48 million |
| Smart Classroom Market, CAGR | 7.31% |
| Smart Classroom Market Size 2032 | USD 1,60,258.59 million |
The market is driven by the rising adoption of digital learning tools, interactive whiteboards, and cloud-based education systems. Growing emphasis on personalized learning and the integration of artificial intelligence and analytics enhance student engagement and performance. Governments and educational institutions are investing in smart infrastructure and e-learning platforms to modernize classrooms and improve teaching efficiency, fueling overall market expansion.
North America leads the market due to its strong digital infrastructure, high education spending, and rapid integration of advanced technologies in schools and universities. Europe follows closely, driven by initiatives promoting digital literacy and blended learning models. Asia-Pacific is emerging as the fastest-growing region, supported by increasing government investments in smart education and the widespread adoption of EdTech solutions across developing nations such as India and China.
Market Insights:
- The Global Smart Classroom Market was valued at USD 72,300.00 million in 2018, reached USD 91,367.48 million in 2024, and is projected to attain USD 1,60,258.59 million by 2032, growing at a CAGR of 7.31% during the forecast period.
- North America (37.9%), Europe (27.4%), and Asia Pacific (23.9%) hold the top three shares due to advanced digital infrastructure, strong government support for digital learning, and expanding EdTech ecosystems across schools and universities.
- Asia Pacific, the fastest-growing region, accounts for 23.9% share, driven by rapid digitalization, growing student populations, and government-backed smart education initiatives in countries such as China, India, and Japan.
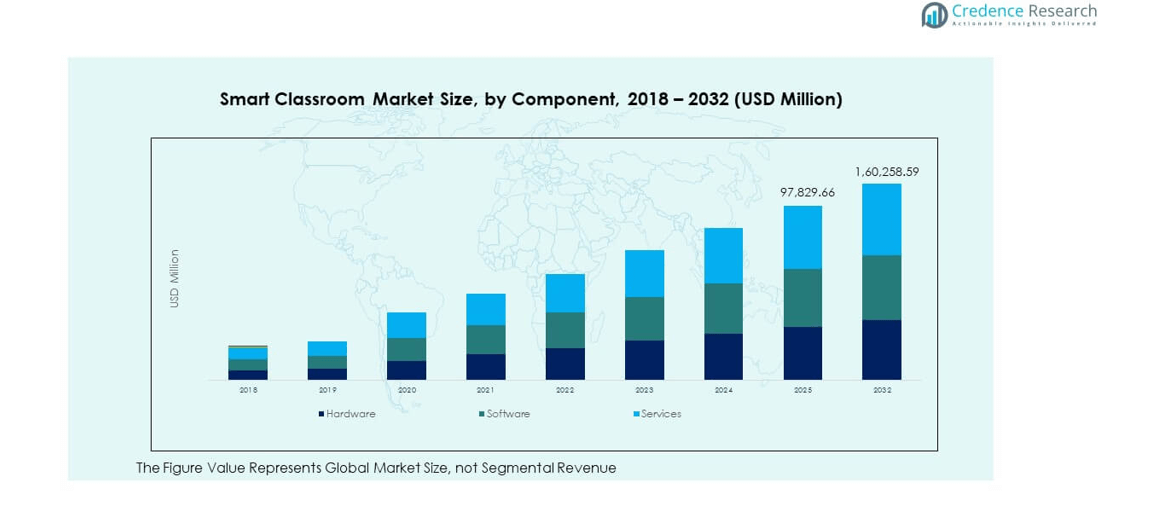
- The hardware segment dominates the component structure, accounting for about 45% of the market share due to increasing use of interactive displays and digital whiteboards.
- Software and services segments together represent around 55%, supported by growing adoption of cloud-based platforms, e-learning content, and training services that enhance personalized and hybrid learning environments.
Market Drivers:
Rising Digital Transformation in the Education Sector:
The Global Smart Classroom Market is expanding due to the growing adoption of digital education tools. Schools and universities are integrating technologies like interactive whiteboards, e-learning software, and cloud-based systems. These tools help educators improve lesson delivery and enable students to learn more effectively. Governments are supporting digitization through funding and national e-learning programs. The use of tablets and digital content encourages active participation and personalized learning experiences. Smart classrooms also allow remote access to quality education, reducing regional learning gaps. Institutions are leveraging analytics to monitor student performance and optimize learning outcomes. This transition toward digital infrastructure continues to redefine traditional education models.
- For instance, Promethean’s ActivPanel LX interactive display and Google EDLA-certified OPS-A computing module were recognized with a Tech & Learning Best of Show Award at the ISTELive 24 conference in 2024. The ActivPanel LX is designed to support Android, Chrome, Windows, and Mac environments by allowing schools to either connect an external computing module or a teacher's own device.
Integration of Artificial Intelligence and Data Analytics:
Artificial intelligence plays a key role in enhancing classroom interaction and assessment. AI-driven systems analyze learning behavior, recommend personalized study paths, and provide real-time feedback to students. Data analytics helps educators identify gaps in understanding and tailor lessons for better engagement. The Global Smart Classroom Market benefits from AI-based grading, attendance tracking, and adaptive testing systems. Intelligent tutoring and predictive analytics improve student outcomes and operational efficiency. Institutions are using AI chatbots to offer virtual guidance and administrative assistance. The integration of these technologies streamlines workflows and enhances collaboration between students and educators. Such advancements are fostering a more dynamic and responsive learning environment.
- For instance, Microsoft’s Reading Progress tool was deployed to 2,914 K–6 students in the Fresno Unified School District during the 2023–24 school year, where students submitted an average of 30 assignments and read 96 words per assignment, demonstrating measurable AI-driven assessment outcomes across thousands of learners.
Government Support and Education Infrastructure Development:
Governments across developed and emerging countries are promoting digital literacy through policy reforms and investments. Public-private partnerships are enhancing access to smart classroom technologies in schools and higher institutions. Funding for ICT programs, training for teachers, and subsidies for equipment adoption strengthen market growth. The Global Smart Classroom Market benefits from these initiatives that bridge education quality gaps. Infrastructure development, including improved internet connectivity and smart devices, accelerates technology adoption. Educational boards are mandating the inclusion of e-learning tools in curriculums. This collective effort fosters a sustainable digital ecosystem for education. Growing awareness of technology’s role in improving academic standards continues to attract large-scale investments.
Increased Demand for Personalized and Remote Learning Solutions:
The demand for flexible and customized learning has surged across global education systems. Students prefer adaptive platforms that align with their pace and preferences. The Global Smart Classroom Market responds by offering hybrid and remote learning models. These systems provide seamless access to content from any location, ensuring continuity in education. Institutions are investing in LMS platforms and cloud-based content to support remote classrooms. Teachers use digital collaboration tools to maintain engagement and performance monitoring. The post-pandemic era has accelerated this transition toward virtual learning. This growing demand reinforces the market’s long-term potential in modern education systems.
Market Trends:
Growing Adoption of Cloud-Based Learning Management Systems:
Educational institutions are increasingly shifting toward cloud-based learning management platforms. These systems provide centralized storage, easy content access, and improved scalability. The Global Smart Classroom Market benefits from the flexibility offered by cloud-based tools. Cloud infrastructure reduces hardware costs while improving collaboration between teachers and students. It enables real-time updates, remote participation, and integrated grading solutions. Many institutions are adopting hybrid models combining in-person and online learning through the cloud. Cloud-based systems also support multilingual content and global access. This trend strengthens connectivity and supports sustainable, inclusive education delivery.
- For instance, Lenovo’s Chromebook Education Package allows thousands of devices to be managed and customized in seconds by school IT teams using the Chrome Education Upgrade and Google Admin Console integration, as outlined in Lenovo’s official product brochure for 2023.
Advancement of Augmented Reality (AR) and Virtual Reality (VR) Tools:
AR and VR technologies are redefining the learning experience through immersive engagement. The Global Smart Classroom Market witnesses a surge in AR-enabled labs, 3D simulations, and virtual field trips. These tools help students understand complex subjects with interactive visualization. Universities use VR environments for practical training in medicine, engineering, and sciences. AR overlays enhance theoretical learning with real-world examples. The adoption of mixed reality applications improves comprehension and retention among students. Institutions view these technologies as valuable teaching aids to replace passive learning. This trend is transforming classrooms into dynamic and interactive spaces for knowledge exchange.
- For instance, the Kentucky Department of Education deployed approximately 2,450 Meta Quest 2 VR headsets in 2024 across regional K-12 schools, marking the largest single school district-led VR deployment in the U.S.; meanwhile, Avantis Education’s ClassVR solution has reached over 1 million students in around 100,000 classrooms globally, delivering more than 400 standards-aligned AR/VR lessons during the 2023–24 school year.
Rising Preference for Mobile and BYOD Learning Models:
Mobile learning and Bring Your Own Device (BYOD) initiatives are gaining traction in schools and colleges. Students prefer using smartphones, tablets, and laptops for seamless study access. The Global Smart Classroom Market benefits from reduced infrastructure costs and improved engagement through personal devices. BYOD policies allow students to participate actively using familiar technology. Institutions adopt mobile-compatible software for real-time learning and collaboration. This approach fosters flexibility and inclusivity in modern classrooms. The proliferation of 5G networks enhances connectivity and performance. Growing mobile adoption strengthens digital participation and drives innovation in classroom delivery.
Emergence of Sustainable and Energy-Efficient Smart Solutions:
Educational institutions are prioritizing sustainability while integrating advanced classroom technologies. The Global Smart Classroom Market is embracing eco-friendly solutions such as LED displays and energy-efficient projectors. Schools aim to reduce carbon footprints through digital rather than paper-based materials. Cloud computing minimizes physical infrastructure needs and promotes resource optimization. Smart sensors and automation control energy use in learning environments. Manufacturers are designing recyclable and energy-saving devices for classrooms. This movement aligns with global sustainability goals and institutional responsibility. The focus on green technology adoption continues to define the market’s growth direction.
Market Challenges Analysis:
High Implementation Costs and Infrastructure Gaps:
The adoption of smart technologies requires significant investment in hardware, software, and training. Many developing regions face financial barriers that slow modernization in schools. The Global Smart Classroom Market is restrained by high installation and maintenance costs. Limited access to stable internet and electricity affects system performance in rural areas. Institutions also face difficulties in integrating legacy systems with advanced digital solutions. Small-scale schools struggle to justify the high return on investment in the short term. Teacher training gaps further hinder the effective use of smart tools. These issues create uneven adoption across different economic regions.
Cybersecurity Risks and Data Privacy Concerns:
Increased digitization introduces vulnerabilities to sensitive student and institutional data. The Global Smart Classroom Market faces risks of cyberattacks, data breaches, and unauthorized access. Institutions must implement strong encryption and compliance frameworks to ensure data safety. Many schools lack skilled IT staff to manage these challenges effectively. Privacy concerns over student data usage remain a key restraint. Frequent connectivity issues also raise the risk of operational disruption. Cybersecurity investments add financial pressure on educational budgets. Addressing these challenges is essential to maintain trust and sustain digital learning expansion.
Market Opportunities:
Expanding Demand for AI-Driven and Adaptive Learning Platforms:
Artificial intelligence presents vast opportunities for personalized education delivery. The Global Smart Classroom Market can leverage AI tools to create adaptive learning paths. Predictive analytics help educators monitor student behavior and customize teaching content. These systems reduce manual workload and improve accuracy in performance evaluation. Global institutions are adopting AI to enhance inclusivity and student support. The integration of real-time feedback loops strengthens learning efficiency. Growing awareness of personalized learning advantages continues to boost AI investments.
Rising Penetration of Smart Education in Emerging Economies:
Emerging economies present a strong growth opportunity due to improving digital infrastructure. The Global Smart Classroom Market benefits from government-backed education reforms and ICT programs. Expanding internet connectivity and affordable devices make technology more accessible. Public-private collaborations help equip schools with smart learning systems. Increasing awareness of digital literacy drives rapid adoption in rural and semi-urban regions. Local content development and language-based tools enhance regional adaptability. These opportunities position emerging markets as future growth engines for global expansion.
Market Segmentation Analysis:
By Component
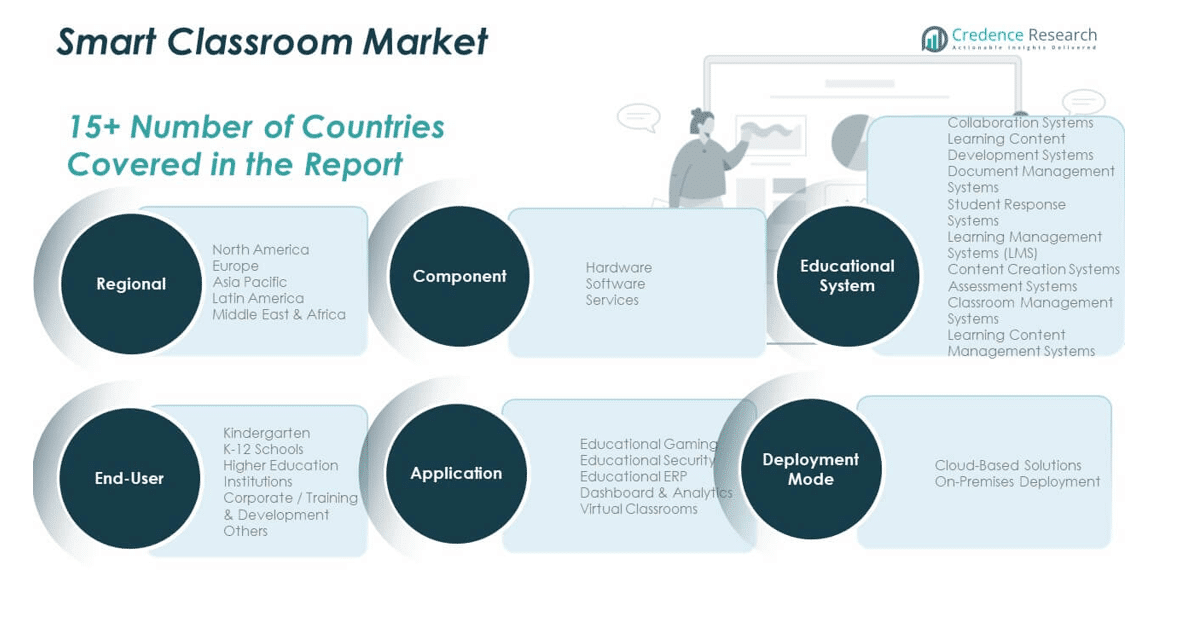
The Global Smart Classroom Market is segmented into hardware, software, and services. Hardware holds a major share due to rising deployment of interactive displays, projectors, and digital whiteboards in educational institutions. Software solutions such as learning management systems and content creation platforms enhance accessibility and data integration. Service offerings including installation, training, and maintenance support long-term efficiency. Increasing institutional demand for integrated digital systems continues to strengthen this segment structure.
- For instance, SMART Technologies introduced a new generation of interactive displays—RX, MX, and GX series—at the 2024 ISE trade show, with models like the RX series supporting 40-point multitouch and Tool Explorer® sensor integration, targeting accessibility and hybrid classroom features as highlighted by the company’s official January 2024 announcement.
By Application
Key applications include educational gaming, educational security, educational ERP, dashboard and analytics, and virtual classrooms. Virtual classrooms dominate due to rising preference for hybrid and remote learning models. Educational ERP systems streamline administration and academic management, while gaming tools foster student engagement and retention. Dashboard and analytics applications help track learning outcomes and performance. Educational security ensures safe digital environments across connected devices.
- For instance, Avantis Education’s ClassVR platform enabled more than 1 million students in 100,000 classrooms to experience immersive AR and VR educational content by 2023–24, blending gaming-like engagement with secure device management and analytics for teachers as cited in Tech & Learning’s 2023 awards update.
By Educational System
The educational system segment covers collaboration systems, content development platforms, document management, LMS, and assessment systems. Learning management systems (LMS) hold strong growth potential due to their central role in digital education delivery. Collaboration systems enable interactive participation, while assessment tools support performance evaluation. Learning content management and classroom management systems enhance resource optimization and knowledge sharing.
By End-User and Deployment Mode
End users include kindergarten, K–12 schools, higher education institutions, corporate training, and others. K–12 schools account for the largest adoption due to government-backed digital initiatives. Higher education institutions and corporate training centers are expanding usage for skill-based learning. Deployment modes include cloud-based and on-premises solutions, with cloud-based platforms gaining traction for their scalability, accessibility, and cost efficiency.
Segmentation:
By Component
- Hardware
- Software
- Services
By Application
- Educational Gaming
- Educational Security
- Educational ERP
- Dashboard & Analytics
- Virtual Classrooms
By Educational System
- Collaboration Systems
- Learning Content Development Systems
- Document Management Systems
- Student Response Systems
- Learning Management Systems (LMS)
- Content Creation Systems
- Assessment Systems
- Classroom Management Systems
- Learning Content Management Systems
By End-User
- Kindergarten
- K-12 Schools
- Higher Education Institutions
- Corporate / Training & Development
- Others
By Deployment Mode
- Cloud-Based Solutions
- On-Premises Deployment
By Region
- North America
- U.S.
- Canada
- Mexico
- Europe
- Germany
- France
- U.K.
- Italy
- Spain
- Rest of Europe
- Asia Pacific
- China
- Japan
- India
- South Korea
- South-east Asia
- Rest of Asia Pacific
- Latin America
- Brazil
- Argentina
- Rest of Latin America
- Middle East & Africa
- GCC Countries
- South Africa
- Rest of the Middle East and Africa
Regional Analysis:
North America
The North America Global Smart Classroom Market size was valued at USD 27,763.20 million in 2018 to USD 34,682.55 million in 2024 and is anticipated to reach USD 60,754.32 million by 2032, at a CAGR of 7.3% during the forecast period. North America holds a 37.9% share of the global market, driven by advanced digital infrastructure and strong institutional funding. The United States leads adoption, supported by high education budgets and strong emphasis on e-learning and cloud-based systems. Universities and schools are integrating AI, analytics, and immersive tools to improve student engagement. Canada follows with rising investments in virtual classrooms and distance learning programs. The region benefits from mature EdTech ecosystems and partnerships between technology providers and academic institutions. Continuous government support for smart education policies enhances adoption rates. Growing demand for hybrid learning models sustains the region’s leadership in the global landscape.
Europe
The Europe Global Smart Classroom Market size was valued at USD 16,122.90 million in 2018 to USD 19,440.50 million in 2024 and is anticipated to reach USD 31,851.82 million by 2032, at a CAGR of 6.4% during the forecast period. Europe accounts for a 27.4% share of the global market, supported by strong government initiatives toward digital literacy and inclusion. Countries like Germany, the UK, and France lead adoption with well-developed education networks and funding for digital transformation. The European Union promotes integration of ICT tools into national education systems. Interactive whiteboards, cloud platforms, and AI-assisted tools are widely used in classrooms. Universities are embracing hybrid and remote learning structures to reach diverse student groups. Institutions are also investing in cybersecurity and data protection to ensure safe learning environments. The region’s focus on sustainability and digital equity reinforces steady growth momentum.
Asia Pacific
The Asia Pacific Global Smart Classroom Market size was valued at USD 19,159.50 million in 2018 to USD 25,203.34 million in 2024 and is anticipated to reach USD 48,446.30 million by 2032, at a CAGR of 8.5% during the forecast period. Asia Pacific commands a 23.9% share of the global market, emerging as the fastest-growing region. Growth is driven by expanding digital infrastructure, government investments, and large student populations. China, Japan, and India lead adoption with rapid integration of cloud-based education platforms. The region is witnessing strong participation from private EdTech firms introducing affordable smart solutions. Public education systems are transitioning to hybrid models to reach remote and underserved areas. Increasing smartphone penetration supports the use of mobile-based learning tools. The rising importance of STEM education and teacher training programs further strengthens market expansion.
Latin America
The Latin America Global Smart Classroom Market size was valued at USD 5,205.60 million in 2018 to USD 6,522.72 million in 2024 and is anticipated to reach USD 10,716.49 million by 2032, at a CAGR of 6.5% during the forecast period. Latin America represents a 6.5% share of the global market, led by Brazil and Mexico. Governments are promoting digital transformation through education modernization initiatives. Schools are adopting low-cost smart devices and cloud-based learning tools to improve accessibility. Private institutions are expanding investments in learning management systems and virtual platforms. The pandemic accelerated digital adoption and remote learning expansion. Teacher training programs and local content development are enhancing implementation effectiveness. Despite infrastructure limitations in rural areas, urban centers show strong adoption rates. The region continues to attract global EdTech collaborations to boost innovation.
Middle East
The Middle East Global Smart Classroom Market size was valued at USD 2,747.40 million in 2018 to USD 3,252.09 million in 2024 and is anticipated to reach USD 5,145.18 million by 2032, at a CAGR of 5.9% during the forecast period. The region holds a 3.6% share of the global market, supported by national education reforms and smart city projects. The UAE and Saudi Arabia are investing heavily in digital classrooms and e-learning platforms. Governments are prioritizing technology-driven education aligned with Vision 2030 and similar strategies. Universities are adopting blended learning formats and AI-based performance systems. Increased internet access and youth-driven demand for modern education strengthen growth potential. Partnerships between technology firms and ministries of education are boosting infrastructure development. The focus on digitized curriculum and teacher empowerment remains central to regional expansion.
Africa
The Africa Global Smart Classroom Market size was valued at USD 1,301.40 million in 2018 to USD 2,266.28 million in 2024 and is anticipated to reach USD 3,344.48 million by 2032, at a CAGR of 4.5% during the forecast period. Africa accounts for a 2.7% share of the global market, reflecting early-stage development with growing potential. South Africa and Egypt are leading in digital learning adoption due to improved connectivity and government programs. Regional initiatives aim to expand affordable access to smart devices and online learning. Local EdTech startups are introducing mobile-based solutions suited for low-resource environments. International collaborations are supporting capacity-building and infrastructure development. Challenges such as limited funding and uneven connectivity persist in rural areas. The Global Smart Classroom Market in Africa shows strong long-term potential with gradual adoption across schools and universities.
Key Player Analysis:
- Apple Inc.
- Google LLC
- Microsoft Corporation
- Cisco Systems, Inc.
- IBM Corporation
- Dell Technologies
- Adobe Inc.
- SMART Technologies ULC
- Blackboard Inc.
- Panasonic Corporation
- Samsung Electronics
- Promethean World
- Lenovo Group Ltd.
- D2L Corporation
Competitive Analysis:
The Global Smart Classroom Market features a competitive landscape dominated by established technology giants and emerging EdTech innovators. It is characterized by intense rivalry among players focusing on hardware, software, and cloud-based learning solutions. Leading companies such as Microsoft, Google, Apple, Cisco Systems, and SMART Technologies are driving innovation through AI integration, immersive learning tools, and cross-platform compatibility. New entrants are introducing cost-efficient smart devices and localized solutions to capture untapped segments. Strategic mergers, partnerships, and product diversification remain key to gaining market presence and customer retention across global education networks.
Recent Developments:
- In June 2025, Google introduced Gemini AI as a default component of Google Workspace for Education at ISTE San Antonio, making advanced AI tools freely available to all educators and students worldwide, setting a new standard for smart classroom technology integration.
- In October 2025, Microsoft announced free access to Copilot Studio for Washington State’s school districts and community colleges starting January 2026, allowing administrators to build custom AI agents for educational support and academic planning, with expanded Teams for Education enhancements for smart classrooms.
- In August 2025, Cisco announced a new strategic partnership with the Center for Innovative Technology (CIT) to co-develop AI-driven smart classroom infrastructure solutions for future-proofing educational institutions, highlighted by enhanced AI security and collaboration tools.
- In August 2025, Dell Technologies rolled out new Latitude and Chromebook education laptops, optimized for K-12 learning spaces, and expanded its portfolio of student-centered accessories and device management solutions for smart classroom deployments in US school districts.
- In September 2025, Adobe provided free access to Adobe Express for Education to all K-12 students and teachers across the United States, and invested $100 million to expand hands-on AI creative tools for smart classroom learning, highlighted in the White House AI Education Pledge initiative.
Report Coverage:
The research report offers an in-depth analysis based on market segments, including component, application, educational system, end-user, deployment mode, and region. It details leading market players, providing an overview of their business, product offerings, investments, revenue streams, and key applications. Additionally, the report includes insights into the competitive environment, SWOT analysis, current market trends, as well as the primary drivers and constraints. Furthermore, it discusses various factors that have driven market expansion in recent years. The report also explores market dynamics, regulatory scenarios, and technological advancements that are shaping the industry. It assesses the impact of external factors and global economic changes on market growth. Lastly, it provides strategic recommendations for new entrants and established companies to navigate the complexities of the market.
Future Outlook:
- Artificial intelligence will play a central role in personalizing learning experiences.
- Cloud-based deployment will dominate due to scalability and lower maintenance costs.
- Hybrid and remote learning formats will become a standard part of education systems.
- Asia Pacific will emerge as the fastest-growing regional market.
- Hardware and software integration will improve real-time collaboration.
- Investment in cybersecurity will increase to protect educational data.
- Government-led initiatives will promote digital literacy and equitable access.
- Immersive learning using AR/VR will redefine interactive education models.
- Partnerships between EdTech firms and institutions will drive innovation.
- Sustainability and green technology adoption will gain prominence in classrooms.
Request a Free Sample
Fill in your details and we'll send you a free sample report.
- Sample data tables & charts
- Research methodology
Need a Custom Version of This Report?
Tailor the scope, geography, or segments to your exact requirements.
- Custom geography or segment scope
- Direct access to our analyst team
Frequently Asked Questions
What is the projected growth of the Smart Classroom Market?
At what Compound Annual Growth Rate is the Global Smart Classroom Market projected to grow between 2025 and 2032?
What are the main factors driving the growth of the Smart Classroom Market?
How is technology transforming smart classrooms?
Which regions are leading the Smart Classroom Market?
How is the COVID-19 pandemic affecting the Smart Classroom Market?
Table of Content
Chapter 1. Report Introduction
- 1.1 Report Description & Purpose
- 1.1.1 Report Title & Market Definition
- 1.1.2 Unique Selling Propositions (USP) & Key Differentiators
- 1.1.3 Value Proposition for Stakeholders
- 1.2 Research Objectives
- 1.2.1 Market Sizing Objectives (Volume & Revenue)
- 1.2.2 Segmentation Objectives
- 1.2.3 Competitive Intelligence Objectives
- 1.2.4 Forecast & Scenario Objectives
- 1.3 Report Scope
- 1.3.1 Smart Classroom Scope – Types & Subtypes Covered
- 1.3.2 Geographic Scope – Regions & Countries Covered
- 1.3.3 Historical Period, Base Year & Forecast Period (2024; forecast to 2032)
- 1.3.4 Inclusions & Exclusions
- 1.4 HS Code & Classification Framework
- 1.5 Currency, Units & Pricing Basis
- 1.6 Target Stakeholders
- 1.7 Limitations & Assumptions
Chapter 2. Executive Summary
- 2.1 Global Smart Classroom Market Snapshot
- 2.1.1 Market Size – Historical (2024) & Forecast (2024-2032) (2024: USD 91,367.48 million → 2032: USD 1,60,258.59 million)
- 2.1.2 Volume & Revenue – Global Totals
- 2.1.3 Key Market Highlights – Top Five Facts
- 2.2 Smart Classroom Market Segmentation Snapshot
- 2.2.1 Market Split by Region – 2024 vs. 2032
- 2.3 Competitive Snapshot
- 2.3.1 Top 10 Players by Revenue Share – 2024
- 2.3.2 Top 10 Players by Volume Share – 2024
- 2.3.3 Recent Strategic Developments (18-Month Summary)
- 2.4 Key Investment Highlights & Strategic Conclusions
Chapter 3. Smart Classroom Market Dynamics & Industry Analysis
- 3.1 Market Overview & Context
- 3.1.1 Smart Classroom Market Position in the Broader Automotive Value Chain
- 3.1.2 OEM vs. Replacement Market Dynamics
- 3.1.3 Market Maturity & Development Stage by Region
- 3.2 Smart Classroom Market Drivers
- 3.3 Smart Classroom Market Restraints & Challenges
- 3.4 Smart Classroom Market Opportunities
- 3.5 Porter's Five Forces Analysis
- 3.5.1 Threat of New Entrants
- 3.5.2 Bargaining Power of Suppliers
- 3.5.3 Bargaining Power of Buyers
- 3.5.4 Threat of Substitutes
- 3.5.5 Competitive Rivalry – Intensity Assessment
- 3.6 Smart Classroom Value Chain Analysis
- 3.6.1 Upstream – Raw Material/Input Suppliers
- 3.6.1.1 Raw Material/Input 1
- 3.6.1.2 Raw Material/Input 2
- 3.6.1.3 Raw Material/Input 3
- 3.6.2 Midstream – Production/Manufacturing/Service Delivery
- 3.6.2.1 Production/Process Overview
- 3.6.2.2 Key Facility Locations & Capacity by Manufacturer
- 3.6.3 Downstream – Distribution & End Consumer
- 3.6.3.1 Primary Channel – B2B/OEM
- 3.6.3.2 Secondary Channels – Dealer, Retail, Online, Direct
- 3.6.4 Value Chain Profitability Analysis
- 3.6.1 Upstream – Raw Material/Input Suppliers
- 3.7 PESTEL Analysis
- 3.7.1 Political Factors
- 3.7.2 Economic Factors
- 3.7.3 Social Factors
- 3.7.4 Technological Factors
- 3.7.5 Environmental Factors
- 3.7.6 Legal Factors
- 3.8 Smart Classroom Supply Chain Analysis
- 3.8.1 Raw Material/Input Supply Risk Assessment
- 3.8.2 Manufacturing Concentration Risk (Geographic Exposure)
- 3.8.3 Trade Disruption Impact Analysis
- 3.9 Regulatory & Policy Landscape
Note: The regulatory and policy landscape section covers regulations based on their applicability to the market, Smart Classroom category, geography, and scope of the study. Only regulatory frameworks with a material impact on operations, compliance, trade, sustainability, or market access are analyzed in detail.
Chapter 4. Key Investment Pockets & Opportunity Analysis
- 4.1 Smart Classroom Market Attractiveness Analysis
- 4.1.1 By Region – Investment Attractiveness Matrix (Volume × CAGR)
- 4.2 Absolute Revenue Growth Opportunity
- 4.2.1 By Region – Absolute USD Growth Through 2032
- 4.3 Incremental Volume Opportunity
- 4.3.1 By Region – Incremental Volume Through 2032
- 4.3.2 Segment – Incremental Volume
- 4.4 Emerging Submarket Opportunity Deep Dive (Subject to Applicability)
- 4.5 Emerging Market Opportunity Scorecards
- 4.5.1 United States
- 4.5.2 Europe
- 4.5.3 Asia
- 4.5.4 Middle East & Africa
Note: Emerging Market Opportunity Scorecards will be included based on relevance and strategic importance. Regions listed are indicative and may vary depending on data availability and market dynamics.
Chapter 5. Smart Classroom Import-Export Analysis & Trade Flows
- 5.1 Global Trade Overview
- 5.1.1 Global Export Value by Country (2024)
- 5.1.2 Global Export Volume by Country (2024)
- 5.1.3 Global Import Value by Country (2024)
- 5.1.4 Global Import Volume by Country (2024)
- 5.1.5 Net Trade Balance by Country (2024)
- 5.2 Export Analysis – Segment
- 5.2.1 Type 1 (HS Code)
- 5.2.2 Type 2 (HS Code)
- 5.2.3 Type 3 (HS Code)
- 5.2.4 Type 4 (HS Code)
- 5.2.5 Type 5 (HS Code)
- 5.3 Import Analysis – Segment
- 5.3.1 Type 1 (HS Code)
- 5.3.2 Type 2 (HS Code)
- 5.3.3 Type 3 (HS Code)
- 5.3.4 Type 4 (HS Code)
- 5.3.5 Type 5 (HS Code)
- 5.4 Average Unit Trade Prices
- 5.4.1 Average Export Price – Segment & Country
- 5.4.2 Average Import Price – Segment & Source Country
- 5.4.3 Price Trends (2024)
- 5.5 Key Trade Route Analysis
- 5.5.1 Trade Route 1
- 5.5.2 Trade Route 2
- 5.5.3 Trade Route 3
- 5.5.4 Trade Route 4
- 5.5.5 Trade Route 5
- 5.6 Trade Policy Impact Assessment
- 5.6.1 US Anti-Dumping & Section 301 Tariffs
- 5.6.2 EU Customs Union Impact
- 5.6.3 Major Free Trade Agreements
- 5.6.4 USMCA Rules of Origin
Note: Trade policy analysis will be included only where relevant to the Smart Classroom market.
Chapter 6. Competitive Landscape & Company Benchmarking
- 6.1 Smart Classroom Market Concentration & Structure
- 6.1.1 Herfindahl-Hirschman Index (HHI) – vs. 2024
- 6.1.2 Tier 1, Tier 2 & Tier 3 Market Structure
- 6.1.3 Global, Regional & Local Player Dynamics
- 6.2 Smart Classroom Market Share Analysis – 2024
- 6.2.1 Global Revenue Share by Company
- 6.2.2 Global Volume Share by Company
- 6.2.3 Regional Revenue Share
- 6.2.4 Market Share Evolution ( vs. 2024)
- 6.2.5 OEM Segment Share by Company
- 6.2.6 Replacement Segment Share by Company
- 6.3 Production/Delivery Capacity & Facility Analysis
- 6.3.1 Global Installed Capacity
- 6.3.2 Capacity Utilization Rates
- 6.3.3 Production/Output Volume
- 6.3.4 Facility Locations & Capacity Map
- 6.3.5 Planned Capacity Additions
- 6.4 Smart Classroom Competitive Benchmarking Matrix
- 6.4.1 Revenue, Volume, CAGR & Profitability Comparison
- 6.4.2 Channel Revenue Mix
- 6.4.3 Geographic Revenue Exposure
- 6.4.4 R&D Intensity
- 6.4.5 Sustainability Maturity
- 6.5 Strategic Developments in Smart Classroom (Last 24 Months)
- 6.5.1 Mergers, Acquisitions & Divestments
- 6.5.2 New Smart Classroom Launches
- 6.5.3 Facility Expansions
- 6.5.4 Strategic Alliances, Joint Ventures & Partnerships
- 6.5.5 Distribution Expansion & Market Entry
- 6.5.6 Sustainability & ESG Initiatives
- 6.6 Competitive Strategy Mapping
- 6.6.1 Leader, Challenger, Follower & Niche Classification
- 6.6.2 Pricing Strategy Comparison
- 6.6.3 Channel Strategy Matrix
Note: Strategic developments are included based on their materiality and the availability of reliable information.
Chapter 7. Global Smart Classroom Market – By Distribution Channel
- 7.1 Segment Overview
- 7.1.1 Volume & Revenue Split by Channel (2024 & 2032)
- 7.1.2 Channel Mix Evolution (2024-2032)
Chapter 8. Regional Market Analysis – Global Overview
- 8.1 Global Regional Overview
- 8.1.1 Regional Volume Share
- 8.1.2 Regional Revenue Share
- 8.1.3 Regional Volume by Region
- 8.1.4 Regional Revenue by Region
- 8.1.5 Regional Forecast Through 2032
- 8.2 Cross-Regional Segment Analysis
- 8.2.1 By Distribution Channel
- 8.2.2 By Brand/Price Tier
Chapter 9. North America Smart Classroom Market
- 9.1 United States
- 9.2 Canada
- 9.3 Mexico
Chapter 10. Europe Smart Classroom Market
- 10.1 Germany
- 10.2 France
- 10.3 Italy
- 10.4 United Kingdom
- 10.5 Spain
- 10.6 Poland
- 10.7 Russia
- 10.8 Netherlands
- 10.9 Belgium
- 10.10 Sweden
- 10.11 Denmark
- 10.12 Norway
- 10.13 Rest of Europe
Chapter 11. Asia Pacific Smart Classroom Market
- 11.1 China
- 11.2 India
- 11.3 Japan
- 11.4 South Korea
- 11.5 Thailand
- 11.6 Indonesia
- 11.7 Vietnam
- 11.8 Malaysia
- 11.9 Australia
- 11.10 Rest of Asia Pacific
Chapter 12. Latin America Smart Classroom Market
- 12.1 Brazil
- 12.2 Argentina
- 12.3 Colombia
- 12.4 Chile
- 12.5 Rest of Latin America
Chapter 13. Middle East Smart Classroom Market
- 13.1 Saudi Arabia
- 13.2 United Arab Emirates
- 13.3 Turkey
- 13.4 Israel
- 13.5 Iran
- 13.6 Rest of the Middle East
Chapter 14. Africa Smart Classroom Market
- 14.1 South Africa
- 14.2 Egypt
- 14.3 Nigeria
- 14.4 Morocco
- 14.5 Rest of Africa
Chapter 15. Smart Classroom Company Profiles
- 15.1 [Company 01]
- 15.1.1 Company Overview
- 15.1.2 Key Management Personnel
- 15.1.3 Products & Services Portfolio
- 15.1.4 Financial Performance
- 15.1.5 Key Market Focus & Geographic Presence
- 15.1.6 Recent Developments & Strategic Initiatives
Note: The company profile list is preliminary and may change based on research findings, market developments, data availability, and client requirements.
Chapter 16. Appendices
- Appendix A – List of Abbreviations & Acronyms
- Appendix B – Industry Classification Code Reference – Full Series
- Appendix C – Production & Capacity Data Tables
- Appendix D – End-Use & Demand Base Tables
- Appendix E – Consumption & Replacement Rate Assumptions
- Appendix F – ASP Reference Tables
- Appendix G – Manufacturing & Facility Database
- Appendix H – Import-Export Data Tables
- Appendix I – Regulatory Summary Tables
- Appendix J – Primary Research Participant List (Anonymized)
- Appendix K – Primary Research Questionnaire Framework
- Appendix L – Data Sources & Bibliography
- Appendix M – Market Size Divergence & Source Comparison
Chapter 17. Research Methodology
- 17.1 Research Framework & Philosophy
- 17.2 Secondary Research – Sources, Hierarchy & Data Extraction
- 17.3 Data Modeling – Bottom-Up & Top-Down Market Sizing
- 17.4 Primary Research – Stakeholder Framework, LOI & Sample Sizes
- 17.5 Forecast Methodology – Regression, Scenario & Sensitivity Analysis
- 17.6 Quality Control – Four-Layer Validation Framework
- 17.7 Limitations & Standard Assumptions
- 17.8 Disclaimer
