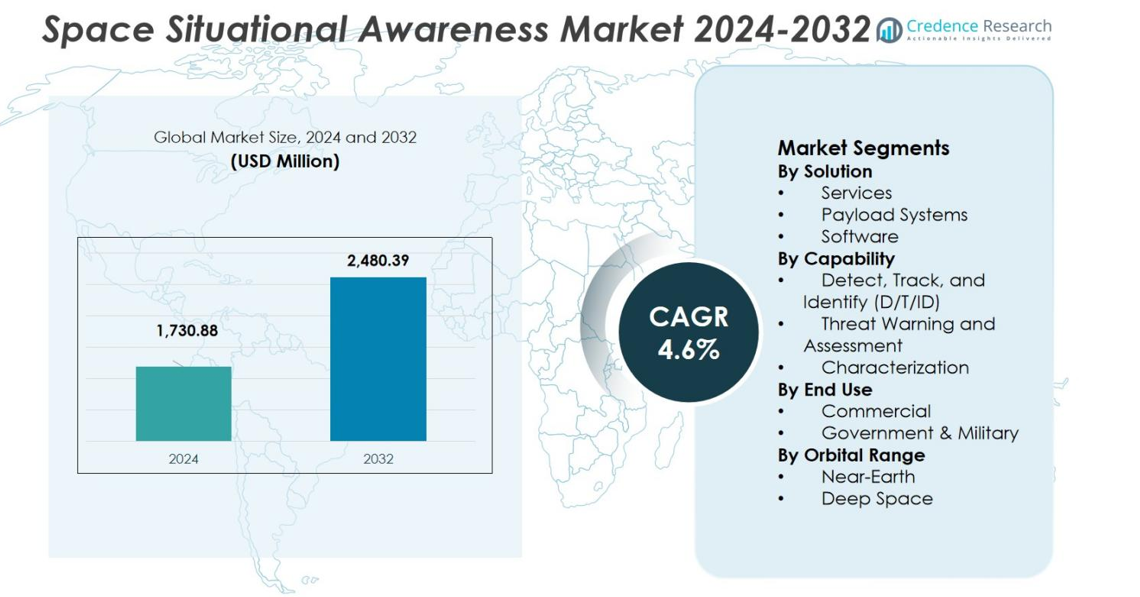
Home » Information and Communications Technology » Technology & Media » Space Situational Awareness Market

Space Situational Awareness Market By Solution (Services, Payload Systems, Software) By Capability (Detect, Track and identify (D/T/ID), Threat warning and assessment, Characterization) – Growth, Future Prospects & Competitive Analysis, 2016 – 2028

Price: $4999

Published: | Report ID: 9462 | Report Format : PDF

About this report

Key Highlights of the report

How are the major segments performing in the Space Situational Awareness market?

  • According to estimates, the space situational awareness market’s services sector will command the most market share in 2021.
  • The market for space situational awareness is anticipated to expand at the greatest CAGR over the forecast period for the commercial sector.

Which region dominated the space situational awareness market?

In 2021, North America accounted for the greatest portion of the market for space situational awareness. Due to the increasing reliance on space assets and the need to maintain safe space operations, there is a significant demand for space situational awareness happenings from illustrious organizations like NASA and the Department of Defense. In 2021, significant market shares for space situational awareness were held by Europe and Asia-Pacific. The other key regions in the Rest of the World (RoW) region that are anticipated to offer significant growth possibilities throughout the projection period are the Middle East, South America, and Africa.

Design Element 2

Access crucial information at unmatched prices!

Request your free sample report today & start making informed decisions powered by Credence Research!

Download Free Sample
CTA Design Element 3

How is US Market performing in the space situational awareness market?

Intelligence agencies in North America, particularly those in the US, concentrate on providing situational awareness for space operations in terms of current and forecast knowledge, as well as the characterization of space objects and the operational environment they depend on. The US has the largest global network for space surveillance. Additionally, the US Department of Defense invests money in SSA. Additionally, the presence of major space institutions like NASA and the US DoD would promote market expansion in the area.

REPORT ATTRIBUTE DETAILS
Market by Value Yes
Market, Tornado Analysis Yes
Market, STAR Analysis Yes
Market, SRC Analysis Yes
Market, Import-Export Data Yes (On Demand)
Market Pricing Analysis Yes (On Demand)
Market Segment Analysis By Solution (Services, Payload Systems, Software)

By Capability (Detect, Track, and identify (D/T/ID), Threat warning and assessment, and characterization)

By Object (Mission-related debris, Rocket bodies, Fragmentation debris, Functional spacecraft, Non-functional spacecraft, and Others)

By End Use (Commercial and Government & Military)

Market, Regional Analysis North America (US and Canada)

Europe (Germany, UK, France, Italy, Spain, and the Rest of Europe)

Asia Pacific (China, India, Japan, South Korea, South East Asia, and the Rest of Asia Pacific)

Latin America (Brazil, Mexico, and the Rest of Latin America)

Middle East and Africa (GCC Countries, South Africa, and the Rest of the Middle East and Africa)

Market Key Companies Lockheed Martin Corporation, L3Harris Technologies Inc., Vision Engineering Solutions LLC, Analytical Graphics Inc, Kratos Defense & Security Solutions Inc, ExoAnalytic Solutions, SpaceNav, NorthStar Earth & Space Inc, GlobVision Inc, Etamax Space GmbH
Market Competitive Landscape Market Share Analysis

Competitive Benchmarking

Key Players Market Positioning

Geographical Presence Analysis

Major Strategies Adopted

What is the competitive environment of the space situational awareness market?

A small number of well-known companies from around the world dominate the space situational awareness market. These companies include L3Harris Technologies (US), Lockheed Martin Corporation (US), Kratos Defense & Security Solutions, Inc. (US), Parsons Corporation (US), and Peraton (US), among others. Due to the shifting needs of governmental, military, and commercial space users worldwide, much attention was paid to contracts and new product development.

Executive Summary

What is the market scenario of the Space Situational Awareness Market?

The idea of observing and comprehending the atmosphere of the planet and the layers of space is the focus of the space situational awareness sector. We accomplish this by deepening our comprehension of the body of currently held knowledge using exploring tools. On the other hand, modern technologies and apparatus for investigation and observation allow the Space Situational Awareness Market to increase its capabilities. The market focuses on understanding space conditions, changes, celestial events, and other extra-terrestrial occurrences. To clearly understand the hazards and dangers currently existing in space, such as asteroids and unnatural changes, the market also deals with monitoring space. The market also increases our understanding of unintentional or intentional interference with satellites and space networks.

Which are the key investments by the space situational awareness market players?

To give commanders immediate access to situational awareness data connected to space, Kratos Defense and Security Solutions has obtained USD 2.8 million in Department of Defense funding for a prototype development effort. It will work on virtualized infrastructure software and hardware to deliver data to the cloud-based UDL for presentation and analysis, prototyping a system for the US Air Force and Space Force’s Unified Data Library. The European Space Agency granted a service contract to Telespazio UK, a Telespazio subsidiary, in August 2021 to manage the science operations centers for ESA’s astronomy, heliophysics, and basic physics missions at the European Space Astronomy Centre (ESAC).

Some major space situational awareness market players are Lockheed Martin Corporation, L3Harris Technologies Inc., Vision Engineering Solutions LLC, Analytical Graphics Inc, Kratos Defense & Security Solutions Inc, ExoAnalytic Solutions, SpaceNav, NorthStar Earth & Space Inc, GlobVision Inc, Etamax Space GmbH.

Space Situational Awareness Market


What are the Major Driving Factors for the Space Situational Awareness Market?

In the coming years, the market value for space situational awareness will rise due to several market growth factors. The growing demand for space-based sensing operations is the industry’s main motivator. The growth of the space situational awareness market value has been greatly influenced by activities like RF mapping, weather monitoring, and remote sensing in the maritime, space observation, and aeronautics sectors. Other industry drivers are low operating costs for tiny satellite operations and the simplicity of launching these space observation instruments. The market size for space situational awareness will undoubtedly benefit from using these gadgets in both public and private endeavors.

What are the Major Risks for the Space Situational Awareness Market?

Satellites that were once launched into orbit but are no longer in use are the sources of the orbital junk already in low orbits and outer space. Due to the damage and disruption this floating debris causes to operational satellites that may contact it; it poses a threat to current and future space missions. This is a genuine difficulty that space research groups must overcome, given the rise in satellite launches and the resulting increase in space debris. The Global Space Surveillance Network has tracked close to 27,000 particles of space junk so far.

Which is the key solution in the space situational awareness market?

According to estimates, the space situational awareness market’s services sector will command the most market share in 2021. The US Space Force is creating several domain awareness services to improve its visibility in space. According to the National Defense Industrial Association, a deep space advanced radar concept program, also known as DARC, is being pursued by the US Space Force Service as of July 2021. According to the military, the platform is a ground-based radar system created to continuously identify, monitor, and keep deep space objects under custody. It will mainly track things that are in geosynchronous orbit. DARC will add a new sensor with more capacity and capabilities to monitor deep space objects and provide comprehensive worldwide coverage, enhancing the military’s space surveillance network.

How is the space situational awareness market performing in regions?

North America is anticipated to dominate the market for space situational awareness. Intelligence agencies in North America, particularly those in the US, concentrate on providing situational awareness for space operations in terms of current and forecast knowledge, as well as the characterization of space objects and the operational environment they depend on. By highlighting risks to the security of their operations, this data assists the government in gathering crucial information needed to plan, manage, and secure space assets and efficiently conduct military operations. There would be a considerable need for space situational awareness systems due to the large amount of orbital space debris, which can increase the likelihood of collisions. Due to the growing reliance on assets in space, demand from well-known organizations like NASA and the Department of Defense also contributes to the market expansion in the area.

During the forecast period, a higher CAGR is anticipated for Asia-Pacific. The rising demand for SSA skills from developing nations like China, India, and Japan explains the expansion. China is expanding its optical sensor network through collaboration with its space network, known as the Asia-Pacific Optical Satellite Observation System (APOSOS).

What is the regulatory landscape for the space situational awareness market?

In the upcoming few years, the developers of Space Situational Awareness will face numerous regulatory obstacles. The rules governing the market for space situational awareness will also be impacted by the deployment of a sizable number of satellites by private enterprises to improve internet and global connectivity. The current ITU regulations prohibiting small, low-orbit satellites will be a barrier to future Space Situational Awareness efforts. As a result, modifications to the orbiting and launch regulations for Space Situational Awareness satellites are necessary going forward.

What is the Market Size of Space Situational Awareness regarding value?

The global space situational awareness market is anticipated to grow at a substantial CAGR of 4.4% in the upcoming years. The global space situational awareness industry was estimated to be worth USD 1,359.6 million in 2021 and was expected to be worth USD 1,760.4 million by 2028.

Shape Your Report to Specific Countries or Regions & Enjoy 30% Off!

What are the major players planning for the future of the space situational awareness market?

The stakeholders engage in new device invention, research and development projects, and other activities to produce better infrastructure and devices. On the other hand, corporations are also engaging in mergers and acquisitions to increase their size and operational scope.

Segmentation of Global Space Situational Awareness Market-

Global Space Situational Awareness Market – By Solution

  • Services
  • Payload Systems
  • Software

Global Space Situational Awareness Market – By Capability

  • Detect, Track, and identify (D/T/ID)
  • Threat warning and assessment
  • Characterization

Global Space Situational Awareness Market – By Object

  • Mission-related debris
  • Rocket bodies
  • Fragmentation debris
  • Functional spacecraft
  • Non-functional spacecraft
  • Others

Global Space Situational Awareness Market – By End Use

  • Commercial
  • Government & Military

Global Space Situational Awareness Market – By Region

  • North America
    • US
    • Canada
  • Europe
    • Germany
    • France
    • UK.
    • Italy
    • Spain
    • Rest of Europe
  • Asia Pacific
    • China
    • Japan
    • India
    • South Korea
    • South-east Asia
    • Rest of Asia Pacific
  • Latin America
    • Brazil
    • Mexico
    • Rest of Latin America
  • Middle East & Africa
    • GCC Countries
    • South Africa
    • Rest of Middle East and Africa

1. Preface
1.1. Report Description
1.1.1. Purpose of the Report
1.1.2. Target Audience
1.1.3. USP and Key Offerings
1.2. Research Scope
1.3. Research Methodology
1.3.1. Phase I – Secondary Research
1.3.2. Phase II – Primary Research
1.3.3. Phase III – Expert Panel Review
1.3.4. Approach Adopted
1.3.4.1. Top-Down Approach
1.3.4.2. Bottom-Up Approach
1.3.5. Assumptions
1.4. Market Segmentation

2. Executive Summary
2.1. Market Snapshot: Global Space Situational Awareness Market
2.2. Global Space Situational Awareness Market, By Solution
2.3. Global Space Situational Awareness Market, By Capability
2.4. Global Space Situational Awareness Market, By Object
2.5. Global Space Situational Awareness Market, By End Use
2.6. Global Space Situational Awareness Market, By Region

3. Market Dynamics & Factors Analysis
3.1. Introduction
3.1.1. Global Space Situational Awareness Market Value, 2016-2028, (US$ Bn)
3.2. Market Dynamics
3.2.1. Key Growth Trends
3.2.2. Market Drivers
3.2.3. Market Restraints
3.2.4. Market Opportunities
3.2.5. Major Industry Challenges
3.3. Attractive Investment Proposition,2021
3.3.1. Solution
3.3.2. Capability
3.3.3. Object
3.3.4. End Use
3.3.5. Geography

4. Premium Insights
4.1. STAR (Situation, Task, Action, Results) Analysis
4.2. Porter’s Five Forces Analysis
4.2.1. Threat of New Entrants
4.2.2. Bargaining Power of Buyers/Consumers
4.2.3. Bargaining Power of Suppliers
4.2.4. Threat of Substitute Solutions
4.2.5. Intensity of Competitive Rivalry
4.3. Value Chain Analysis
4.4. Technology Analysis
4.5. Marketing Strategy Analysis
4.5.1. Direct Marketing
4.5.2. Indirect Marketing
4.5.3. Marketing Channel Development Trend

5. Market Positioning of Key Players, 2021
5.1. Company market share of key players, 2021
5.2. Competitive Benchmarking
5.3. Market Positioning of Key Vendors
5.4. Geographical Presence Analysis
5.5. Major Strategies Adopted by Key Players
5.5.1. Key Strategies Analysis
5.5.2. Mergers and Acquisitions
5.5.3. Partnerships
5.5.4. Product Launch
5.5.5. Geographical Expansion
5.5.6. Others

6. COVID 19 Impact Analysis
6.1. Global Space Situational Awareness Market Pre Vs Post COVID 19, 2019 – 2028
6.2. Impact on Import & Export
6.3. Impact on Demand & Supply

7. Global Space Situational Awareness Market
7.1. Global Space Situational Awareness Market, By Solution, 2016-2028(US$ Bn)
7.1.1. Overview
7.1.2. Global Space Situational Awareness Market, By Solution, 2021 vs 2028 (in%)
7.1.3. Global Space Situational Awareness Market, By Services, 2016-2028 (US$ Bn)
7.1.4. Global Space Situational Awareness Market, By Payload Systems, 2016-2028 (US$ Bn)
7.1.5. Global Space Situational Awareness Market, By Software, 2016-2028 (US$ Bn)
7.2. Global Space Situational Awareness Market, By Capability, 2016-2028(US$ Bn)
7.2.1. Overview
7.2.2. Global Space Situational Awareness Market, By Capability, 2021 vs 2028 (in%)
7.2.3. Global Space Situational Awareness Market, By Detect, Track, and identify (D/T/ID), 2016-2028 (US$ Bn)
7.2.4. Global Space Situational Awareness Market, By Threat warning and assessment, 2016-2028 (US$ Bn)
7.2.5. Global Space Situational Awareness Market, By Characterization, 2016-2028 (US$ Bn)
7.3. Global Space Situational Awareness Market, By Object, 2016-2028(US$ Bn)
7.3.1. Overview
7.3.2. Global Space Situational Awareness Market, By Object, 2021 vs 2028 (in%)
7.3.3. Global Space Situational Awareness Market, By Mission-related debris, 2016-2028 (US$ Bn)
7.3.4. Global Space Situational Awareness Market, By Rocket bodies, 2016-2028 (US$ Bn)
7.3.5. Global Space Situational Awareness Market, By Fragmentation debris, 2016-2028 (US$ Bn)
7.3.6. Global Space Situational Awareness Market, By Functional spacecraft, 2016-2028 (US$ Bn)
7.3.7. Global Space Situational Awareness Market, By Non-functional spacecraft, 2016-2028 (US$ Bn)
7.3.8. Global Space Situational Awareness Market, By Others, 2016-2028 (US$ Bn)
7.4. Global Space Situational Awareness Market, By End Use, 2016-2028(US$ Bn)
7.4.1. Overview
7.4.2. Global Space Situational Awareness Market, By End Use, 2021 vs 2028 (in%)
7.4.3. Global Space Situational Awareness Market, By Commercial, 2016-2028 (US$ Bn)
7.4.4. Global Space Situational Awareness Market, By Government & Military, 2016-2028 (US$ Bn)

8. North America Space Situational Awareness Market Analysis
8.1. North America Space Situational Awareness Market, By Solution, 2016-2028(US$ Bn)
8.1.1. Overview
8.1.2. SRC Analysis
8.2. North America Space Situational Awareness Market, By Capability, 2016-2028(US$ Bn)
8.2.1. Overview
8.2.2. SRC Analysis
8.3. North America Space Situational Awareness Market, By Object, 2016-2028(US$ Bn)
8.3.1. Overview
8.3.2. SRC Analysis
8.4. North America Space Situational Awareness Market, By End Use, 2016-2028(US$ Bn)
8.4.1. Overview
8.4.2. SRC Analysis
8.5. North America Space Situational Awareness Market, by Country, 2016-2028 (US$ Bn)
8.5.1. U.S.
8.5.1.1. U.S. Space Situational Awareness Market Estimates and Forecast, 2016-2028 (US$ Bn)
8.5.1.2. U.S. Space Situational Awareness, By Solution, 2016-2028 (US$ Bn)
8.5.1.3. U.S. Space Situational Awareness, By Capability, 2016-2028 (US$ Bn)
8.5.1.4. U.S. Space Situational Awareness, By Object, 2016-2028 (US$ Bn)
8.5.1.5. U.S. Space Situational Awareness, By End Use, 2016-2028 (US$ Bn)
8.5.2. Canada
8.5.2.1. Canada Space Situational Awareness Market Estimates and Forecast, 2016-2028 (US$ Bn)
8.5.2.2. Canada Space Situational Awareness, By Solution, 2016-2028 (US$ Bn)
8.5.2.3. Canada Space Situational Awareness, By Capability, 2016-2028 (US$ Bn)
8.5.2.4. Canada Space Situational Awareness, By Object, 2016-2028 (US$ Bn)
8.5.2.5. Canada Space Situational Awareness, By End Use, 2016-2028 (US$ Bn)

9. Europe Space Situational Awareness Market Analysis
9.1. Europe Space Situational Awareness Market, By Solution, 2016-2028(US$ Bn)
9.1.1. Overview
9.1.2. SRC Analysis
9.2. Europe Space Situational Awareness Market, By Capability, 2016-2028(US$ Bn)
9.2.1. Overview
9.2.2. SRC Analysis
9.3. Europe Space Situational Awareness Market, By Object, 2016-2028(US$ Bn)
9.3.1. Overview
9.3.2. SRC Analysis
9.4. Europe Space Situational Awareness Market, By End Use, 2016-2028(US$ Bn)
9.4.1. Overview
9.4.2. SRC Analysis
9.5. Europe Space Situational Awareness Market, by Country, 2016-2028 (US$ Bn)
9.5.1. Germany
9.5.1.1. Germany Space Situational Awareness Market Estimates and Forecast, 2016-2028 (US$ Bn)
9.5.1.2. Germany Space Situational Awareness, By Solution, 2016-2028 (US$ Bn)
9.5.1.3. Germany Space Situational Awareness, By Capability, 2016-2028 (US$ Bn)
9.5.1.4. Germany Space Situational Awareness, By Object, 2016-2028 (US$ Bn)
9.5.1.5. Germany Space Situational Awareness, By End Use, 2016-2028 (US$ Bn)
9.5.2. France
9.5.2.1. France Space Situational Awareness Market Estimates and Forecast, 2016-2028 (US$ Bn)
9.5.2.2. France Space Situational Awareness, By Solution, 2016-2028 (US$ Bn)
9.5.2.3. France Space Situational Awareness, By Capability, 2016-2028 (US$ Bn)
9.5.2.4. France Space Situational Awareness, By Object, 2016-2028 (US$ Bn)
9.5.2.5. France Space Situational Awareness, By End Use, 2016-2028 (US$ Bn)
9.5.3. UK
9.5.3.1. UK Space Situational Awareness Market Estimates and Forecast, 2016-2028 (US$ Bn)
9.5.3.2. UK Space Situational Awareness, By Solution, 2016-2028 (US$ Bn)
9.5.3.3. UK Space Situational Awareness, By Capability, 2016-2028 (US$ Bn)
9.5.3.4. UK Space Situational Awareness, By Object, 2016-2028 (US$ Bn)
9.5.3.5. UK Space Situational Awareness, By End Use, 2016-2028 (US$ Bn)
9.5.4. Italy
9.5.4.1. Italy Space Situational Awareness Market Estimates and Forecast, 2016-2028 (US$ Bn)
9.5.4.2. Italy Space Situational Awareness, By Solution, 2016-2028 (US$ Bn)
9.5.4.3. Italy Space Situational Awareness, By Capability, 2016-2028 (US$ Bn)
9.5.4.4. Italy Space Situational Awareness, By Object, 2016-2028 (US$ Bn)
9.5.4.5. Italy Space Situational Awareness, By End Use, 2016-2028 (US$ Bn)
9.5.5. Spain
9.5.5.1. Spain Space Situational Awareness Market Estimates and Forecast, 2016-2028 (US$ Bn)
9.5.5.2. Spain Space Situational Awareness, By Solution, 2016-2028 (US$ Bn)
9.5.5.3. Spain Space Situational Awareness, By Capability, 2016-2028 (US$ Bn)
9.5.5.4. Spain Space Situational Awareness, By Object, 2016-2028 (US$ Bn)
9.5.5.5. Spain Space Situational Awareness, By End Use, 2016-2028 (US$ Bn)
9.5.6. Rest of Europe
9.5.6.1. Rest of Europe Space Situational Awareness Market Estimates and Forecast, 2016-2028 (US$ Bn)
9.5.6.2. Rest of Europe Space Situational Awareness, By Solution, 2016-2028 (US$ Bn)
9.5.6.3. Rest of Europe Space Situational Awareness, By Capability, 2016-2028 (US$ Bn)
9.5.6.4. Rest of Europe Space Situational Awareness, By Object, 2016-2028 (US$ Bn)
9.5.6.5. Rest of Europe Space Situational Awareness, By End Use, 2016-2028 (US$ Bn)

10. Asia Pacific Space Situational Awareness Market Analysis
10.1. Asia Pacific Space Situational Awareness Market, By Solution, 2016-2028(US$ Bn)
10.1.1. Overview
10.1.2. SRC Analysis
10.2. Asia Pacific Space Situational Awareness Market, By Capability, 2016-2028(US$ Bn)
10.2.1. Overview
10.2.2. SRC Analysis
10.3. Asia Pacific Space Situational Awareness Market, By Object, 2016-2028(US$ Bn)
10.3.1. Overview
10.3.2. SRC Analysis
10.4. Asia Pacific Space Situational Awareness Market, by End Use, 2016-2028(US$ Bn)
10.4.1. Overview
10.4.2. SRC Analysis
10.5. Asia Pacific Space Situational Awareness Market, by Country, 2016-2028 (US$ Bn)
10.5.1. China
10.5.1.1. China Space Situational Awareness Market Estimates and Forecast, 2016-2028 (US$ Bn)
10.5.1.2. China Space Situational Awareness, By Solution, 2016-2028 (US$ Bn)
10.5.1.3. China Space Situational Awareness, By Capability, 2016-2028 (US$ Bn)
10.5.1.4. China Space Situational Awareness, By Object, 2016-2028 (US$ Bn)
10.5.1.5. China Space Situational Awareness, By End Use, 2016-2028 (US$ Bn)
10.5.2. Japan
10.5.2.1. Japan Space Situational Awareness Market Estimates and Forecast, 2016-2028 (US$ Bn)
10.5.2.2. Japan Space Situational Awareness, By Solution, 2016-2028 (US$ Bn)
10.5.2.3. Japan Space Situational Awareness, By Capability, 2016-2028 (US$ Bn)
10.5.2.4. Japan Space Situational Awareness, By Object, 2016-2028 (US$ Bn)
10.5.2.5. Japan Space Situational Awareness, By End Use, 2016-2028 (US$ Bn)
10.5.3. India
10.5.3.1. India Space Situational Awareness Market Estimates and Forecast, 2016-2028 (US$ Bn)
10.5.3.2. India Space Situational Awareness, By Solution, 2016-2028 (US$ Bn)
10.5.3.3. India Space Situational Awareness, By Capability, 2016-2028 (US$ Bn)
10.5.3.4. India Space Situational Awareness, By Object, 2016-2028 (US$ Bn)
10.5.3.5. India Space Situational Awareness, By End Use, 2016-2028 (US$ Bn)
10.5.4. South Korea
10.5.4.1. South Korea Space Situational Awareness Market Estimates and Forecast, 2016-2028 (US$ Bn)
10.5.4.2. South Korea Space Situational Awareness, By Solution, 2016-2028 (US$ Bn)
10.5.4.3. South Korea Space Situational Awareness, By Capability, 2016-2028 (US$ Bn)
10.5.4.4. South Korea Space Situational Awareness, By Object, 2016-2028 (US$ Bn)
10.5.4.5. South Korea Space Situational Awareness, By End Use, 2016-2028 (US$ Bn)
10.5.5. South-East Asia
10.5.5.1. South-East Asia Space Situational Awareness Market Estimates and Forecast, 2016-2028 (US$ Bn)
10.5.5.2. South-East Asia Space Situational Awareness, By Solution, 2016-2028 (US$ Bn)
10.5.5.3. South-East Asia Space Situational Awareness, By Capability, 2016-2028 (US$ Bn)
10.5.5.4. South-East Asia Space Situational Awareness, By Object, 2016-2028 (US$ Bn)
10.5.5.5. South-East Asia Space Situational Awareness, By End Use, 2016-2028 (US$ Bn)
10.5.6. Rest of Asia Pacific
10.5.6.1. Rest of Asia Pacific Space Situational Awareness Market Estimates and Forecast, 2016-2028 (US$ Bn)
10.5.6.2. Rest of Asia Pacific Space Situational Awareness, By Solution, 2016-2028 (US$ Bn)
10.5.6.3. Rest of Asia Pacific Space Situational Awareness, By Capability, 2016-2028 (US$ Bn)
10.5.6.4. Rest of Asia Pacific Space Situational Awareness, By Object, 2016-2028 (US$ Bn)
10.5.6.5. Rest of Asia Pacific Space Situational Awareness, By End Use, 2016-2028 (US$ Bn)

11. Latin America Space Situational Awareness Market Analysis
11.1. Latin America Space Situational Awareness Market, By Solution, 2016-2028(US$ Bn)
11.1.1. Overview
11.1.2. SRC Analysis
11.2. Latin America Space Situational Awareness Market, By Capability, 2016-2028(US$ Bn)
11.2.1. Overview
11.2.2. SRC Analysis
11.3. Latin America Space Situational Awareness Market, By Object, 2016-2028(US$ Bn)
11.3.1. Overview
11.3.2. SRC Analysis
11.4. Latin America Space Situational Awareness Market, By End Use, 2016-2028(US$ Bn)
11.4.1. Overview
11.4.2. SRC Analysis
11.5. Latin America Space Situational Awareness Market, by Country, 2016-2028 (US$ Bn)
11.5.1. Brazil
11.5.1.1. Brazil Space Situational Awareness Market Estimates and Forecast, 2016-2028 (US$ Bn)
11.5.1.2. Brazil Space Situational Awareness, By Solution, 2016-2028 (US$ Bn)
11.5.1.3. Brazil Space Situational Awareness, By Capability, 2016-2028 (US$ Bn)
11.5.1.4. Brazil Space Situational Awareness, By Object, 2016-2028 (US$ Bn)
11.5.1.5. Brazil Space Situational Awareness, By End Use, 2016-2028 (US$ Bn)
11.5.2. Mexico
11.5.2.1. Mexico Space Situational Awareness Market Estimates and Forecast, 2016-2028 (US$ Bn)
11.5.2.2. Mexico Space Situational Awareness, By Solution, 2016-2028 (US$ Bn)
11.5.2.3. Mexico Space Situational Awareness, By Capability, 2016-2028 (US$ Bn)
11.5.2.4. Mexico Space Situational Awareness, By Object, 2016-2028 (US$ Bn)
11.5.2.5. Mexico Space Situational Awareness, By End Use, 2016-2028 (US$ Bn)
11.5.3. Rest of Latin America
11.5.3.1. Rest of Latin America Space Situational Awareness Market Estimates and Forecast, 2016-2028 (US$ Bn)
11.5.3.2. Rest of Latin America Space Situational Awareness, By Solution, 2016-2028 (US$ Bn)
11.5.3.3. Rest of Latin America Space Situational Awareness, By Capability, 2016-2028 (US$ Bn)
11.5.3.4. Rest of Latin America Space Situational Awareness, By Object, 2016-2028 (US$ Bn)
11.5.3.5. Rest of Latin America Space Situational Awareness, By End Use, 2016-2028 (US$ Bn)

12. Middle East and Africa Space Situational Awareness Market Analysis
12.1. Middle East and Africa Space Situational Awareness Market, By Solution, 2016-2028(US$ Bn)
12.1.1. Overview
12.1.2. SRC Analysis
12.2. Middle East and Africa Space Situational Awareness Market, By Capability, 2016-2028(US$ Bn)
12.2.1. Overview
12.2.2. SRC Analysis
12.3. Middle East and Africa Space Situational Awareness Market, By Object, 2016-2028(US$ Bn)
12.3.1. Overview
12.3.2. SRC Analysis
12.4. Middle East and Africa Space Situational Awareness Market, By End Use, 2016-2028(US$ Bn)
12.4.1. Overview
12.4.2. SRC Analysis
12.5. Middle East and Africa Space Situational Awareness Market, by Country, 2016-2028 (US$ Bn)
12.5.1. GCC Countries
12.5.1.1. GCC Countries il Space Situational Awareness Market Estimates and Forecast, 2016-2028 (US$ Bn)
12.5.1.2. GCC Countries Space Situational Awareness, By Solution, 2016-2028 (US$ Bn)
12.5.1.3. GCC Countries Space Situational Awareness, By Capability, 2016-2028 (US$ Bn)
12.5.1.4. GCC Countries Space Situational Awareness, By Object, 2016-2028 (US$ Bn)
12.5.1.5. GCC Countries Space Situational Awareness, By End Use, 2016-2028 (US$ Bn)
12.5.2. South Africa
12.5.2.1. South Africa Space Situational Awareness Market Estimates and Forecast, 2016-2028 (US$ Bn)
12.5.2.2. South Africa Space Situational Awareness, By Solution, 2016-2028 (US$ Bn)
12.5.2.3. South Africa Space Situational Awareness, By Capability, 2016-2028 (US$ Bn)
12.5.2.4. South Africa Space Situational Awareness, By Object, 2016-2028 (US$ Bn)
12.5.2.5. South Africa Space Situational Awareness, By End Use, 2016-2028 (US$ Bn)
12.5.3. Rest of Middle East and Africa
12.5.3.1. Rest of Middle East and Africa Space Situational Awareness Market Estimates and Forecast, 2016-2028 (US$ Bn)
12.5.3.2. Rest of Middle East and Africa Space Situational Awareness, By Solution, 2016-2028 (US$ Bn)
12.5.3.3. Rest of Middle East and Africa Space Situational Awareness, By Capability, 2016-2028 (US$ Bn)
12.5.3.4. Rest of Middle East and Africa Space Situational Awareness, By Object, 2016-2028 (US$ Bn)
12.5.3.5. Rest of Middle East and Africa Space Situational Awareness, By End Use, 2016-2028 (US$ Bn)

13. Company Profiles
13.1. Lockheed Martin Corporation
13.1.1. Company Overview
13.1.2. Products/Services Portfolio
13.1.3. Geographical Presence
13.1.4. Financial Summary
13.1.4.1. Market Revenue and Net Profit (2019-2021)
13.1.4.2. Business Segment Revenue Analysis
13.1.4.3. Geographical Revenue Analysis
13.2. L3Harris Technologies Inc.
13.3. Vision Engineering Solutions LLC
13.4. Analytical Graphics Inc
13.5. Kratos Defense & Security Solutions Inc
13.6. ExoAnalytic Solutions
13.7. SpaceNav
13.8. NorthStar Earth & Space Inc
13.9. GlobVision Inc
13.10. Etamax Space GmbH
13.11. Others

List of Figures

FIG. 1 Global Space Situational Awareness Market: Research Methodology
FIG. 2 Market Size Estimation – Top Down & Bottom up Approach
FIG. 3 Global Space Situational Awareness Market Segmentation
FIG. 4 Global Space Situational Awareness Market, By Solution, 2021 (US$ Bn)
FIG. 5 Global Space Situational Awareness Market, By Capability, 2021 (US$ Bn)
FIG. 6 Global Space Situational Awareness Market, By Object, 2021 (US$ Bn)
FIG. 7 Global Space Situational Awareness Market, By End Use, 2021 (US$ Bn)
FIG. 8 Global Space Situational Awareness Market, by Geography, 2021 (US$ Bn)
FIG. 9 Attractive Investment Proposition, By Solution, 2021
FIG. 10 Attractive Investment Proposition, By Capability, 2021
FIG. 11 Attractive Investment Proposition, By Object, 2021
FIG. 12 Attractive Investment Proposition, By End Use, 2021
FIG. 13 Attractive Investment Proposition, by Geography, 2021
FIG. 14 Global Market Share Analysis of Key Space Situational Awareness Market Manufacturers, 2021
FIG. 15 Global Market Positioning of Key Space Situational Awareness Market Manufacturers, 2021
FIG. 16 Global Space Situational Awareness Market Value Contribution, By Solution, 2021 & 2028 (Value %)
FIG. 17 Global Space Situational Awareness Market, by Services, Value, 2016-2028 (US$ Bn)
FIG. 18 Global Space Situational Awareness Market, by Payload Systems, Value, 2016-2028 (US$ Bn)
FIG. 19 Global Space Situational Awareness Market, by Software, Value, 2016-2028 (US$ Bn)
FIG. 20 Global Space Situational Awareness Market Value Contribution, By Capability, 2021 & 2028 (Value %)
FIG. 21 Global Space Situational Awareness Market, By Detect, Track, and identify (D/T/ID), Value, 2016-2028 (US$ Bn)
FIG. 22 Global Space Situational Awareness Market, By Threat warning and assessment, Value, 2016-2028 (US$ Bn)
FIG. 23 Global Space Situational Awareness Market, By Characterization, Value, 2016-2028 (US$ Bn)
FIG. 24 Global Space Situational Awareness Market Value Contribution, By Object, 2021 & 2028 (Value %)
FIG. 25 Global Space Situational Awareness Market, By Rocket bodies, Value, 2016-2028 (US$ Bn)
FIG. 26 Global Space Situational Awareness Market, By Mission-related debris, Value, 2016-2028 (US$ Bn)
FIG. 27 Global Space Situational Awareness Market, By Fragmentation debris, Value, 2016-2028 (US$ Bn)
FIG. 28 Global Space Situational Awareness Market, By Functional spacecraft, Value, 2016-2028 (US$ Bn)
FIG. 29 Global Space Situational Awareness Market, By Non-functional spacecraft, Value, 2016-2028 (US$ Bn)
FIG. 30 Global Space Situational Awareness Market, By Others, Value, 2016-2028 (US$ Bn)
FIG. 31 Global Space Situational Awareness Market Value Contribution, By End Use, 2021 & 2028 (Value %)
FIG. 32 Global Space Situational Awareness Market, By Commercial, Value, 2016-2028 (US$ Bn)
FIG. 33 Global Space Situational Awareness Market, By Government & Military, Value, 2016-2028 (US$ Bn)
FIG. 34 U.S. Space Situational Awareness Market, 2016-2028 (US$ Bn)
FIG. 35 Canada Space Situational Awareness Market, 2016-2028 (US$ Bn)
FIG. 36 Germany Space Situational Awareness Market, 2016-2028 (US$ Bn)
FIG. 37 France Space Situational Awareness Market, 2016-2028 (US$ Bn)
FIG. 38 U.K. Space Situational Awareness Market, 2016-2028 (US$ Bn)
FIG. 39 Italy Space Situational Awareness Market, 2016-2028 (US$ Bn)
FIG. 40 Spain Space Situational Awareness Market, 2016-2028 (US$ Bn)
FIG. 41 Rest of Europe Space Situational Awareness Market, 2016-2028 (US$ Bn)
FIG. 42 China Space Situational Awareness Market, 2016-2028 (US$ Bn)
FIG. 43 Japan Space Situational Awareness Market, 2016-2028 (US$ Bn)
FIG. 44 India Space Situational Awareness Market, 2016-2028 (US$ Bn)
FIG. 45 South Korea Space Situational Awareness Market, 2016-2028 (US$ Bn)
FIG. 46 Southeast Asia Space Situational Awareness Market, 2016-2028 (US$ Bn)
FIG. 47 Rest of Asia Pacific Space Situational Awareness Market, 2016-2028 (US$ Bn)
FIG. 48 Latin America Space Situational Awareness Market, 2016-2028 (US$ Bn)
FIG. 49 Brazil Space Situational Awareness Market, 2016-2028 (US$ Bn)
FIG. 50 Mexico Space Situational Awareness Market, 2016-2028 (US$ Bn)
FIG. 51 Rest of Latin America Space Situational Awareness Market, 2016-2028 (US$ Bn)
FIG. 52 Middle East & Africa Space Situational Awareness Market, 2016-2028 (US$ Bn)
FIG. 53 GCC Countries Space Situational Awareness Market, 2016-2028 (US$ Bn)
FIG. 54 South Africa Space Situational Awareness Market, 2016-2028 (US$ Bn)
FIG. 55 Rest of Middle East and Africa Space Situational Awareness Market, 2016-2028 (US$ Bn)

List of Tables

TABLE 1 Market Snapshot: Global Space Situational Awareness Market
TABLE 2 Global Space Situational Awareness Market, by Competitive Benchmarking, 2021
TABLE 3 Global Space Situational Awareness Market, by Geographical Presence Analysis, 2021
TABLE 4 Global Space Situational Awareness Market, by Key Strategies Analysis, 2021
TABLE 5 Global Space Situational Awareness Market, By Solution, 2016-2028 (US$ Bn)
TABLE 6 Global Space Situational Awareness Market, By Capability, 2016-2028 (US$ Bn)
TABLE 7 Global Space Situational Awareness Market, By Object, 2016-2028 (US$ Bn)
TABLE 8 Global Space Situational Awareness Market, By End Use, 2016-2028 (US$ Bn)
TABLE 9 Global Space Situational Awareness Market, by Geography, 2016-2028 (US$ Bn)
TABLE 10 North America Space Situational Awareness Market, By Solution, 2016-2028 (US$ Bn)
TABLE 11 North America Space Situational Awareness Market, By Capability, 2016-2028 (US$ Bn)
TABLE 12 North America Space Situational Awareness Market, By Object, 2016-2028 (US$ Bn)
TABLE 13 North America Space Situational Awareness Market, By End Use, 2016-2028 (US$ Bn)
TABLE 14 North America Space Situational Awareness Market, by Country, 2016-2028 (US$ Bn)
TABLE 15 US Space Situational Awareness Market, By Solution, 2016-2028 (US$ Bn)
TABLE 16 US Space Situational Awareness Market, By Capability, 2016-2028 (US$ Bn)
TABLE 17 US Space Situational Awareness Market, By Object, 2016-2028 (US$ Bn)
TABLE 18 US Space Situational Awareness Market, By End Use, 2016-2028 (US$ Bn)
TABLE 19 Canada Space Situational Awareness Market, By Solution, 2016-2028 (US$ Bn)
TABLE 20 Canada Space Situational Awareness Market, By Capability, 2016-2028 (US$ Bn)
TABLE 21 Canada Space Situational Awareness Market, By Object, 2016-2028 (US$ Bn)
TABLE 22 Canada Space Situational Awareness Market, By End Use, 2016-2028 (US$ Bn)
TABLE 23 Europe Space Situational Awareness Market, By Solution, 2016-2028 (US$ Bn)
TABLE 24 Europe Space Situational Awareness Market, By Capability, 2016-2028 (US$ Bn)
TABLE 25 Europe Space Situational Awareness Market, By Object, 2016-2028 (US$ Bn)
TABLE 26 Europe Space Situational Awareness Market, By End Use, 2016-2028 (US$ Bn)
TABLE 27 Europe Space Situational Awareness Market, by Country, 2016-2028 (US$ Bn)
TABLE 28 Germany Space Situational Awareness Market, By Solution, 2016-2028 (US$ Bn)
TABLE 29 Germany Space Situational Awareness Market, By Capability, 2016-2028 (US$ Bn)
TABLE 30 Germany Space Situational Awareness Market, By Object, 2016-2028 (US$ Bn)
TABLE 31 Germany Space Situational Awareness Market, by End Use, 2016-2028 (US$ Bn)
TABLE 32 France Space Situational Awareness Market, By Solution, 2016-2028 (US$ Bn)
TABLE 33 France Space Situational Awareness Market, By Capability, 2016-2028 (US$ Bn)
TABLE 34 France Space Situational Awareness Market, By Object, 2016-2028 (US$ Bn)
TABLE 35 France Space Situational Awareness Market, by End Use, 2016-2028 (US$ Bn)
TABLE 36 UK Space Situational Awareness Market, By Solution, 2016-2028 (US$ Bn)
TABLE 37 UK Space Situational Awareness Market, By Capability, 2016-2028 (US$ Bn)
TABLE 38 UK Space Situational Awareness Market, By Object, 2016-2028 (US$ Bn)
TABLE 39 UK Space Situational Awareness Market, by End Use, 2016-2028 (US$ Bn)
TABLE 40 Italy Space Situational Awareness Market, By Solution, 2016-2028 (US$ Bn)
TABLE 41 Italy Space Situational Awareness Market, By Capability, 2016-2028 (US$ Bn)
TABLE 42 Italy Space Situational Awareness Market, By Object, 2016-2028 (US$ Bn)
TABLE 43 Italy Space Situational Awareness Market, by End Use, 2016-2028 (US$ Bn)
TABLE 44 Spain Space Situational Awareness Market, By Solution, 2016-2028 (US$ Bn)
TABLE 45 Spain Space Situational Awareness Market, By Capability, 2016-2028 (US$ Bn)
TABLE 46 Spain Space Situational Awareness Market, By Object, 2016-2028 (US$ Bn)
TABLE 47 Spain Space Situational Awareness Market, by End Use, 2016-2028 (US$ Bn)
TABLE 48 Rest of Europe Space Situational Awareness Market, By Solution, 2016-2028 (US$ Bn)
TABLE 49 Rest of Europe Space Situational Awareness Market, By Capability, 2016-2028 (US$ Bn)
TABLE 50 Rest of Europe Space Situational Awareness Market, By Object, 2016-2028 (US$ Bn)
TABLE 51 Rest of Europe Space Situational Awareness Market, By End Use, 2016-2028 (US$ Bn)
TABLE 52 Asia Pacific Space Situational Awareness Market, By Solution, 2016-2028 (US$ Bn)
TABLE 53 Asia Pacific Space Situational Awareness Market, By Capability, 2016-2028 (US$ Bn)
TABLE 54 Asia Pacific Space Situational Awareness Market, By Object, 2016-2028 (US$ Bn)
TABLE 55 Asia Pacific Space Situational Awareness Market, by End Use, 2016-2028 (US$ Bn)
TABLE 56 Asia Pacific Space Situational Awareness Market, by Country, 2016-2028 (US$ Bn)
TABLE 57 China Space Situational Awareness Market, By Solution, 2016-2028 (US$ Bn)
TABLE 58 China Space Situational Awareness Market, By Capability, 2016-2028 (US$ Bn)
TABLE 59 China Space Situational Awareness Market, By Object, 2016-2028 (US$ Bn)
TABLE 60 China Space Situational Awareness Market, by End Use, 2016-2028 (US$ Bn)
TABLE 61 Japan Space Situational Awareness Market, By Solution, 2016-2028 (US$ Bn)
TABLE 62 Japan Space Situational Awareness Market, By Capability, 2016-2028 (US$ Bn)
TABLE 63 Japan Space Situational Awareness Market, By Object, 2016-2028 (US$ Bn)
TABLE 64 Japan Space Situational Awareness Market, by End Use, 2016-2028 (US$ Bn)
TABLE 65 India Space Situational Awareness Market, By Solution, 2016-2028 (US$ Bn)
TABLE 66 India Space Situational Awareness Market, By Capability, 2016-2028 (US$ Bn)
TABLE 67 India Space Situational Awareness Market, By Object, 2016-2028 (US$ Bn)
TABLE 68 India Space Situational Awareness Market, by End Use, 2016-2028 (US$ Bn)
TABLE 69 South Korea Space Situational Awareness Market, By Solution, 2016-2028 (US$ Bn)
TABLE 70 South Korea Space Situational Awareness Market, By Capability, 2016-2028 (US$ Bn)
TABLE 71 South Korea Space Situational Awareness Market, By Object, 2016-2028 (US$ Bn)
TABLE 72 South Korea Space Situational Awareness Market, by End Use, 2016-2028 (US$ Bn)
TABLE 73 South East Asia Space Situational Awareness Market, By Solution, 2016-2028 (US$ Bn)
TABLE 74 South East Asia Space Situational Awareness Market, By Capability, 2016-2028 (US$ Bn)
TABLE 75 South East Asia Space Situational Awareness Market, By Object, 2016-2028 (US$ Bn)
TABLE 76 South East Asia Space Situational Awareness Market, By End Use, 2016-2028 (US$ Bn)
TABLE 77 Rest of Asia Pacific Space Situational Awareness Market, By Solution, 2016-2028 (US$ Bn)
TABLE 78 Rest of Asia Pacific Space Situational Awareness Market, By Capability, 2016-2028 (US$ Bn)
TABLE 79 Rest of Asia Pacific Space Situational Awareness Market, By Object, 2016-2028 (US$ Bn)
TABLE 80 Rest of Asia Pacific Space Situational Awareness Market, By End Use, 2016-2028 (US$ Bn)
TABLE 81 Latin America Space Situational Awareness Market, By Solution, 2016-2028 (US$ Bn)
TABLE 82 Latin America Space Situational Awareness Market, By Capability, 2016-2028 (US$ Bn)
TABLE 83 Latin America Space Situational Awareness Market, By Object, 2016-2028 (US$ Bn)
TABLE 84 Latin America Space Situational Awareness Market, By End Use, 2016-2028 (US$ Bn)
TABLE 85 Latin America Space Situational Awareness Market, by Country, 2016-2028 (US$ Bn)
TABLE 86 Brazil Space Situational Awareness Market, By Solution, 2016-2028 (US$ Bn)
TABLE 87 Brazil Space Situational Awareness Market, By Capability, 2016-2028 (US$ Bn)
TABLE 88 Brazil Space Situational Awareness Market, By Object, 2016-2028 (US$ Bn)
TABLE 89 Brazil Space Situational Awareness Market, by End Use, 2016-2028 (US$ Bn)
TABLE 90 Mexico Space Situational Awareness Market, By Solution, 2016-2028 (US$ Bn)
TABLE 91 Mexico Space Situational Awareness Market, By Capability, 2016-2028 (US$ Bn)
TABLE 92 Mexico Space Situational Awareness Market, By Object, 2016-2028 (US$ Bn)
TABLE 93 Mexico Space Situational Awareness Market, by End Use, 2016-2028 (US$ Bn)
TABLE 94 Rest of Latin America Space Situational Awareness Market, By Solution, 2016-2028 (US$ Bn)
TABLE 95 Rest of Latin America Space Situational Awareness Market, By Capability, 2016-2028 (US$ Bn)
TABLE 96 Rest of Latin America Space Situational Awareness Market, By Object, 2016-2028 (US$ Bn)
TABLE 97 Rest of Latin America Space Situational Awareness Market, By End Use, 2016-2028 (US$ Bn)
TABLE 98 Middle East and Africa Space Situational Awareness Market, By Solution, 2016-2028 (US$ Bn)
TABLE 99 Middle East and Africa Space Situational Awareness Market, By Capability, 2016-2028 (US$ Bn)
TABLE 100 Middle East and Africa Space Situational Awareness Market, By Object, 2016-2028 (US$ Bn)
TABLE 101 Middle East and Africa Space Situational Awareness Market, By End Use, 2016-2028 (US$ Bn)
TABLE 102 Middle East and Africa Space Situational Awareness Market, by Country, 2016-2028 (US$ Bn)
TABLE 103 GCC Countries Space Situational Awareness Market, By Solution, 2016-2028 (US$ Bn)
TABLE 104 GCC Countries Space Situational Awareness Market, By Capability, 2016-2028 (US$ Bn)
TABLE 105 GCC Countries Space Situational Awareness Market, By Object, 2016-2028 (US$ Bn)
TABLE 106 GCC Countries Space Situational Awareness Market, by End Use, 2016-2028 (US$ Bn)
TABLE 107 South Africa Space Situational Awareness Market, By Solution, 2016-2028 (US$ Bn)
TABLE 108 South Africa Space Situational Awareness Market, By Capability, 2016-2028 (US$ Bn)
TABLE 109 South Africa Space Situational Awareness Market, By Object, 2016-2028 (US$ Bn)
TABLE 110 South Africa Space Situational Awareness Market, by End Use, 2016-2028 (US$ Bn)
TABLE 111 Rest of Middle East and Africa Space Situational Awareness Market, By Solution, 2016-2028 (US$ Bn)
TABLE 112 Rest of Middle East and Africa Space Situational Awareness Market, By Capability, 2016-2028 (US$ Bn)
TABLE 113 Rest of Middle East and Africa Space Situational Awareness Market, By Object, 2016-2028 (US$ Bn)
TABLE 114 Rest of Middle East and Africa Space Situational Awareness Market, By End Use, 2016-2028 (US$ Bn)

Frequently asked questions 

How does COVID-19 Impact the global space situational awareness market?

The COVID-19 epidemic has also harmed the space situational awareness market. Other explorations and observational endeavors were put on hold as the emphasis was diverted to a pandemic mitigation strategy.

Which is the leading region of the market for space situational awareness?

The greatest revenue share in the market for space situational awareness worldwide came from North America.

What are the key drivers for the growth of the space situational awareness market?

The increasing need for space-based sensing activities to drive the space situational awareness market.

Which is the major segment in the space situational awareness market by the solution?

The services segment had a major share in the global market in 2021.

Which is the major segment in the space situational awareness market by end-use?

The commercial segment had a major share in the global market.

Saudi Arabia Managed Security Services Market

Published:
Report ID: 36393

Microwave Oven Market

Published:
Report ID: 36314

Inkjet Coders Market

Published:
Report ID: 6669

Rich Communication Services Market

Published:
Report ID: 35774

Middle East and Africa Real-Time Payments Market

Published:
Report ID: 35770

Vietnam Managed Security Services (MSS) Market

Published:
Report ID: 35766

Middle East and Africa EdTech and Smart Classroom Market

Published:
Report ID: 35756

Digital Business Support System (DBSS) Market

Published:
Report ID: 35732

China Artificial Intelligence (AI) Market

Published:
Report ID: 35729

Asia-Pacific Workforce Management Software Market

Published:
Report ID: 35719

Mobile Wallet Market

Published:
Report ID: 8977

Recirculating Chillers Market

Published:
Report ID: 8862

Purchase Options

$2999
Delivery Format: Excel.
$4999
Designed for the individual purchaser.
$6999
Users located at a single corporate site or regional office.
$7999
Allowed for unlimited sharing globally within one company.
Smallform of Sample request

Have a question?

User Profile

Don’t settle for less – trust Mitul to help you find the best solution.

Report delivery within 24 to 48 hours

– Other Info –

What people say?-

User Review

I am very impressed with the information in this report. The author clearly did their research when they came up with this product and it has already given me a lot of ideas.

Jana Schmidt
CEDAR CX Technologies

– Connect with us –

Phone

+91 6232 49 3207


support

24/7 Research Support


sales@credenceresearch.com

– Research Methodology –

Going beyond the basics: advanced techniques in research methodology

– Trusted By –

Pepshi, LG, Nestle
Motorola, Honeywell, Johnson and johnson
LG Chem, SIEMENS, Pfizer
Unilever, Samsonite, QIAGEN