
| REPORT ATTRIBUTE | DETAILS |
|---|---|
| Historical Period | 2019-2022 |
| Base Year | 2023 |
| Forecast Period | 2024-2032 |
| United States Dog Treats, Chews, & Toppers Market Size 2024 | USD 2973.3 million |
| United States Dog Treats, Chews, & Toppers Market, CAGR | 5.1% |
| United States Dog Treats, Chews, & Toppers Market Size 2032 | USD 4426.49 million |
Market Overview:
The United States Dog Treats, Chews, & Toppers Market is projected to grow from USD 2973.3 million in 2024 to an estimated USD 4426.49 million by 2032, with a compound annual growth rate (CAGR) of 5.1% from 2024 to 2032.
The market’s expansion is fueled by multiple compelling drivers. Pet owners are increasingly seeking healthy, high-quality, and natural ingredient-based products for their dogs, reflecting broader trends in human food consumption. Functional treats offering specific health benefits, such as dental care, joint support, and improved digestion, are gaining traction among consumers who view their pets as family members. The growth of e-commerce platforms has further democratized access to premium and niche products, catering to a wide range of consumer preferences. Additionally, sustainability and ethical sourcing have emerged as critical factors influencing purchasing decisions. Brands are responding by introducing environmentally friendly packaging, responsibly sourced ingredients, and transparency in production processes. The ongoing pet humanization trend is inspiring innovation, with manufacturers offering gourmet options, customizable solutions, and treats tailored to specific dietary needs, capturing the attention of increasingly discerning pet owners.
Regionally, metropolitan and suburban areas in the United States lead the market, driven by higher disposable incomes, a culture of pet companionship, and a strong preference for premium pet care products. States like California, Texas, and New York are at the forefront, boasting large pet populations and advanced retail and e-commerce infrastructures. Urban areas dominate sales due to access to specialty stores and online platforms, but rural regions are also experiencing notable growth. Rising awareness of specialized pet nutrition and improved logistics for product distribution are expanding market reach in these areas. The integration of e-commerce into rural markets, alongside targeted marketing campaigns, is creating a more interconnected and dynamic market landscape nationwide.
Market Insights:
- The market is projected to grow from USD 2973.3 million in 2024 to USD 4426.49 million by 2032, reflecting a CAGR of 5.1%, driven by rising demand for premium and functional pet products.
- Functional treats targeting health concerns like dental hygiene, joint support, and digestion are gaining traction, reflecting health-conscious consumer trends.
- The rise of e-commerce platforms has enhanced market accessibility, offering a broad range of niche and premium product options.
- Sustainability is influencing consumer choices, with brands adopting recyclable packaging and responsibly sourced ingredients to meet eco-conscious demands.
- Innovations such as freeze-dried treats, grain-free options, and customizable portions are diversifying product offerings and appealing to modern consumer preferences.
- Urban areas dominate sales due to higher disposable incomes and access to specialty pet stores, while rural regions show growth driven by awareness and improved logistics.
- Challenges such as high production costs and regulatory compliance persist but are outweighed by opportunities created by rising demand for quality and innovation.
 Market Drivers:
Rising Pet Ownership and Humanization Trends:
The increasing prevalence of pet ownership in the United States, coupled with the trend of treating pets as family members, significantly drives the market for dog treats, chews, and toppers. As pets become integral to family dynamics, their health and happiness are prioritized by owners, leading to heightened spending on premium and specialized products. This shift has created a robust demand for products that enhance not only nutrition but also the overall well-being of pets. For instance, according to the American Pet Products Association, 95% of American pet owners consider their pets as family members. Companies like Chewy have capitalized on this trend by offering personalized services such as custom pet portraits and condolence cards for deceased pets. Dog owners are now more willing than ever to invest in high-quality treats and chews that align with their personal values, such as sustainability, ethical sourcing, and holistic care.
Health and Wellness Focus:
The rising awareness of pet health and wellness is another major driver shaping the market. Dog owners are increasingly seeking functional products that address specific health concerns such as dental care, joint health, digestion, and weight management. Treats infused with vitamins, probiotics, or antioxidants are becoming more common as consumers demand nutritional value in addition to palatability. Brands are responding by introducing treats made with natural ingredients, free from artificial preservatives, and tailored to specific dietary needs. For example, Mars Petcare has introduced Greenies Dental Treats, which are designed to improve dental health while being made from natural ingredients. This focus on health-conscious consumption reflects broader consumer trends, reinforcing the symbiotic relationship between human and pet wellness industries.
Innovation and Customization in Product Offerings:
Product innovation and customization play pivotal roles in market growth. Companies are leveraging trends in gourmet and artisanal foods to develop a range of unique, high-quality treats, including grain-free, organic, and freeze-dried options. Customization, such as breed-specific treats or personalized flavor profiles, is gaining traction among discerning consumers looking for unique offerings. Additionally, the development of toppers-used to enhance meals with added nutrition and flavor-has expanded the market, appealing to owners seeking variety in their pets’ diets. These innovations not only meet existing demands but also cultivate new consumer segments.
E-commerce Expansion and Sustainability Trends:
The rapid growth of e-commerce platforms is making premium pet products more accessible across the United States, further fueling market expansion. Online shopping enables consumers to explore a wider range of options, including niche products not readily available in physical stores. Additionally, sustainability concerns are influencing purchasing behaviors, as eco-friendly and ethically sourced packaging and ingredients become important factors for consumers. Companies that integrate sustainability into their product development and marketing strategies are seeing heightened engagement and loyalty from environmentally conscious consumers, positioning themselves for long-term growth in an increasingly competitive market.
Market Trends:
Rising Demand for Functional and Nutritional Products:
Consumers are increasingly prioritizing dog treats, chews, and toppers that offer functional benefits, such as improving dental health, enhancing coat shine, or supporting joint health. Products enriched with ingredients like glucosamine, probiotics, or omega-3 fatty acids are gaining traction as pet owners seek solutions to address specific health concerns. The shift toward functional treats highlights the growing awareness among pet owners regarding holistic pet care, leading manufacturers to innovate and expand their product portfolios.
Growth of Premium and Natural Products:
The market is witnessing robust growth in demand for premium and natural products, driven by a focus on ingredient transparency and quality. Consumers prefer treats and chews free from artificial additives, preservatives, or fillers, opting for organic or minimally processed options. For example, Blue Buffalo's Wilderness Trail Treats are made with high-quality protein from real meat and contain no artificial preservatives. High-protein treats, sourced from grass-fed or human-grade meat, are becoming a staple among health-conscious pet owners. This trend is also influencing manufacturers to adopt eco-friendly and sustainable practices, further appealing to environmentally conscious consumers.
Emergence of Personalized and Customizable Solutions:
Personalization is becoming a significant trend in the dog treats market, as pet owners increasingly seek tailored solutions for their pets’ dietary preferences and health needs. Brands are introducing customizable options, such as subscription services that deliver tailored treat assortments based on a dog’s breed, age, and health conditions. This level of personalization enhances customer engagement and loyalty, offering a unique competitive edge in a crowded market.
Expansion of E-Commerce and Direct-to-Consumer Channels:
E-commerce and direct-to-consumer channels are reshaping the distribution landscape for dog treats, chews, and toppers. The convenience of online shopping, coupled with the availability of subscription models, is driving increased consumer adoption. Pet-specific online platforms, as well as major e-retailers like Amazon and Chewy, offer a wide range of products, enabling pet owners to compare and purchase from the comfort of their homes. For example, e-commerce is anticipated to account for 40% of total pet food sales, exceeding $21 billion in 2024. This digital shift has also allowed smaller and niche brands to gain visibility and compete effectively with established players.
Market Challenges Analysis:
High Product Costs and Affordability Issues:
ne of the significant challenges in the United States dog treats, chews, and toppers market is the high cost of premium products. As consumers increasingly demand organic, high-protein, or functional treats, manufacturers face rising production costs, especially for sourcing quality ingredients and maintaining stringent quality control standards. These expenses often translate into higher retail prices, limiting accessibility for budget-conscious pet owners. The affordability gap between mass-market and premium offerings remains a barrier, particularly in competitive economic environments.
Regulatory and Compliance Complexities:
Navigating the regulatory landscape poses another challenge for market players. The production of pet treats must adhere to stringent guidelines set by organizations such as the U.S. Food and Drug Administration (FDA) and the Association of American Feed Control Officials (AAFCO). Ensuring compliance with these standards can be time-consuming and resource-intensive, particularly for small and medium-sized enterprises. Additionally, as new trends such as CBD-infused or insect-based treats emerge, regulatory ambiguities in these segments further complicate market entry and growth.
Supply Chain Disruptions and Ingredient Sourcing Challenges:
Supply chain vulnerabilities, exacerbated by global disruptions, present ongoing challenges for manufacturers. Sourcing high-quality, sustainable ingredients-such as grass-fed meat or organic produce-can be inconsistent due to fluctuating supply and rising raw material costs. These disruptions impact production schedules, increase lead times, and inflate operational costs, potentially eroding profit margins for businesses and affecting product availability for consumers.
Consumer Awareness and Misinformation:
Despite growing interest in premium and functional treats, a lack of consumer awareness about the nutritional benefits and differences among product types hampers market growth. Some pet owners may lack understanding of how specific treats or toppers contribute to their dogs’ health, leading to reliance on lower-cost, less nutritious alternatives. Additionally, misinformation about new trends, such as plant-based or CBD-infused treats, creates hesitation among potential buyers, slowing adoption rates for innovative products. Addressing these challenges requires targeted educational initiatives and transparent marketing strategies.
Market Opportunities:
The United States dog treats, chews, and toppers market presents significant opportunities, driven by the growing pet humanization trend and increasing consumer focus on pet health and wellness. As pet owners increasingly treat their dogs as members of the family, demand for high-quality, nutritious, and innovative products continues to rise. This evolving consumer mindset creates room for premium and functional treats that address specific health needs, such as dental care, joint support, and weight management. The rise in disposable income among pet owners further fuels their willingness to invest in superior-quality products, paving the way for market growth.
Emerging distribution channels, particularly e-commerce and subscription-based services, are amplifying accessibility and convenience for consumers. Digital platforms provide opportunities for smaller and niche brands to gain market visibility, enabling them to target specific consumer preferences effectively. Moreover, the growing popularity of sustainable and natural products aligns with broader environmental and health-conscious trends, encouraging manufacturers to innovate with eco-friendly packaging and organic ingredients. As consumer demand shifts towards personalized pet nutrition and customized solutions, companies offering tailored products and subscription plans are poised to capitalize on this lucrative market. This landscape underscores the potential for both established brands and emerging players to expand their reach and enhance their offerings to meet the dynamic needs of the modern pet owner.
Market Segmentation Analysis:
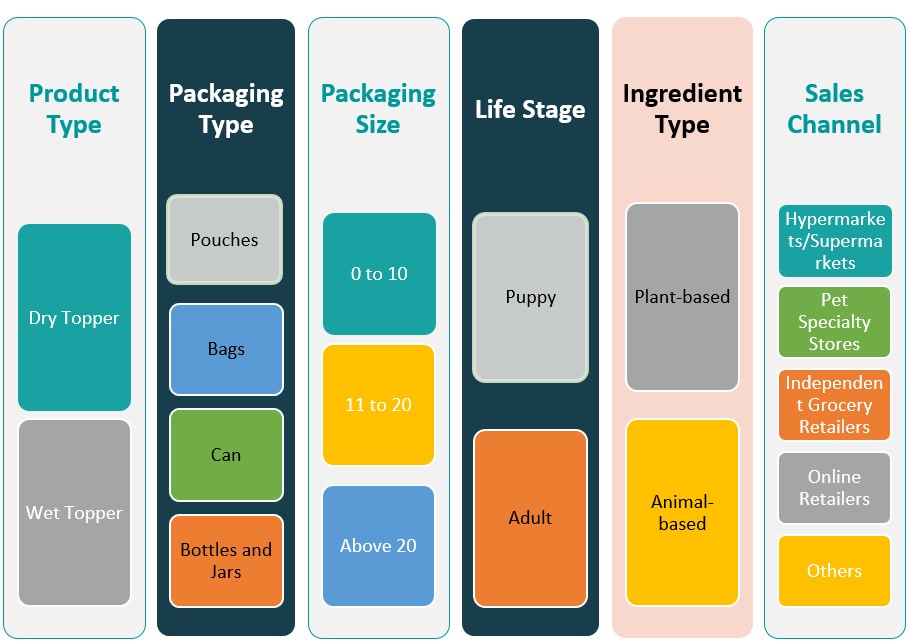
The United States Dog Treats, Chews, & Toppers Market is characterized by diverse product offerings catering to the evolving needs of pet owners.
By product type, the market includes freeze-dried treats, training treats, dental chews, jerky treats, biscuits and cookies, and other niche items, with dental chews and training treats gaining traction due to their functional benefits and utility in behavioral management.
By ingredient type, plant-based and animal-based products dominate, with the latter maintaining a stronghold due to high protein content and perceived nutritional value. However, plant-based options are rapidly emerging, driven by the trend toward sustainable and allergen-free pet nutrition.
By packaging type, formats such as pouches, bags, cans, and bottles or jars cater to different consumer preferences, with pouches being particularly popular for their convenience and resealability.
By Packaging sizes also vary, segmented into 0 to 10 ounces, 10 to 20 ounces, and above 20 ounces, reflecting consumer buying patterns based on pet size, frequency of use, and budget considerations.
By life stage, products are tailored for puppies and adult dogs, with a growing emphasis on age-specific nutritional needs, particularly for senior pets requiring specialized care.
By sales channel, pet specialty stores dominate due to their curated selections and knowledgeable staff, while modern trade outlets like hypermarkets and supermarkets remain key distribution points. Online retailers are expanding rapidly, fueled by convenience, variety, and personalized recommendations. Drug stores, convenience stores, and other sales channels also contribute to market accessibility, catering to diverse consumer demographics.
Segmentation:
By Product Type:
- Freeze-dried Treats
- Training Treats
- Dental Chews
- Jerky Treats
- Biscuits & Cookies
- Others
By Ingredient Type:
- Plant-based
- Animal-based
By Packaging Type:
- Pouches
- Bags
- Can
- Bottles & Jars
By Packaging Size (in Ounces):
- 0 to 10
- 10 to 20
- Above 20
By Life Stage:
- Puppy
- Adult Dogs
By Sales Channel:
- Pet Specialty Stores
- Drug Stores
- Modern Trade (Hypermarket/ Supermarkets)
- Online Retailers
- Convenience Stores
- Other Sales Channel
Based on the Geography:
- North America
- U.S.
- Canada
- Mexico
- Europe
- UK
- France
- Germany
- Italy
- Spain
- Russia
- Belgium
- Netherlands
- Austria
- Sweden
- Poland
- Denmark
- Switzerland
- Rest of Europe
- Asia Pacific
- China
- Japan
- South Korea
- India
- Australia
- Thailand
- Indonesia
- Vietnam
- Malaysia
- Philippines
- Taiwan
- Rest of Asia Pacific
- Latin America
- Brazil
- Argentina
- Peru
- Chile
- Colombia
- Rest of Latin America
- Middle East
- UAE
- KSA
- Israel
- Turkey
- Iran
- Rest of Middle East
- Africa
- Egypt
- Nigeria
- Algeria
- Morocco
- Rest of Africa
Regional Analysis:
The United States dog treats, chews, and toppers market exhibits notable regional variations, driven by differences in pet ownership trends, consumer preferences, and economic factors. Each region contributes uniquely to the market dynamics, reflecting localized opportunities and challenges.
The Northeast accounts for approximately 20% of the market share, characterized by a dense urban population and a strong inclination toward premium pet products. Pet owners in this region prioritize convenience and high-quality nutrition for their dogs, leading to robust demand for functional treats and toppers. Urban centers such as New York and Boston drive sales, supported by the availability of boutique pet stores and subscription-based delivery services that cater to discerning consumers.
The Midwest holds around 25% of the market share, benefiting from a high rate of pet ownership and a preference for cost-effective, bulk-purchase options. Consumers in this region often seek value-driven products without compromising on quality. As a result, mid-tier and family-focused brands perform well. The region also supports manufacturing and distribution networks due to its strategic location and affordability, enabling brands to efficiently reach national and local markets.
The South represents the largest regional market, capturing approximately 30% of the market share. This dominance is attributed to a high prevalence of pet ownership, particularly among households with large yards and multiple pets. The South's demand is diverse, spanning basic treats to specialized chews for dental and behavioral health. Retail giants and e-commerce platforms dominate the distribution channels, reflecting the region's affinity for accessible and affordable pet products.
The West accounts for about 25% of the market share, driven by innovation and premiumization trends. States like California and Washington are hubs for eco-conscious and health-focused consumers who prioritize organic, grain-free, and sustainably sourced products. The strong presence of tech-savvy and affluent pet owners supports the growth of direct-to-consumer models, subscription plans, and bespoke pet nutrition services. The region’s entrepreneurial spirit has also fostered the emergence of niche and artisanal brands catering to specific dietary needs and preferences.
Key Player Analysis:
- Canidae Pet Food
- General Mills Inc.
- Mars Inc.
- Merrick Pet Care Inc.
- Natural Balance Pet Foods
- Plato Pet Treats
- Primal Pet Group
- Redbarn Pet Products LLC
- The Honest Kitchen
- Wellness Pet Company
- Zuke's LLC
Competitive Analysis:
The United States dog treats, chews, and toppers market is highly competitive, driven by both established brands and emerging players striving for differentiation in product innovation and quality. Prominent market leaders such as Purina, Hill’s Pet Nutrition, and Blue Buffalo maintain dominance through extensive distribution networks, brand loyalty, and continuous investment in research and development. These players focus on premium offerings and health-centric solutions, catering to growing consumer demand for functional and organic pet products. Emerging brands and niche companies, such as The Honest Kitchen and Zuke’s, are carving out market share by targeting eco-conscious and health-focused pet owners with innovative formulations and sustainable packaging. Direct-to-consumer (DTC) platforms and e-commerce channels have lowered entry barriers, enabling smaller brands to reach a wider audience. Overall, competition is intensifying as companies adopt strategies including new product launches, partnerships, and marketing campaigns to enhance visibility and capture evolving consumer preferences.
Recent Developments:
- In March 2024, Dr. Clauder's and Calysta introduced FeedKind Pet protein-based air-dried treats at Interzoo 2024, offering non-GMO, vegan, grain-free, and gut health-supporting options.
- In February 2024, Italcol and Alpina launched Dog Yurt, topping-snacks featuring Nutri-Bar and DelidogMix, combining probiotics with nutrient-rich ingredients to meet demand for functional pet treats.
Market Concentration & Characteristics:
The United States dog treats, chews, and toppers market exhibits moderate market concentration, with a mix of established multinational companies and a growing number of niche and emerging players. Large corporations such as Nestlé Purina, Mars Petcare, and Hill’s Pet Nutrition dominate the market, leveraging strong brand recognition, extensive distribution networks, and significant marketing budgets to maintain their competitive edge. These key players collectively account for a substantial share of the market. However, the market is increasingly fragmented due to the rise of smaller brands offering premium, organic, and customized products that cater to evolving consumer demands for healthier and more functional pet food options. The increasing role of e-commerce and direct-to-consumer platforms has further enabled niche players to compete effectively. The market is characterized by a strong focus on innovation, sustainability, and personalization, driven by consumers' desire for high-quality, health-focused, and eco-friendly pet products. This dynamic landscape continues to foster both competition and growth.
Report Coverage:
The research report offers an in-depth analysis based on By Product Type, By Ingredient Type, By Packaging Type, By Packaging Size (in Ounces), By Life Stage and By Sales Channel. It details leading market players, providing an overview of their business, product offerings, investments, revenue streams, and key applications. Additionally, the report includes insights into the competitive environment, SWOT analysis, current market trends, as well as the primary drivers and constraints. Furthermore, it discusses various factors that have driven market expansion in recent years. The report also explores market dynamics, regulatory scenarios, and technological advancements that are shaping the industry. It assesses the impact of external factors and global economic changes on market growth. Lastly, it provides strategic recommendations for new entrants and established companies to navigate the complexities of the market.
Future Outlook:
- The market for dog treats, chews, and toppers in the United States is expected to witness sustained growth, driven by increasing pet ownership and humanization trends.
- Rising consumer demand for natural, organic, and functional treats will continue to shape product innovation and offerings.
- Advances in personalization, such as breed-specific and age-specific products, will expand niche market segments.
- The growth of e-commerce platforms will provide wider accessibility to premium and boutique pet food brands.
- Increasing consumer awareness of sustainable and eco-friendly packaging will influence product and brand choices.
- Functional treats addressing health issues like dental care, joint health, and digestion will gain more traction.
- Urbanization and smaller living spaces will drive demand for convenient and portable treat formats.
- Collaborations between veterinarians and pet food companies will enhance the credibility of therapeutic and high-nutrition products.
- Rising disposable incomes and willingness to spend on premium pet products will further fuel market expansion.
- Market growth will be bolstered by continued investment in branding, digital marketing, and direct-to-consumer sales channels.

Request a Free Sample
Fill in your details and we'll send you a free sample report.
- Sample data tables & charts
- Research methodology
Need a Custom Version of This Report?
Tailor the scope, geography, or segments to your exact requirements.
- Custom geography or segment scope
- Direct access to our analyst team
Frequently Asked Questions
What is the projected market size and growth rate?
What factors are driving the market growth?
What are the key trends in this market?
Which regions lead the market?
Table of Content
Chapter 1. Report Introduction
- 1.1 Report Description & Purpose
- 1.1.1 Report Title & Market Definition
- 1.1.2 Unique Selling Propositions (USP) & Key Differentiators
- 1.1.3 Value Proposition for Stakeholders
- 1.2 Research Objectives
- 1.2.1 Market Sizing Objectives (Volume & Revenue) (Volume Where Applicable)
- 1.2.2 Segmentation Objectives
- 1.2.3 Competitive Intelligence Objectives
- 1.2.4 Forecast & Scenario Objectives
- 1.3 Report Scope
- 1.3.1 United States Dog Treats, Chews, & Toppers Scope – Segments & Subsegments Covered
- 1.3.2 Geographic Scope – Selected Country & Subnational Markets Covered
- 1.3.3 Historical Period, Base Year & Forecast Period (2024; forecast to 2032)
- 1.3.4 Inclusions & Exclusions
- 1.4 Industry Classification & Applicable Codes
- 1.5 Currency, Measurement Units & Valuation Basis
- 1.6 Target Stakeholders
- 1.7 Limitations & Assumptions
Chapter 2. Executive Summary
- 2.1 United States Dog Treats, Chews, & Toppers Snapshot
- 2.1.1 Market Size – Historical (2024) & Forecast (2024-2032) (2024: USD 2973.3 million → 2032: USD 4426.49 million)
- 2.1.2 Volume & Revenue – National Totals (Volume Where Applicable)
- 2.1.3 Key Market Highlights – Top Five Facts
- 2.2 United States Dog Treats, Chews, & Toppers Segmentation Snapshot
- 2.2.1 Market Split by Subnational Area – 2024 vs. 2032
- 2.3 Competitive Snapshot
- 2.3.1 Top 10 Players by Revenue Share – 2024
- 2.3.2 Top 10 Players by Volume Share – 2024 (Volume Where Applicable)
- 2.3.3 Recent Strategic Developments (18-Month Summary)
- 2.4 Key Investment Highlights & Strategic Conclusions
Chapter 3. United States Dog Treats, Chews, & Toppers Dynamics & Industry Analysis
- 3.1 Market Overview & Context
- 3.1.1 United States Dog Treats, Chews, & Toppers Position in the Broader Industry Value Chain
- 3.1.2 Demand Structure & Purchasing Dynamics
- 3.1.3 Market Maturity & Development Stage Across Domestic Markets
- 3.2 United States Dog Treats, Chews, & Toppers Drivers
- 3.3 United States Dog Treats, Chews, & Toppers Restraints & Challenges
- 3.4 United States Dog Treats, Chews, & Toppers Opportunities
- 3.5 Porter's Five Forces Analysis
- 3.5.1 Threat of New Entrants
- 3.5.2 Bargaining Power of Suppliers
- 3.5.3 Bargaining Power of Buyers
- 3.5.4 Threat of Substitutes
- 3.5.5 Competitive Rivalry – Intensity Assessment
- 3.6 United States Dog Treats, Chews, & Toppers Value Chain Analysis
- 3.6.1 Upstream – Key Inputs, Resources & Suppliers
- 3.6.1.1 Key Input/Resource 1
- 3.6.1.2 Key Input/Resource 2
- 3.6.1.3 Key Input/Resource 3
- 3.6.2 Midstream – Core Operations & Value Creation
- 3.6.2.1 Operating Model & Process Overview
- 3.6.2.2 Key Operating Locations & Capabilities by Company
- 3.6.3 Downstream – Market Channels & End Users
- 3.6.3.1 Direct Sales & Customer Engagement Channels
- 3.6.3.2 Indirect Sales, Intermediaries & Partner Channels
- 3.6.4 Value Chain Profitability Analysis
- 3.6.1 Upstream – Key Inputs, Resources & Suppliers
- 3.7 PESTEL Analysis
- 3.7.1 Political Factors
- 3.7.2 Economic Factors
- 3.7.3 Social Factors
- 3.7.4 Technological Factors
- 3.7.5 Environmental Factors
- 3.7.6 Legal Factors
- 3.8 United States Dog Treats, Chews, & Toppers Supply Chain Analysis
- 3.8.1 Critical Input & Resource Availability Risk Assessment
- 3.8.2 Supplier & Operational Concentration Risk (Geographic Exposure)
- 3.8.3 Supply & Service Disruption Impact Analysis
- 3.9 National & Subnational Regulatory Landscape
Note: The regulatory and policy landscape section covers regulations based on their applicability to the market, United States Dog Treats, Chews, & Toppers category, geography, and scope of the study. Only regulatory frameworks with a material impact on operations, compliance, trade, sustainability, or market access are analyzed in detail.
Chapter 4. Key Investment Pockets & Opportunity Analysis
- 4.1 United States Dog Treats, Chews, & Toppers Attractiveness Analysis
- 4.1.1 By Subnational Area – Investment Attractiveness Matrix (Market Size × CAGR)
- 4.2 Absolute Revenue Growth Opportunity
- 4.2.1 By Subnational Area – Absolute Revenue Growth Through 2032
- 4.3 Incremental Demand Opportunity
- 4.3.1 By Subnational Area – Incremental Demand Through 2032
- 4.3.2 Segment – Incremental Demand
- 4.4 Emerging Submarket Opportunity Deep Dive (Subject to Applicability)
- 4.5 Priority Domestic Market Opportunity Scorecards
- 4.5.1 Priority Domestic Market 1
- 4.5.2 Priority Domestic Market 2
- 4.5.3 Priority Domestic Market 3
- 4.5.4 Priority Domestic Market 4
Note: Domestic market scorecards cover relevant states, provinces, territories, cities, or economic zones within the selected country. Numbered entries are populated with market names suited to the national administrative structure and research scope. Geographic share tables use one consistent, nonoverlapping set of areas.
Chapter 5. United States Dog Treats, Chews, & Toppers Cross-Border Trade & Market Access Analysis
- 5.1 National Trade & International Partner Overview
- 5.1.1 Export Value by Destination Country (2024)
- 5.1.2 Export Volume by Destination Country (2024) (Where Applicable)
- 5.1.3 Import Value by Source Country (2024)
- 5.1.4 Import Volume by Source Country (2024) (Where Applicable)
- 5.1.5 National & Partner-Country Trade Balances (2024)
- 5.2 Export Analysis – Segment
- 5.2.1 Category 1 (Applicable Classification Code)
- 5.2.2 Category 2 (Applicable Classification Code)
- 5.2.3 Category 3 (Applicable Classification Code)
- 5.2.4 Category 4 (Applicable Classification Code)
- 5.2.5 Category 5 (Applicable Classification Code)
- 5.3 Import Analysis – Segment
- 5.3.1 Category 1 (Applicable Classification Code)
- 5.3.2 Category 2 (Applicable Classification Code)
- 5.3.3 Category 3 (Applicable Classification Code)
- 5.3.4 Category 4 (Applicable Classification Code)
- 5.3.5 Category 5 (Applicable Classification Code)
- 5.4 Cross-Border Pricing & Transaction Benchmarks
- 5.4.1 Export Pricing – Segment & Destination Country
- 5.4.2 Import Pricing – Segment & Source Country
- 5.4.3 Price Trends (2024)
- 5.5 Key Cross-Border Trade & Delivery Routes
- 5.5.1 Cross-Border Trade/Delivery Route 1
- 5.5.2 Cross-Border Trade/Delivery Route 2
- 5.5.3 Cross-Border Trade/Delivery Route 3
- 5.5.4 Cross-Border Trade/Delivery Route 4
- 5.5.5 Cross-Border Trade/Delivery Route 5
- 5.6 Trade Policy & Market Access Impact Assessment
- 5.6.1 Tariff & Non-Tariff Barriers
- 5.6.2 National Participation in Regional Trade & Economic Frameworks
- 5.6.3 Bilateral & Multilateral Trade Agreements
- 5.6.4 Cross-Border Operating, Licensing & Localization Requirements
Note: This chapter covers international trade relevant to United States Dog Treats, Chews, & Toppers in the selected country. Exports are analyzed by destination and imports by source. Domestic interregional flows are excluded from international trade totals. Goods, services, and digital offerings use applicable classifications; volume and route analyses apply only where meaningful.
Chapter 6. Competitive Landscape & Company Benchmarking
- 6.1 United States Dog Treats, Chews, & Toppers Concentration & Structure
- 6.1.1 Herfindahl-Hirschman Index (HHI) – the historical period vs. 2024
- 6.1.2 Leading, Mid-Sized & Emerging Player Structure
- 6.1.3 Multinational, National & Local Player Dynamics
- 6.2 United States Dog Treats, Chews, & Toppers Share Analysis – 2024
- 6.2.1 National Revenue Share by Company
- 6.2.2 National Volume Share by Company (Volume Where Applicable)
- 6.2.3 Company Revenue Share by Subnational Area
- 6.2.4 Market Share Evolution (the historical period vs. 2024)
- 6.2.5 Company Market Share by Key Segment
- 6.2.6 Company Market Share by Customer Group
- 6.3 Operating Scale, Capacity & Infrastructure Analysis
- 6.3.1 National Operating Scale & Supply Capacity
- 6.3.2 Resource Utilization & Operating Efficiency
- 6.3.3 Output, Service Delivery & Activity Metrics
- 6.3.4 Operating Footprint & Infrastructure Map
- 6.3.5 Planned Operational & Capacity Expansion
- 6.4 United States Dog Treats, Chews, & Toppers Competitive Benchmarking Matrix
- 6.4.1 Revenue, Growth, Profitability & Operating Metric Comparison
- 6.4.2 Channel Revenue Mix
- 6.4.3 Revenue Exposure Across Domestic Markets
- 6.4.4 R&D Intensity
- 6.4.5 Sustainability Maturity
- 6.5 Strategic Developments in United States Dog Treats, Chews, & Toppers (Last 24 Months)
- 6.5.1 Mergers, Acquisitions & Divestments
- 6.5.2 New Products, Services & Solutions in United States Dog Treats, Chews, & Toppers
- 6.5.3 Operational & Infrastructure Expansions
- 6.5.4 Strategic Alliances, Joint Ventures & Partnerships
- 6.5.5 Distribution Expansion & Market Entry
- 6.5.6 Sustainability & ESG Initiatives
- 6.6 Competitive Strategy Mapping
- 6.6.1 Leader, Challenger, Follower & Niche Classification
- 6.6.2 Pricing Strategy Comparison
- 6.6.3 Channel Strategy Matrix
Note: Strategic developments are included based on their materiality and the availability of reliable information.
Chapter 7. United States Dog Treats, Chews, & Toppers – By Sales & Delivery Channel
- 7.1 Segment Overview
- 7.1.1 Volume & Revenue Split by Channel (2024 & 2032) (Volume Where Applicable)
- 7.1.2 Channel Mix Evolution (2024-2032)
Chapter 8. Subnational Market Analysis – Country Overview
- 8.1 Domestic Geographic Market Overview
- 8.1.1 Subnational Volume Share (Where Applicable)
- 8.1.2 Subnational Revenue Share
- 8.1.3 Market Volume by Subnational Area (Where Applicable)
- 8.1.4 Market Revenue by Subnational Area
- 8.1.5 Subnational Forecasts Through 2032
- 8.2 Cross-Area Segment Analysis Within the Country
- 8.2.1 By Sales & Delivery Channel
- 8.2.2 By Competitive Positioning & Price Tier
Chapter 9. United States Dog Treats, Chews, & Toppers – Priority Domestic Market 1
Chapter 10. United States Dog Treats, Chews, & Toppers – Priority Domestic Market 2
Chapter 11. United States Dog Treats, Chews, & Toppers – Priority Domestic Market 3
Chapter 12. United States Dog Treats, Chews, & Toppers – Priority Domestic Market 4
Chapter 13. United States Dog Treats, Chews, & Toppers Company Profiles
- 13.1 [Company 01]
- 13.1.1 Company Overview
- 13.1.2 Key Management Personnel
- 13.1.3 Products & Services Portfolio
- 13.1.4 Financial Performance
- 13.1.5 Domestic Market Focus & Local Operating Presence
- 13.1.6 Recent Developments & Strategic Initiatives
Note: The company profile list is preliminary and may change based on research findings, market developments, data availability, and client requirements.
Chapter 14. Appendices
- Appendix A – List of Abbreviations & Acronyms
- Appendix B – Industry Classification Code Reference – Full Series
- Appendix C – Supply, Output & Operating Capacity Data Tables
- Appendix D – End-Use & Demand Base Tables
- Appendix E – Demand, Adoption & Usage Assumptions
- Appendix F – Pricing & Revenue Metric Reference Tables
- Appendix G – Company Operations & Infrastructure Database
- Appendix H – Cross-Border Trade & Activity Data Tables (Where Applicable)
- Appendix I – Regulatory Summary Tables
- Appendix J – Primary Research Participant List (Anonymized)
- Appendix K – Primary Research Questionnaire Framework
- Appendix L – Data Sources & Bibliography
- Appendix M – Market Size Divergence & Source Comparison
Chapter 15. Research Methodology
- 15.1 Research Framework & Philosophy
- 15.2 Secondary Research – Sources, Hierarchy & Data Extraction
- 15.3 Data Modeling – National Market Sizing & Subnational Allocation
- 15.4 Primary Research – Stakeholder Framework, LOI & Sample Sizes
- 15.5 Forecast Methodology – Regression, Scenario & Sensitivity Analysis
- 15.6 Quality Control – Four-Layer Validation Framework
- 15.7 Limitations & Standard Assumptions
- 15.8 Disclaimer
