Market Overview:
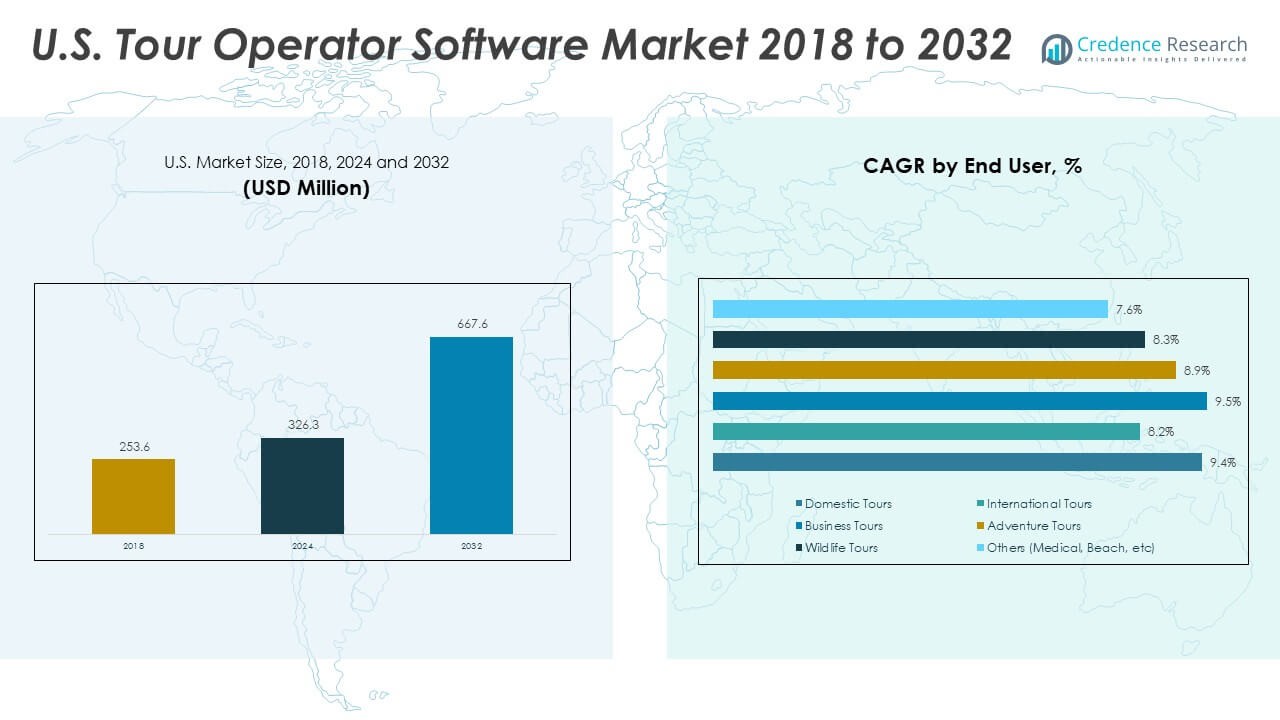
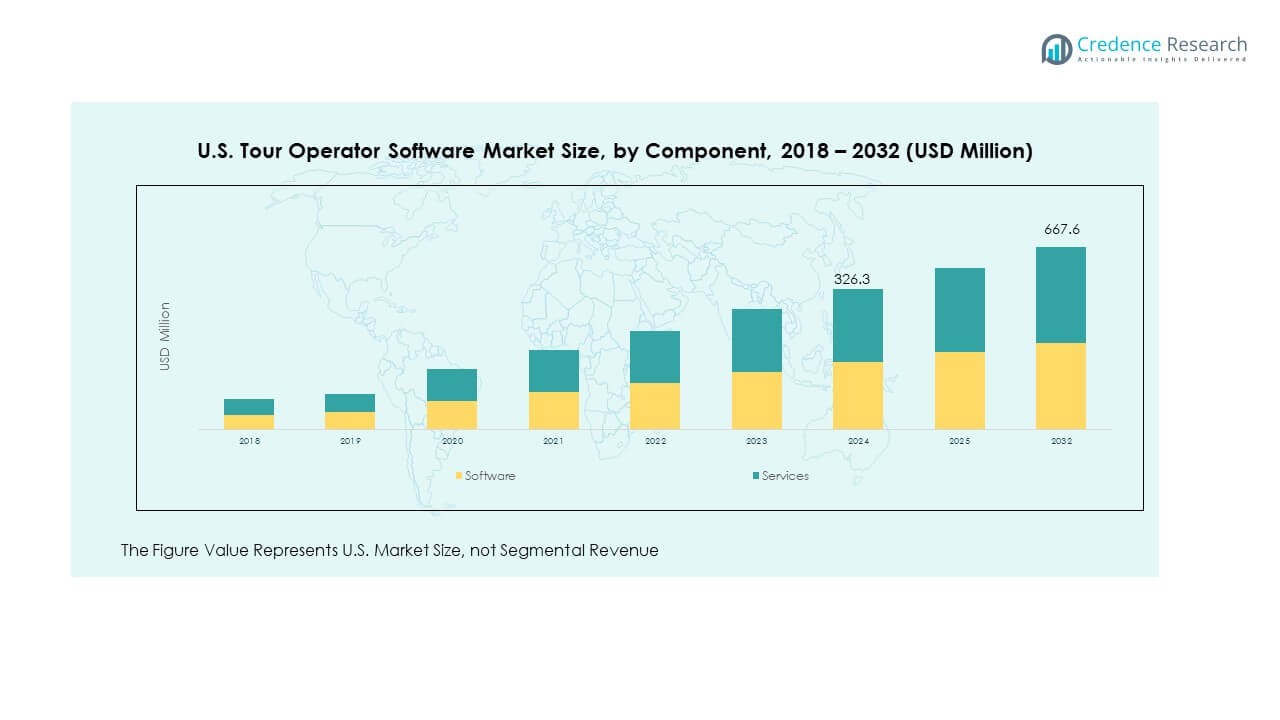
The U.S. Tour Operator Software Market size was valued at USD 253.6 million in 2018 to USD 326.3 million in 2024 and is anticipated to reach USD 667.6 million by 2032, at a CAGR of 9.36% during the forecast period.
| REPORT ATTRIBUTE |
DETAILS |
| Historical Period |
2020-2023 |
| Base Year |
2024 |
| Forecast Period |
2025-2032 |
| U.S. Tour Operator Software Market Size 2024 |
USD 326.3 Million |
| U.S. Tour Operator Software Market, CAGR |
9.36% |
| U.S. Tour Operator Software Market Size 2032 |
USD 667.6 Million |
Growth in this market is being driven by the rapid adoption of digital booking solutions, rising demand for personalized travel experiences, and the shift toward automation in tour management. Tour operators increasingly rely on software platforms that streamline reservations, payment systems, itinerary creation, and customer communication. Cloud-based solutions and AI-powered features enhance scalability, operational efficiency, and decision-making. In addition, the growing role of data analytics and CRM integration improves customer engagement, while mobile-friendly interfaces support seamless user experiences for both operators and travellers.
The U.S. Tour Operator Software Market is strongly concentrated in developed states with mature travel ecosystems, including California, Florida, and New York, which lead adoption due to their large tourism bases and tech-savvy operators. Emerging growth is visible in regions like Texas and Colorado, supported by expanding domestic tourism and growing small-to-medium tour businesses. High internet penetration, advanced IT infrastructure, and strong demand for digital-first solutions reinforce the U.S. as a leading hub for software providers serving the global tour industry.
Access crucial information at unmatched prices!
Request your sample report today & start making informed decisions powered by Credence Research Inc.!
Download Sample
Market Insights:
- The U.S. Tour Operator Software Market size was valued at USD 253.6 million in 2018, projected at USD 326.3 million in 2024, and expected to reach USD 667.6 million by 2032, registering a CAGR of 9.36% during 2024–2032.
- California (28%), Florida (22%), and New York (18%) hold the top shares, driven by mature tourism industries, strong infrastructure, and high adoption of digital platforms.
- Texas (12%) is the fastest-growing region, supported by expanding domestic tourism, growing mid-sized operators, and increasing investment in digital travel solutions.
- Software accounts for 58% of the market share in 2024, supported by demand for scalable platforms, automation, and mobile-enabled booking systems.
- Services hold 42% of the 2024 share, reflecting the need for integration, maintenance, and customization among operators adopting advanced software solutions.
Market Drivers:
Growing Shift Toward Automation and Digital Booking Platforms:
The U.S. Tour Operator Software Market is experiencing rapid adoption driven by automation in booking and reservations. Operators use software to streamline itinerary creation, customer communication, and payment processes. Automation reduces manual errors, improves speed, and enhances overall operational efficiency. Cloud-based platforms provide flexibility, enabling operators to scale services based on demand. Customers prefer quick and seamless digital booking experiences, creating strong demand for user-friendly systems. It supports higher conversion rates and stronger client satisfaction. Operators gain competitive advantage by offering personalized services through automated workflows.
- For instance, Travefy’s newly launched CRM suite in 2025 has helped travel advisors save upwards of 200 hours annually by eliminating the need to switch between multiple tools for itineraries, invoicing, and communication, significantly improving workflow efficiency for over 30,000 travel agencies worldwide.
Rising Consumer Demand for Personalized Travel Experiences:
It is seeing growth from travelers’ desire for tailored experiences. Modern customers expect customization in itineraries, activity choices, and pricing options. Tour operators use data-driven insights to design packages that fit individual preferences. Artificial intelligence and machine learning features enhance personalization by analyzing customer behavior. Personalization improves loyalty and encourages repeat business, vital for operators in competitive markets. Operators integrate CRM tools with tour software to capture customer history and feedback. This integration allows fine-tuning of offerings for unique travel segments.
- For example, studies by Freshworks have shown that 44% of businesses report a productivity increase of 10–29%, while Salesforce has indicated sales productivity boosts of up to 34% with their CRM implementation.
Integration of Analytics and Customer Engagement Tools:
The market benefits from the integration of advanced analytics and CRM systems. Tour operators track performance, booking patterns, and customer preferences to optimize decision-making. Data-driven insights allow operators to refine pricing strategies and improve operational planning. Analytics supports forecasting demand and aligning inventory with customer expectations. It enhances customer engagement by personalizing communications and offers. CRM-linked features maintain stronger connections with clients before and after travel. These tools drive efficiency and profitability for businesses operating in diverse travel segments.
Expansion of Cloud-Based and Mobile-Accessible Solutions:
Tour operators in the U.S. are increasingly adopting cloud and mobile-ready platforms. Cloud deployment reduces infrastructure costs and ensures easy accessibility across devices. It empowers operators to manage operations remotely and offer real-time updates to customers. Mobile-first strategies improve traveler satisfaction by enabling bookings and itinerary checks on smartphones. Cloud scalability supports operators handling seasonal or sudden spikes in demand. Security features in cloud systems enhance trust among businesses and clients. The growing digital-native traveler base fuels demand for mobile-enabled solutions in this market.
Market Trends
Growth in Virtual Tours and Immersive Travel Experiences:
The U.S. Tour Operator Software Market is witnessing a trend toward virtual and immersive tours. Operators integrate augmented reality and virtual reality to engage potential customers. Virtual previews help travelers explore destinations before booking, influencing purchase decisions. It enhances transparency and builds customer confidence in selected packages. AR-driven itineraries allow interactive and engaging planning experiences. Tour operators differentiate themselves by adopting immersive technology for competitive positioning. This trend aligns with consumer interest in unique, tech-enhanced travel solutions.
- For instance, although detailed metrics are emerging, leading software providers have begun embedding AR/VR features that enable users to preview tours interactively with real-time feedback, enhancing engagement rates significantly.
Adoption of Sustainable and Eco-Friendly Tourism Features:
Sustainability is shaping product design and service delivery in this market. Operators integrate software features that highlight eco-friendly tours and green destinations. It supports travelers focused on responsible tourism choices. Software platforms help operators promote carbon-neutral options and report sustainability metrics. Tools also allow tracking of eco-certifications and compliance with regulations. Sustainability-focused offerings enhance brand image and appeal to eco-conscious customers. Growing consumer demand for ethical travel is driving operators to adapt rapidly.
- For instance, certain platforms now enable operators to report sustainability efforts through integrated dashboards tracking carbon footprints, which increase consumer trust and booking rates among eco-conscious travelers by measurable percentages.
Expansion of Multi-Channel Distribution and Direct Bookings
Operators are investing in platforms that support multi-channel distribution strategies. The U.S. Tour Operator Software Market benefits from integration with online travel agencies, social media, and websites. It allows operators to reach customers through multiple touchpoints effectively. Direct booking tools reduce reliance on intermediaries and increase profitability. Platforms manage dynamic pricing across channels, ensuring consistency and transparency. Tour operators optimize reach by connecting with younger, digital-first audiences. Multi-channel presence ensures competitive advantage in a crowded travel ecosystem.
Growing Focus on AI-Powered Customer Support and Chatbots
AI-driven chatbots are becoming standard in tour operator software solutions. These systems provide real-time support and respond to customer queries instantly. It helps reduce customer service costs while improving response speed. Chatbots handle booking confirmations, itinerary changes, and payment reminders seamlessly. Operators adopt AI to provide 24/7 customer assistance. Natural language processing enhances chatbot accuracy and personalization. AI tools improve overall user experience and encourage stronger trust in digital platforms.
Market Challenges Analysis:
Rising Competition and High Implementation Costs:
The U.S. Tour Operator Software Market faces challenges from intense competition among global and regional vendors. Operators must differentiate their services in a market flooded with digital platforms. It is difficult for small and mid-sized operators to keep up with advanced feature demands. High initial costs for licensing and integration discourage some businesses from adopting new software. Legacy system compatibility adds further complexity, slowing implementation timelines. Training staff on advanced platforms requires resources and time. Smaller operators risk losing competitiveness if they cannot afford modern solutions.
Cybersecurity Concerns and Data Privacy Regulations:
The growing use of digital platforms increases exposure to data risks. Tour operators handle sensitive information, including payment details and personal identities. It becomes critical to invest in strong cybersecurity frameworks. Compliance with data privacy regulations such as GDPR and U.S. state laws adds pressure. Failure to protect customer data can damage reputation and trust significantly. Smaller businesses struggle to maintain robust security due to resource limitations. Rising incidents of cyberattacks heighten concerns for both operators and clients. Addressing security and compliance remains an ongoing challenge in this market.
Market Opportunities:
Growing Role of AI and Predictive Technologies:
The U.S. Tour Operator Software Market is positioned to benefit from predictive analytics and AI adoption. Operators can forecast travel demand, optimize resource allocation, and tailor offers using advanced tools. It creates opportunities for software vendors to introduce intelligent modules that enhance decision-making. AI supports real-time itinerary updates and dynamic pricing. Predictive models help identify emerging destinations and traveler preferences. Vendors offering AI-driven personalization will gain a strong competitive edge.
Expanding Domestic Tourism and Small Business Adoption:
Domestic tourism growth offers significant opportunities for software providers. Small and mid-sized tour operators are increasingly adopting scalable platforms to manage operations. It encourages vendors to design affordable, easy-to-use solutions tailored for smaller enterprises. Cloud-based deployment enhances accessibility for operators in rural and niche markets. Growth in local travel experiences supports higher demand for specialized booking tools. Vendors focusing on affordability and regional customization will capture untapped market segments.
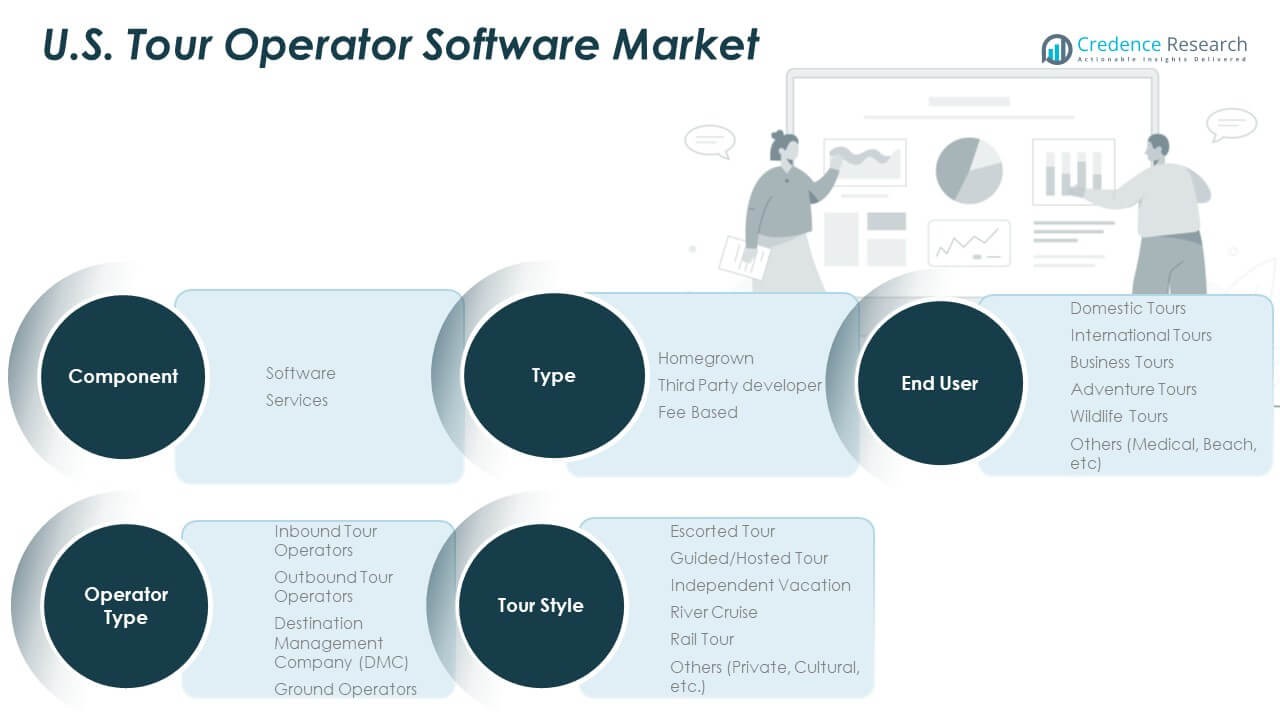
Market Segmentation Analysis:
By Type
The U.S. Tour Operator Software Market includes homegrown, third-party developer, and fee-based solutions. Homegrown platforms are used by large operators requiring full customization. Third-party developer software dominates due to scalability, integrations, and ready-made features. Fee-based models attract small and mid-sized operators with affordability and simplified deployment. It ensures availability of solutions tailored to diverse business sizes and needs.
- For instance, over 30,000 travel agencies globally use third-party solutions like Travefy, illustrating the scalability and adoption advantage of such platforms in serving diverse operator needs.
By Component
Software leads the market, driven by demand for automation, cloud scalability, and mobile-friendly platforms. Operators depend on software to streamline bookings, payments, and itinerary management. Services provide value through integration, training, and ongoing technical support. Providers combine software with service bundles to enhance adoption and customer retention. It highlights the importance of lifecycle management across the industry.
By Operator Type
Inbound and outbound operators represent key adopters, supported by destination management companies (DMCs) and ground operators. Inbound operators rely on digital platforms to attract domestic and international travellers. Outbound operators need multi-currency and multilingual capabilities for global markets. DMCs manage vendor coordination and complex itineraries through integrated tools. Ground operators enhance transportation, ticketing, and logistics management. It enables every operator type to align with traveller expectations.
By Tour Style and End User
Escorted and guided tours maintain strong demand, while independent vacations rise with self-service features. Niche categories such as river cruises, rail tours, and cultural packages expand through specialized offerings. Domestic tours dominate due to high U.S. traveller activity, while international tours benefit from global distribution links. Business, adventure, and wildlife tours attract specific customer groups needing tailored solutions. It demonstrates adaptability to mainstream and niche markets.
Segmentation:
By Type
- Homegrown
- Third Party Developer
- Fee Based
By Component
By Operator Type
- Inbound Tour Operators
- Outbound Tour Operators
- Destination Management Company (DMC)
- Ground Operators
By Tour Style
- Escorted Tour
- Guided/Hosted Tour
- Independent Vacation
- River Cruise
- Rail Tour
- Others (Private, Cultural, etc.)
By End User
- Domestic Tours
- International Tours
- Business Tours
- Adventure Tours
- Wildlife Tours
- Others
Regional Analysis:
Dominant Regional Hubs
The U.S. Tour Operator Software Market shows strong leadership from key states with developed tourism sectors and advanced technology adoption. California holds the largest share at 28%, driven by its large operator base, diverse attractions, and high digital adoption. Florida follows with 22%, supported by strong leisure travel demand, cruise tourism, and entertainment hubs. New York accounts for 18%, reflecting its strength in business travel, cultural tourism, and early adoption of booking platforms. These three regions collectively form the backbone of the market.
Fast-Growing and Expanding Regions
Texas emerges as the fastest-growing state with a 12% share, supported by expanding domestic travel, cultural attractions, and rising investments in software adoption. Colorado captures 8%, benefiting from its adventure and nature-based tourism market that attracts innovative operators. Nevada contributes 6%, driven by event-based tourism and strong demand for streamlined operations. It reflects how technology is increasingly critical in supporting high-volume tourist activity across these states.
Emerging Markets and Wider Spread
Other regions together represent 6% of the market, consisting of smaller states adapting digital platforms to niche tourism needs. These include wildlife tours, adventure travel, and local cultural experiences that demand customized solutions. It demonstrates the growing presence of software solutions beyond dominant hubs. Nationwide adoption ensures that vendors can target both well-established operators and emerging players. The spread highlights the potential for long-term expansion in states with rising tourism activity.
Shape Your Report to Specific Countries or Regions & Enjoy 30% Off!
Key Player Analysis:
- Travefy
- FareHarbor
- Rezdy
- Checkfront
- TrekkSoft
- Lemax
- Xola
- TRYTN
- Tourwriter
- CONTOUR
- DataTrax
- TRAVFLEX
- PEAK 15
Competitive Analysis:
The U.S. Tour Operator Software Market is highly competitive, shaped by global and regional players offering cloud-based, mobile-ready, and customizable platforms. Companies such as Travefy, FareHarbor, Rezdy, and Checkfront lead with advanced features, integrations, and scalability. It is marked by growing competition from emerging providers like Xola, TRYTN, and Tourwriter, which target niche segments with cost-effective solutions. Vendors compete on service quality, pricing models, user experience, and innovation, with AI integration and automation driving differentiation. Partnerships and product enhancements strengthen market positioning, while customer support and customization remain decisive factors for long-term adoption.
Recent Developments:
- In August 2025, Travefy announced a strategic partnership with Travel Planners International (TPI), one of the largest travel host agencies in the U.S. This partnership offers TPI’s more than 5,800 travel advisors’ access to Travefy’s full suite of tools, including the newly launched CRM, itinerary builder, and agent websites, at an exclusive discounted rate. Furthermore, integration with TPI’s internal back-office systems is planned to enable seamless syncing of client and trip data, streamlining workflows for advisors.
- In July 2025, Travefy launched an all-new fully integrated Customer Relationship Management (CRM) suite designed specifically for travel advisors. This suite includes professional invoicing, streamlined commission tracking, integrated email, and a revamped contact management system, allowing advisors to manage clients, trips, payments, and communication in one unified platform without switching between disconnected tools. This release was highlighted as a significant leap forward for travel advisors, representing Travefy’s commitment to addressing their daily challenges and success.
Report Coverage:
The research report offers an in-depth analysis based on type, component, operator type, tour style, and end-user segments. It details leading market players, providing an overview of their business, product offerings, investments, revenue streams, and key applications. Additionally, the report includes insights into the competitive environment, SWOT analysis, current market trends, as well as the primary drivers and constraints. Furthermore, it discusses various factors that have driven market expansion in recent years. The report also explores market dynamics, regulatory scenarios, and technological advancements that are shaping the industry. It assesses the impact of external factors and global economic changes on market growth. Lastly, it provides strategic recommendations for new entrants and established companies to navigate the complexities of the market.
Future Outlook:
- The U.S. Tour Operator Software Market will expand with rising demand for automated booking solutions.
- Cloud-based platforms will gain stronger adoption due to scalability and cost-efficiency.
- AI integration will support predictive insights and enhance personalization.
- Mobile-first design will strengthen customer engagement and operator efficiency.
- Partnerships between software providers and travel agencies will accelerate distribution.
- Data-driven insights will guide pricing strategies and improve profitability.
- Small and mid-sized operators will drive adoption of subscription-based solutions.
- Cybersecurity will remain a priority as digital transactions increase.
- Eco-friendly and sustainable travel modules will see higher integration.
- Emerging states beyond major hubs will offer new growth opportunities.


