
Market Overview
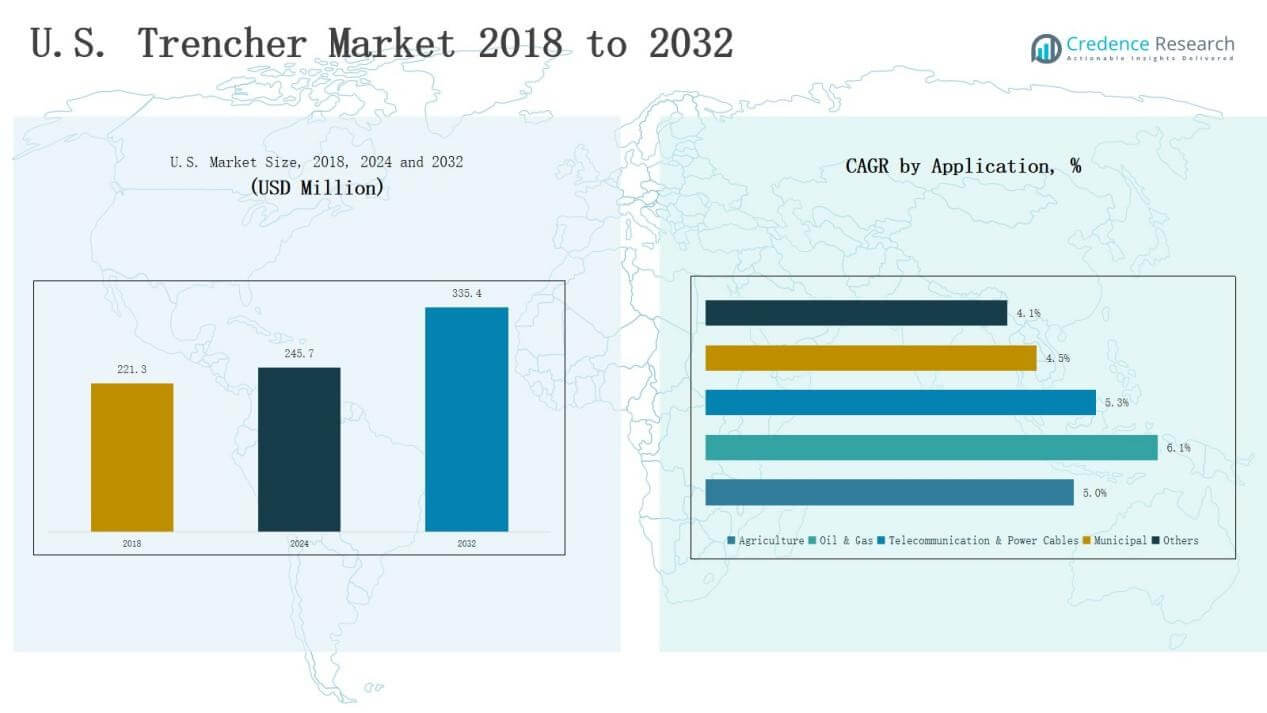
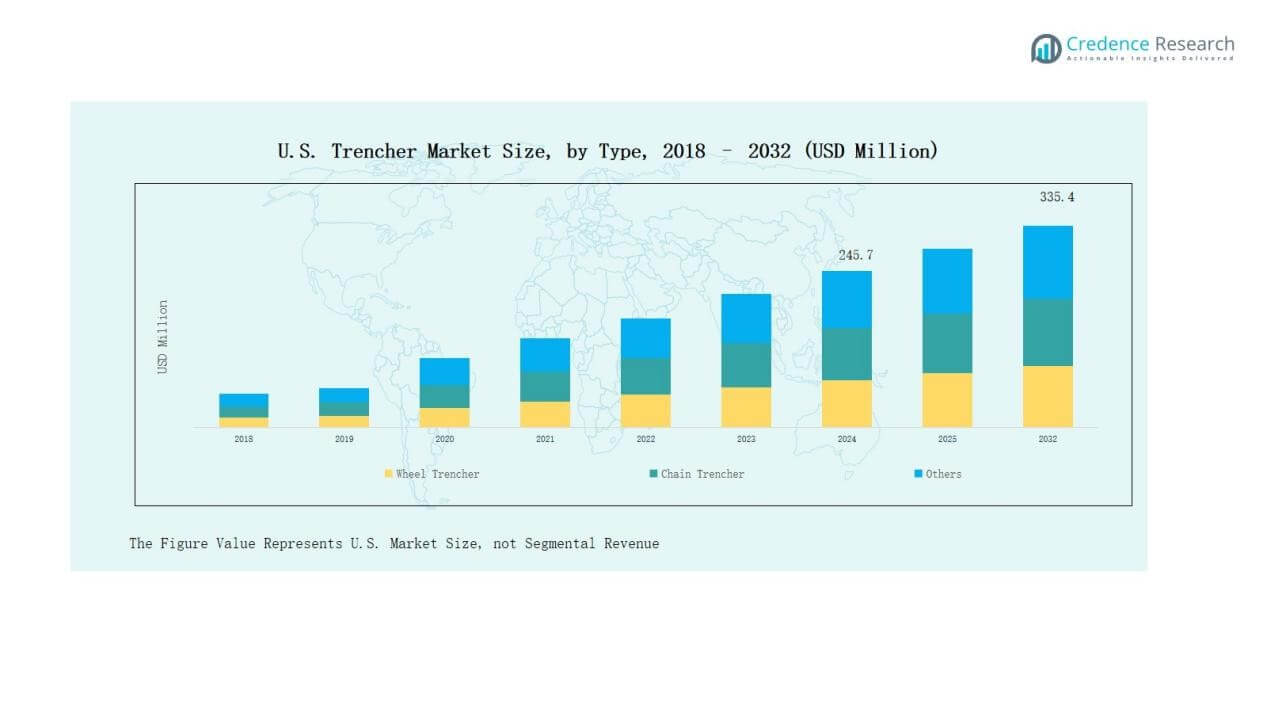
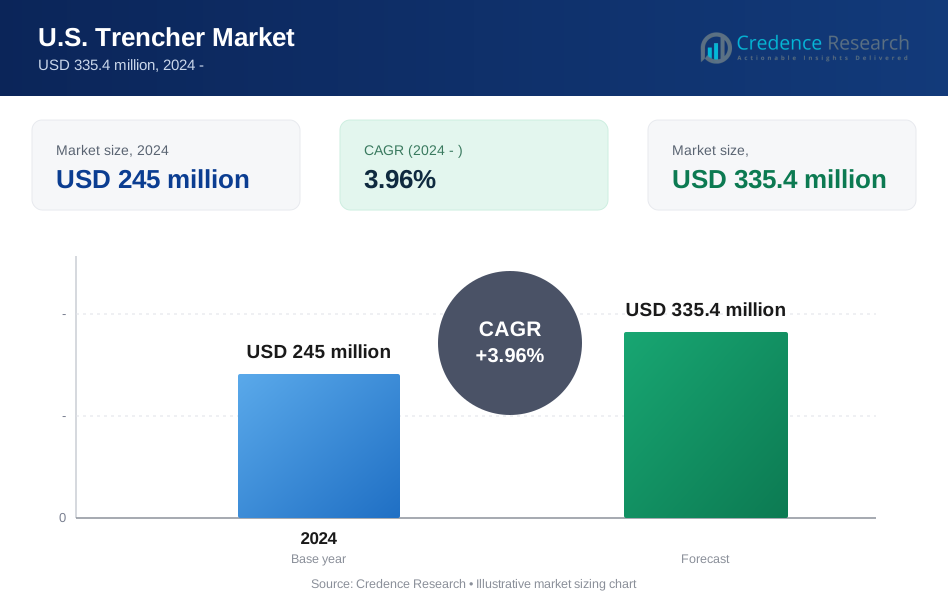
U.S. Trencher Market size was valued at USD 221.3 million in 2018 to USD 245.7 million in 2024 and is anticipated to reach USD 335.4 million by 2032, at a CAGR of 3.96% during the forecast period.
| REPORT ATTRIBUTE | DETAILS |
|---|---|
| Historical Period | 2020-2023 |
| Base Year | 2024 |
| Forecast Period | 2025-2032 |
| U.S. Trencher Market Size 2024 | USD 245.7 Million |
| U.S. Trencher Market, CAGR | 3.96% |
| U.S. Trencher Market Size 2032 | USD 335.4 Million |
The U.S. Trencher Market is shaped by global leaders and regional manufacturers that compete through technology, product range, and service support. Major players include Ditch Witch, Vermeer Corporation, Caterpillar Inc., Wolfe Heavy Equipment, Cleveland Trencher Company, EZ-Trench, Barreto Manufacturing, Bobcat Company, Port Industries, Erskine Attachments, Virnig Manufacturing, McLaren Industries, and Lowe Manufacturing. These companies focus on automation, eco-friendly trenching solutions, and strong dealer networks to strengthen their market position. Regionally, the South leads with a 33% share in 2024, supported by heavy investments in oil and gas pipelines, broadband expansion, municipal utilities, and large-scale agricultural mechanization. This dominance makes the South the most significant regional hub for trencher demand in the U.S.
Market Insights
- The U.S. Trencher Market grew from USD 221.3 million in 2018 to USD 245.7 million in 2024 and will reach USD 335.4 million by 2032 at a 96% CAGR.
- Leading players include Ditch Witch, Vermeer, Caterpillar, Wolfe Heavy Equipment, Cleveland Trencher, EZ-Trench, Barreto Manufacturing, Bobcat, Port Industries, Erskine Attachments, Virnig, McLaren Industries, and Lowe Manufacturing.
- Wheel trenchers held 52% share in 2024, driven by efficiency in excavation, roadwork, and utilities, while chain trenchers remain vital for oil, gas, and telecom.
- By application, telecommunication & power cables led with 36% share in 2024, supported by 5G rollout, broadband expansion, and power grid upgrades.
- Regionally, the South commanded 33% share in 2024, followed by the West at 27%, Midwest at 22%, and Northeast at 18%, with strong demand across infrastructure and agriculture.
Market Segment Insights
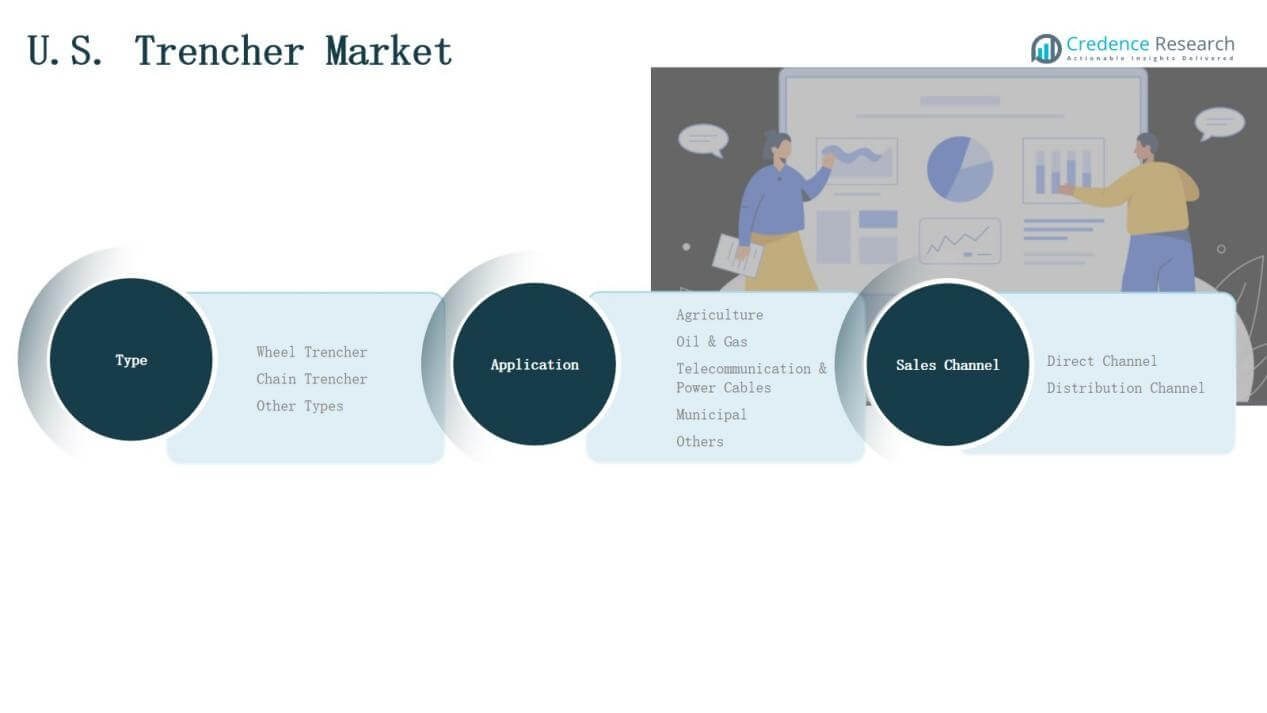
By Type
Wheel trenchers dominate the U.S. Trencher Market with a 52% share in 2024, supported by their efficiency in large-scale excavation, roadwork, and utility projects. Their ability to deliver precision cuts across varying soil conditions enhances adoption in both urban and rural applications. Chain trenchers follow with notable use in deep trenching for oil, gas, and telecom projects, while other types remain niche, serving specialized construction and landscaping needs.
- For instance, Tesmec’s 1150 EVO chain trencher has been utilized in shale gas exploration sites in Texas, where it enables deep, narrow cuts through hard rock for pipeline installation.
By Application
The Telecommunication & Power Cables segment leads with a 36% share in 2024, driven by rapid 5G expansion, broadband deployment, and power grid upgrades. Agriculture holds significant presence as farmers adopt trenchers for irrigation and drainage systems, contributing to mechanization trends. Oil & gas, municipal, and other applications continue to create steady demand through pipeline projects, urban infrastructure, and utility repairs.
- For instance, AT&T announced that by the end of 2023 it had added over 5 million new fiber locations for broadband expansion in the U.S., requiring extensive underground trenching for cable installation.
By Sales Channel
The Distribution Channel accounts for 61% of the market in 2024, supported by extensive dealer networks, after-sales service, and regional accessibility. Contractors and municipalities prefer distributors for equipment variety, financing options, and support. The direct channel holds the remaining share, favored by large buyers and government contracts that require customized equipment and direct manufacturer engagement.
Market Overview
Key Growth Drivers
Infrastructure Modernization Initiatives
The U.S. Trencher Market benefits from large-scale infrastructure upgrades, including roadways, water pipelines, and utility networks. Government funding for modernization projects increases demand for efficient trenching equipment. Wheel and chain trenchers support faster project execution, reducing time and labor costs. Rising urbanization and expanding smart city projects further stimulate the adoption of advanced trenchers. Contractors prioritize machines with automation features and eco-friendly performance to comply with environmental standards. Together, these drivers position trenchers as essential tools in meeting infrastructure renewal goals across urban and rural areas.
- For instance, Vermeer launched the RTX1250i2 ride-on trencher with the EcoIdle™ engine control system, which reduces fuel consumption and emissions during idle time, aligning with EPA Tier 4 Final standards.
Telecommunication and 5G Deployment
The rollout of 5G networks and expansion of broadband access are key market catalysts. Telecom providers rely on trenchers to lay extensive fiber optic cables, enabling faster and more reliable connectivity. The surge in data demand, coupled with federal and state-level funding for rural broadband, amplifies equipment sales. Compact trenchers that offer precision and cost efficiency see high adoption in both urban and suburban settings. This demand creates opportunities for manufacturers to design trenchers optimized for shallow and narrow trenching.
- For instance, Verizon announced in 2021 an additional $10 billion investment into its 5G Ultra Wideband expansion, which required accelerated underground fiber installation supported by specialized compact trenching equipment.
Agricultural Mechanization
Agriculture contributes significantly to trencher adoption, with mechanization trends transforming farming practices. Farmers use trenchers for installing irrigation, drainage systems, and underground piping, enhancing productivity and land management. Growing pressure on agricultural output due to population growth strengthens reliance on advanced equipment. U.S. policies supporting sustainable farming and efficient water management further encourage adoption. Trenchers tailored for compact and varied soil conditions are increasingly popular among medium and large-scale farms. This driver ensures steady demand beyond urban infrastructure and telecom-focused markets.
Key Trends & Opportunities
Adoption of Eco-Friendly and Automated Trenchers
Sustainability goals and stricter emission regulations are pushing manufacturers toward eco-friendly trenching solutions. Electric and hybrid trenchers reduce fuel use and emissions, aligning with state environmental mandates. Automation and GPS-guided systems increase precision, lower operational errors, and enhance worker safety. Contractors and municipalities view these technologies as long-term cost savers. Companies offering trenchers with advanced automation and compliance with EPA standards are positioned to gain stronger market share and competitive advantage in the evolving U.S. landscape.
- For instance, Caterpillar’s VisionLink® telematics platform provides real-time equipment health and productivity insights, which municipalities use to optimize fuel efficiency and reduce idle time in trenching operations.
Expanding Municipal Utility Projects
Municipal projects represent a growing opportunity as cities upgrade underground utility networks. Demand for trenchers rises with investments in water management, sewer maintenance, and renewable energy infrastructure. Local governments prioritize durable and efficient machines that minimize surface disruption during construction. Distributors and manufacturers that provide after-sales services and tailored municipal solutions stand to benefit. Smaller trenchers are increasingly adopted for narrow urban spaces, creating opportunities for specialized product lines. This segment’s consistent funding ensures long-term market growth potential for suppliers.
- For example, Ditch Witch offers its CX-Series walk-behind trenchers, which are specifically designed to be maneuverable in tight, congested urban jobsites to minimize disturbance during utility installations.
Key Challenges
High Equipment and Maintenance Costs
The U.S. Trencher Market faces constraints due to high upfront costs of advanced trenchers. Small contractors and farming communities often find ownership financially challenging. Maintenance and repair expenses add to the total cost of ownership, particularly for large wheel trenchers used in tough soil conditions. Financing options mitigate some of the burden, but adoption remains slow in cost-sensitive markets. Companies need to focus on rental models, trade-in schemes, and financing support to expand their customer base and address this challenge.
Labor Skill Shortages
Operating trenchers requires trained workers, but the U.S. construction industry continues to face labor shortages. Lack of skilled operators limits utilization and creates inefficiencies in project execution. The gap is more pronounced in rural areas and among smaller contractors. While automation and operator-assist features help, training programs remain crucial. Manufacturers and distributors must collaborate with training institutions to bridge this skill gap. Without addressing workforce issues, the market risks slower adoption of advanced and specialized trenching solutions.
Regulatory and Environmental Constraints
Strict regulations on emissions, noise, and land use impact trencher operations across U.S. states. Compliance with EPA standards increases production costs for manufacturers. Projects in urban and environmentally sensitive areas often face delays or require specialized equipment to minimize environmental impact. Municipalities and contractors increasingly demand trenchers with lower emissions and quieter operations. Manufacturers must invest heavily in R&D to align with these regulatory frameworks. Failure to comply risks reduced competitiveness and limited access to key public projects.
Regional Analysis
South
The South leads the U.S. Trencher Market with a 33% share in 2024, supported by rapid urban expansion and strong investments in 5G infrastructure. The region’s high demand for trenchers stems from oil and gas pipelines, municipal projects, and expanding power cable networks. Contractors in Texas and neighboring states increasingly adopt wheel trenchers for their efficiency in large-scale infrastructure works. Agricultural mechanization also contributes to steady adoption across rural zones. Strong dealer networks enhance market accessibility, while continued broadband funding secures the South’s dominant role in overall demand.
West
The West accounts for a 27% share in 2024, driven by renewable energy projects, extensive utility upgrades, and irrigation-focused agriculture. States like California prioritize sustainable construction practices, encouraging adoption of eco-friendly trenchers. The region faces high demand for compact trenchers suited to urban and suburban construction sites. Power cable installation projects linked to renewable grid integration further strengthen growth. Rising labor shortages challenge adoption, but automation-enabled equipment supports contractor efficiency. The West maintains strong potential through its ongoing infrastructure renewal programs and energy transition investments.
Midwest
The Midwest holds a 22% share in 2024, shaped by its agricultural strength and significant rural broadband expansion. Farmers rely on trenchers for irrigation and drainage, while telecom providers use them to connect underserved areas. Municipalities across Illinois and Ohio expand underground water and sewer networks, sustaining steady demand. Wheel trenchers dominate in road and pipeline construction, while compact chain trenchers support precision tasks. Dealer presence across the region ensures accessibility to both new and rental machines. The Midwest continues to grow steadily as infrastructure and farming mechanization expand.
Northeast
The Northeast captures an 18% share in 2024, supported by dense urban infrastructure projects and ongoing telecom cable installations. The region’s municipal authorities focus on upgrading underground utility networks, boosting demand for specialized trenchers. Compact and automated trenchers gain preference due to limited space in metropolitan areas. States such as New York and Massachusetts invest heavily in smart city initiatives, enhancing adoption of modern trenching solutions. Distribution networks in the Northeast provide strong service support for contractors. With its high concentration of urban projects, the Northeast secures a vital role in sustaining balanced market demand.
Market Segmentations:
By Type
- Wheel Trencher
- Chain Trencher
- Other Types
By Application
- Agriculture
- Oil & Gas
- Telecommunication & Power Cables
- Municipal
- Others
By Sales Channel
- Direct Channel
- Distribution Channel
By Region
- South
- West
- Midwest
- Northeast
Competitive Landscape
The U.S. Trencher Market features a competitive environment shaped by global manufacturers and strong regional players. Leading companies such as Ditch Witch, Vermeer Corporation, and Caterpillar Inc. maintain dominance through advanced product portfolios, extensive dealer networks, and strong after-sales services. Regional firms, including Wolfe Heavy Equipment, Cleveland Trencher Company, and EZ-Trench LLC, strengthen competitiveness by offering cost-effective models tailored for smaller contractors and specialized applications. Product innovation remains central, with companies focusing on automation, eco-friendly engines, and compact designs to meet regulatory standards and urban project needs. Strategic partnerships with telecom operators, municipal authorities, and agricultural stakeholders expand market presence. Distribution channels play a critical role, as dealers provide financing options, rental models, and localized service support that drive adoption. With growing demand from infrastructure, agriculture, and telecommunication projects, competition continues to intensify, pushing both multinational and domestic firms to invest in technology, sustainability, and customer-focused solutions.
Key Players
- Ditch Witch
- Vermeer Corporation
- Wolfe Heavy Equipment
- EZ-Trench, LLC
- Barreto Manufacturing, Inc.
- Cleveland Trencher Company, Inc.
- Port Industries, Inc.
- Bobcat Company
- Caterpillar Inc. (Cat)
- Erskine Attachments
- Virnig Manufacturing
- McLaren Industries
- Lowe Manufacturing
Recent Developments
- In February 2025, Barreto Manufacturing launched four new trencher products, including the 30RTK Track model, enhancing their product lineup with innovative features for trenching applications.
- In February 2025, Ditch Witch unveiled the c3E electric trencher—a compact, walk-behind model with instant torque, quiet operation, and the ability to trench up to 1,000 feet on a single charge.
- In 2025, Ditch Witch released the 410SX articulated‑steer vibratory drop plow. This machine installs lines like water, gas, or sprinklers without a traditional trench. It includes automatic blade centering and serves as both a plow and trencher.
Report Coverage
The research report offers an in-depth analysis based on Type, Application, Sales Channel and Region. It details leading market players, providing an overview of their business, product offerings, investments, revenue streams, and key applications. Additionally, the report includes insights into the competitive environment, SWOT analysis, current market trends, as well as the primary drivers and constraints. Furthermore, it discusses various factors that have driven market expansion in recent years. The report also explores market dynamics, regulatory scenarios, and technological advancements that are shaping the industry. It assesses the impact of external factors and global economic changes on market growth. Lastly, it provides strategic recommendations for new entrants and established companies to navigate the complexities of the market.
Future Outlook
- Demand for wheel trenchers will rise with large-scale infrastructure modernization projects.
- Telecom expansion and 5G rollout will drive strong adoption of compact trenchers.
- Municipal investments in underground utilities will sustain steady equipment demand.
- Agriculture will increasingly adopt trenchers for irrigation and drainage system installations.
- Eco-friendly and hybrid trenchers will gain preference due to stricter emission regulations.
- Automation and GPS-enabled features will become standard for precision and safety.
- Rental and leasing models will expand as contractors seek cost-effective ownership options.
- Regional players will focus on affordable and specialized trenchers for niche markets.
- Distribution networks will strengthen with financing support and after-sales services.
- Continued investments in renewable energy projects will increase trenching requirements for power cables.
Request a Free Sample
Fill in your details and we'll send you a free sample report.
- Sample data tables & charts
- Research methodology
Need a Custom Version of This Report?
Tailor the scope, geography, or segments to your exact requirements.
- Custom geography or segment scope
- Direct access to our analyst team
Frequently Asked Questions
What is the current market size for U.S. Trencher Market, and what is its projected size in 2032?
At what Compound Annual Growth Rate is the U.S. Trencher Market projected to grow between 2025 and 2032?
Which U.S. Trencher Market segment held the largest share in 2024?
What are the primary factors fueling the growth of the U.S. Trencher Market?
Who are the leading companies in the U.S. Trencher Market?
Which region commanded the largest share of the U.S. Trencher Market in 2024?
Table of Content
Chapter 1. Report Introduction
- 1.1 Report Description & Purpose
- 1.1.1 Report Title & Market Definition
- 1.1.2 Unique Selling Propositions (USP) & Key Differentiators
- 1.1.3 Value Proposition for Stakeholders
- 1.2 Research Objectives
- 1.2.1 Market Sizing Objectives (Volume & Revenue)
- 1.2.2 Segmentation Objectives
- 1.2.3 Competitive Intelligence Objectives
- 1.2.4 Forecast & Scenario Objectives
- 1.3 Report Scope
- 1.3.1 U.S. Trencher Scope – Types & Subtypes Covered
- 1.3.2 Geographic Scope – Regions & Countries Covered
- 1.3.3 Historical Period, Base Year & Forecast Period (2024; forecast to the forecast period)
- 1.3.4 Inclusions & Exclusions
- 1.4 HS Code & Classification Framework
- 1.5 Currency, Units & Pricing Basis
- 1.6 Target Stakeholders
- 1.7 Limitations & Assumptions
Chapter 2. Executive Summary
- 2.1 Global U.S. Trencher Market Snapshot
- 2.1.1 Market Size – Historical (2024) & Forecast (the forecast period) (2024: USD 245 million → forecast year: USD 335.4 million)
- 2.1.2 Volume & Revenue – Global Totals
- 2.1.3 Key Market Highlights – Top Five Facts
- 2.2 U.S. Trencher Market Segmentation Snapshot
- 2.2.1 Market Split by Region – 2024 vs.
- 2.3 Competitive Snapshot
- 2.3.1 Top 10 Players by Revenue Share – 2024
- 2.3.2 Top 10 Players by Volume Share – 2024
- 2.3.3 Recent Strategic Developments (18-Month Summary)
- 2.4 Key Investment Highlights & Strategic Conclusions
Chapter 3. U.S. Trencher Market Dynamics & Industry Analysis
- 3.1 Market Overview & Context
- 3.1.1 U.S. Trencher Market Position in the Broader Automotive Value Chain
- 3.1.2 OEM vs. Replacement Market Dynamics
- 3.1.3 Market Maturity & Development Stage by Region
- 3.2 U.S. Trencher Market Drivers
- 3.3 U.S. Trencher Market Restraints & Challenges
- 3.4 U.S. Trencher Market Opportunities
- 3.5 Porter's Five Forces Analysis
- 3.5.1 Threat of New Entrants
- 3.5.2 Bargaining Power of Suppliers
- 3.5.3 Bargaining Power of Buyers
- 3.5.4 Threat of Substitutes
- 3.5.5 Competitive Rivalry – Intensity Assessment
- 3.6 U.S. Trencher Value Chain Analysis
- 3.6.1 Upstream – Raw Material/Input Suppliers
- 3.6.1.1 Raw Material/Input 1
- 3.6.1.2 Raw Material/Input 2
- 3.6.1.3 Raw Material/Input 3
- 3.6.2 Midstream – Production/Manufacturing/Service Delivery
- 3.6.2.1 Production/Process Overview
- 3.6.2.2 Key Facility Locations & Capacity by Manufacturer
- 3.6.3 Downstream – Distribution & End Consumer
- 3.6.3.1 Primary Channel – B2B/OEM
- 3.6.3.2 Secondary Channels – Dealer, Retail, Online, Direct
- 3.6.4 Value Chain Profitability Analysis
- 3.6.1 Upstream – Raw Material/Input Suppliers
- 3.7 PESTEL Analysis
- 3.7.1 Political Factors
- 3.7.2 Economic Factors
- 3.7.3 Social Factors
- 3.7.4 Technological Factors
- 3.7.5 Environmental Factors
- 3.7.6 Legal Factors
- 3.8 U.S. Trencher Supply Chain Analysis
- 3.8.1 Raw Material/Input Supply Risk Assessment
- 3.8.2 Manufacturing Concentration Risk (Geographic Exposure)
- 3.8.3 Trade Disruption Impact Analysis
- 3.9 Regulatory & Policy Landscape
Note: The regulatory and policy landscape section covers regulations based on their applicability to the market, U.S. Trencher category, geography, and scope of the study. Only regulatory frameworks with a material impact on operations, compliance, trade, sustainability, or market access are analyzed in detail.
Chapter 4. Key Investment Pockets & Opportunity Analysis
- 4.1 U.S. Trencher Market Attractiveness Analysis
- 4.1.1 By Region – Investment Attractiveness Matrix (Volume × CAGR)
- 4.2 Absolute Revenue Growth Opportunity
- 4.2.1 By Region – Absolute USD Growth Through the forecast period
- 4.3 Incremental Volume Opportunity
- 4.3.1 By Region – Incremental Volume Through the forecast period
- 4.3.2 Segment – Incremental Volume
- 4.4 Emerging Submarket Opportunity Deep Dive (Subject to Applicability)
- 4.5 Emerging Market Opportunity Scorecards
- 4.5.1 United States
- 4.5.2 Europe
- 4.5.3 Asia
- 4.5.4 Middle East & Africa
Note: Emerging Market Opportunity Scorecards will be included based on relevance and strategic importance. Regions listed are indicative and may vary depending on data availability and market dynamics.
Chapter 5. U.S. Trencher Import-Export Analysis & Trade Flows
- 5.1 Global Trade Overview
- 5.1.1 Global Export Value by Country (2024)
- 5.1.2 Global Export Volume by Country (2024)
- 5.1.3 Global Import Value by Country (2024)
- 5.1.4 Global Import Volume by Country (2024)
- 5.1.5 Net Trade Balance by Country (2024)
- 5.2 Export Analysis – Segment
- 5.2.1 Type 1 (HS Code)
- 5.2.2 Type 2 (HS Code)
- 5.2.3 Type 3 (HS Code)
- 5.2.4 Type 4 (HS Code)
- 5.2.5 Type 5 (HS Code)
- 5.3 Import Analysis – Segment
- 5.3.1 Type 1 (HS Code)
- 5.3.2 Type 2 (HS Code)
- 5.3.3 Type 3 (HS Code)
- 5.3.4 Type 4 (HS Code)
- 5.3.5 Type 5 (HS Code)
- 5.4 Average Unit Trade Prices
- 5.4.1 Average Export Price – Segment & Country
- 5.4.2 Average Import Price – Segment & Source Country
- 5.4.3 Price Trends (2024)
- 5.5 Key Trade Route Analysis
- 5.5.1 Trade Route 1
- 5.5.2 Trade Route 2
- 5.5.3 Trade Route 3
- 5.5.4 Trade Route 4
- 5.5.5 Trade Route 5
- 5.6 Trade Policy Impact Assessment
- 5.6.1 US Anti-Dumping & Section 301 Tariffs
- 5.6.2 EU Customs Union Impact
- 5.6.3 Major Free Trade Agreements
- 5.6.4 USMCA Rules of Origin
Note: Trade policy analysis will be included only where relevant to the U.S. Trencher market.
Chapter 6. Competitive Landscape & Company Benchmarking
- 6.1 U.S. Trencher Market Concentration & Structure
- 6.1.1 Herfindahl-Hirschman Index (HHI) – vs. 2024
- 6.1.2 Tier 1, Tier 2 & Tier 3 Market Structure
- 6.1.3 Global, Regional & Local Player Dynamics
- 6.2 U.S. Trencher Market Share Analysis – 2024
- 6.2.1 Global Revenue Share by Company
- 6.2.2 Global Volume Share by Company
- 6.2.3 Regional Revenue Share
- 6.2.4 Market Share Evolution ( vs. 2024)
- 6.2.5 OEM Segment Share by Company
- 6.2.6 Replacement Segment Share by Company
- 6.3 Production/Delivery Capacity & Facility Analysis
- 6.3.1 Global Installed Capacity
- 6.3.2 Capacity Utilization Rates
- 6.3.3 Production/Output Volume
- 6.3.4 Facility Locations & Capacity Map
- 6.3.5 Planned Capacity Additions
- 6.4 U.S. Trencher Competitive Benchmarking Matrix
- 6.4.1 Revenue, Volume, CAGR & Profitability Comparison
- 6.4.2 Channel Revenue Mix
- 6.4.3 Geographic Revenue Exposure
- 6.4.4 R&D Intensity
- 6.4.5 Sustainability Maturity
- 6.5 Strategic Developments in U.S. Trencher (Last 24 Months)
- 6.5.1 Mergers, Acquisitions & Divestments
- 6.5.2 New U.S. Trencher Launches
- 6.5.3 Facility Expansions
- 6.5.4 Strategic Alliances, Joint Ventures & Partnerships
- 6.5.5 Distribution Expansion & Market Entry
- 6.5.6 Sustainability & ESG Initiatives
- 6.6 Competitive Strategy Mapping
- 6.6.1 Leader, Challenger, Follower & Niche Classification
- 6.6.2 Pricing Strategy Comparison
- 6.6.3 Channel Strategy Matrix
Note: Strategic developments are included based on their materiality and the availability of reliable information.
Chapter 7. Global U.S. Trencher Market – By Distribution Channel
- 7.1 Segment Overview
- 7.1.1 Volume & Revenue Split by Channel (2024 & )
- 7.1.2 Channel Mix Evolution (the forecast period)
Chapter 8. Regional Market Analysis – Global Overview
- 8.1 Global Regional Overview
- 8.1.1 Regional Volume Share
- 8.1.2 Regional Revenue Share
- 8.1.3 Regional Volume by Region
- 8.1.4 Regional Revenue by Region
- 8.1.5 Regional Forecast Through the forecast period
- 8.2 Cross-Regional Segment Analysis
- 8.2.1 By Distribution Channel
- 8.2.2 By Brand/Price Tier
Chapter 9. North America U.S. Trencher Market
- 9.1 United States
- 9.2 Canada
- 9.3 Mexico
Chapter 10. Europe U.S. Trencher Market
- 10.1 Germany
- 10.2 France
- 10.3 Italy
- 10.4 United Kingdom
- 10.5 Spain
- 10.6 Poland
- 10.7 Russia
- 10.8 Netherlands
- 10.9 Belgium
- 10.10 Sweden
- 10.11 Denmark
- 10.12 Norway
- 10.13 Rest of Europe
Chapter 11. Asia Pacific U.S. Trencher Market
- 11.1 China
- 11.2 India
- 11.3 Japan
- 11.4 South Korea
- 11.5 Thailand
- 11.6 Indonesia
- 11.7 Vietnam
- 11.8 Malaysia
- 11.9 Australia
- 11.10 Rest of Asia Pacific
Chapter 12. Latin America U.S. Trencher Market
- 12.1 Brazil
- 12.2 Argentina
- 12.3 Colombia
- 12.4 Chile
- 12.5 Rest of Latin America
Chapter 13. Middle East U.S. Trencher Market
- 13.1 Saudi Arabia
- 13.2 United Arab Emirates
- 13.3 Turkey
- 13.4 Israel
- 13.5 Iran
- 13.6 Rest of the Middle East
Chapter 14. Africa U.S. Trencher Market
- 14.1 South Africa
- 14.2 Egypt
- 14.3 Nigeria
- 14.4 Morocco
- 14.5 Rest of Africa
Chapter 15. U.S. Trencher Company Profiles
- 15.1 [Company 01]
- 15.1.1 Company Overview
- 15.1.2 Key Management Personnel
- 15.1.3 Products & Services Portfolio
- 15.1.4 Financial Performance
- 15.1.5 Key Market Focus & Geographic Presence
- 15.1.6 Recent Developments & Strategic Initiatives
Note: The company profile list is preliminary and may change based on research findings, market developments, data availability, and client requirements.
Chapter 16. Appendices
- Appendix A – List of Abbreviations & Acronyms
- Appendix B – Industry Classification Code Reference – Full Series
- Appendix C – Production & Capacity Data Tables
- Appendix D – End-Use & Demand Base Tables
- Appendix E – Consumption & Replacement Rate Assumptions
- Appendix F – ASP Reference Tables
- Appendix G – Manufacturing & Facility Database
- Appendix H – Import-Export Data Tables
- Appendix I – Regulatory Summary Tables
- Appendix J – Primary Research Participant List (Anonymized)
- Appendix K – Primary Research Questionnaire Framework
- Appendix L – Data Sources & Bibliography
- Appendix M – Market Size Divergence & Source Comparison
Chapter 17. Research Methodology
- 17.1 Research Framework & Philosophy
- 17.2 Secondary Research – Sources, Hierarchy & Data Extraction
- 17.3 Data Modeling – Bottom-Up & Top-Down Market Sizing
- 17.4 Primary Research – Stakeholder Framework, LOI & Sample Sizes
- 17.5 Forecast Methodology – Regression, Scenario & Sensitivity Analysis
- 17.6 Quality Control – Four-Layer Validation Framework
- 17.7 Limitations & Standard Assumptions
- 17.8 Disclaimer
