Market Overview
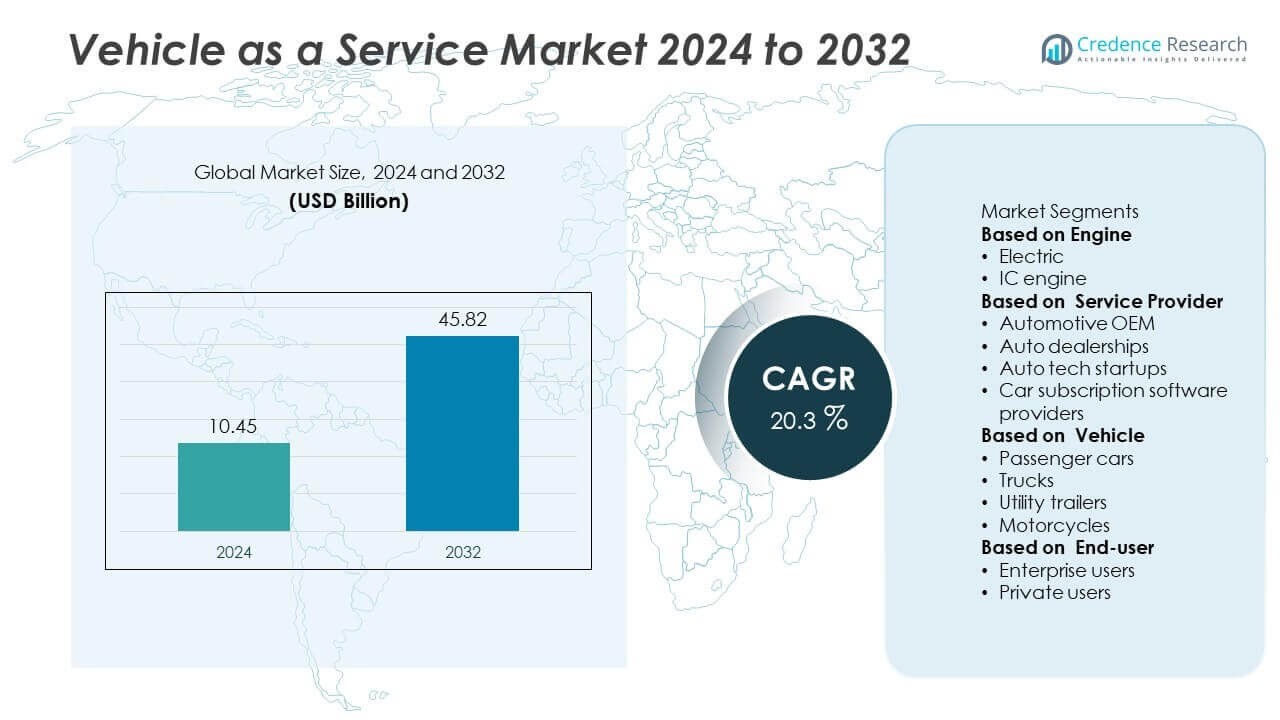
The Vehicle As A Service Market was valued at USD 10.45 billion in 2024 and is projected to reach USD 45.82 billion by 2032, growing at a CAGR of 20.3% during the forecast period.
| REPORT ATTRIBUTE | DETAILS |
|---|---|
| Historical Period | 2020-2023 |
| Base Year | 2024 |
| Forecast Period | 2025-2032 |
| Vehicle As A Service Market Size 2024 | USD 10.45 Billion |
| Vehicle As A Service Market, CAGR | 20.3% |
| Vehicle As A Service Market Size 2032 | USD 45.82 Billion |
The vehicle as a service market is led by major players including Flexdrive (Lyft), Porsche AG, CarNext B.V., Hertz Corporation, Drover Ltd. (Cazoo), Daimler AG (Mercedes-Benz Group), General Motors Company, Cluno GmbH, Borrow (Prazo, Inc.), and Bavarian Motor Work AG (BMW Group). These companies are expanding subscription models, flexible leasing, and on-demand mobility solutions to meet rising consumer demand for access-based vehicle usage. North America dominated the market with 36% share in 2024, driven by strong adoption of subscription services and digital mobility platforms. Europe accounted for 30% share, supported by emission regulations and EV integration, while Asia-Pacific captured 26% share, fueled by rapid urbanization, app-based mobility growth, and government incentives for shared and electric vehicles.
 Market Insights
- The vehicle as a service market was valued at USD 10.45 billion in 2024 and is projected to reach USD 45.82 billion by 2032, growing at a CAGR of 20.3% during the forecast period.
- Rising demand for flexible mobility solutions, EV adoption, and subscription-based models is driving strong market growth, supported by urbanization and cost-conscious consumers.
- Key trends include integration of connected vehicle technology, AI-driven fleet management, and expansion of corporate subscription programs to optimize fleet operations and reduce emissions.
- The market is competitive with players like Flexdrive (Lyft), Porsche AG, CarNext B.V., Hertz Corporation, and Daimler AG focusing on digital platforms, fleet electrification, and bundled subscription services to gain market share.
- North America led with 36% share, followed by Europe with 30% and Asia-Pacific with 26%; by vehicle type, passenger cars dominated with over 60% share, reflecting high demand for urban mobility and personal subscription services.
Market Segmentation Analysis:
By Engine
Electric vehicles dominated the Vehicle as a Service (VaaS) market in 2024, holding over 55% share as consumers and businesses increasingly shift toward sustainable mobility solutions. Growth is fueled by supportive government policies, EV incentives, and stricter emission regulations driving fleet electrification. Subscription services featuring EVs are becoming popular due to lower maintenance costs and access to charging infrastructure. IC engine vehicles still contribute significantly, especially in markets with slower EV adoption, but the ongoing transition toward clean transportation will continue to favor electric-powered offerings in shared and subscription-based mobility models.
- For instance, in 2024, Tesla's Full Self-Driving (Supervised) software subscription, active on an unquantified number of owner-operated electric vehicles, was enhanced with AI improvements based on billions of miles of real-world driving data.
By Service Provider
Automotive OEMs accounted for more than 45% share of the VaaS market in 2024, leveraging their established manufacturing capabilities and brand trust to offer subscription and leasing models directly to customers. OEM-led services ensure high-quality maintenance, latest model access, and bundled insurance, which attract corporate and retail users. Auto tech startups are rapidly expanding, introducing flexible, app-based platforms that cater to younger demographics seeking convenience. Car subscription software providers and dealerships are increasingly partnering with OEMs and startups to expand service reach and enhance customer engagement across key urban markets.
- For instance, in 2024, Ford expanded its offerings with Ford Pro Intelligence subscriptions for commercial customers, leveraging its OEM manufacturing and dealer network to provide tailored solutions for fleet management. Its consumer-facing subscriptions for technology like the BlueCruise hands-free driving system also grew, especially after Ford reduced the monthly and annual subscription costs in October 2024.
By Vehicle
Passenger cars held the largest share, exceeding 60% of the VaaS market in 2024, supported by rising demand for flexible mobility solutions in urban areas. Consumers are opting for car subscriptions and rentals as cost-effective alternatives to ownership, driven by rising vehicle prices and maintenance costs. Trucks and utility trailers are seeing steady growth as logistics companies adopt pay-per-use models to optimize fleet costs. Motorcycles are gaining traction in emerging markets for last-mile delivery and personal mobility, making this segment a growing contributor to overall market demand in the coming years.
Key Growth Drivers
Shift Toward Flexible Mobility Solutions
Consumers are increasingly preferring access over ownership, driving demand for subscription-based and on-demand vehicle services. Rising vehicle prices, maintenance costs, and urban congestion make VaaS an attractive alternative. Businesses also benefit from flexible fleet solutions that reduce capital expenditure and optimize utilization. This shift is especially strong in metropolitan areas where shared mobility and last-mile solutions are essential. The appeal of switching vehicles frequently, accessing the latest models, and having bundled services like insurance and maintenance supports the rapid adoption of VaaS across multiple user segments.
- For instance, in 2024, Sixt SE continued to expand its SIXT+ vehicle subscription service, a product available through its integrated digital platforms. The company grew its fleet and network globally, including meeting a medium-term goal of being present at 50 of the top U.S. airports. The SIXT+ service offers flexible plans that include features such as integrated maintenance, with the ability to switch vehicles after a minimum term.
Rising Adoption of Electric and Connected Vehicles
Electrification is a key driver of the VaaS market, as electric vehicles offer lower operating costs and align with global decarbonization goals. Subscription services with EV fleets attract eco-conscious customers and businesses targeting sustainability targets. Connected vehicle technology enhances service models by enabling real-time tracking, predictive maintenance, and seamless user experiences. OEMs and mobility providers are leveraging telematics and IoT platforms to improve vehicle uptime and customer satisfaction, making EV-based VaaS solutions highly scalable and efficient for both personal and commercial applications.
- For instance, in 2024, Mercedes-Benz Mobility continued to offer and refine its electric vehicle subscription offerings in several markets, leveraging connected car technology to develop future services, despite experiencing a market-wide slowdown in new business and profitability.
Supportive Government Policies and Urban Initiatives
Governments worldwide are encouraging shared mobility and low-emission transport solutions through subsidies, tax incentives, and infrastructure development. Urban initiatives promoting car-sharing, congestion reduction, and improved public transport integration are boosting demand for VaaS offerings. Policy measures favoring fleet electrification and stricter emission norms are pushing service providers to adopt cleaner technologies. Public-private partnerships in smart city projects are integrating vehicle subscription and on-demand fleets into urban mobility ecosystems, further accelerating the growth and acceptance of VaaS among both consumers and businesses.
Key Trends & Opportunities
Integration of AI and Predictive Analytics
AI-driven platforms are enhancing the efficiency of VaaS models by optimizing fleet allocation, predicting maintenance schedules, and personalizing customer offerings. Predictive analytics enables providers to lower downtime, reduce operational costs, and improve customer experience through tailored vehicle options. This trend creates opportunities for data-driven solutions and partnerships between mobility providers and tech companies. AI integration also helps providers adjust pricing dynamically based on demand patterns, increasing profitability while offering consumers more flexible, cost-effective plans.
- For instance, Geotab's AI-powered fleet management platform processes over 100 billion data points daily from millions of connected vehicles, and its predictive maintenance tools help customers achieve substantial reductions in fleet downtime and improved asset utilization.
Growth of Commercial and Corporate Subscriptions
Enterprises are increasingly adopting vehicle subscription models to manage fleets for sales teams, logistics, and shared employee mobility. Corporate subscriptions provide cost transparency, easy scalability, and access to EVs for achieving ESG goals. Providers are launching B2B-focused packages with value-added services such as telematics integration, driver behavior monitoring, and fleet analytics. This segment offers significant opportunities, particularly in emerging markets where businesses seek flexible alternatives to long-term leasing or ownership for optimizing operational efficiency and reducing capital investment.
- For instance, a commercial fleet operator, leveraging analytics to improve fuel efficiency and reduce accidents. Multiple telematics providers and industry reports confirm that such technology, which monitors driver behavior like idling and harsh braking, can lead to measurable improvements in fuel consumption and accident rates.
Key Challenges
High Operational and Infrastructure Costs
VaaS providers face high initial investments for fleet acquisition, charging infrastructure, and technology integration. Maintenance, insurance, and depreciation costs add pressure to margins, especially in markets with price-sensitive customers. Scaling operations while ensuring profitability remains a challenge, leading many providers to seek partnerships with OEMs or financiers. Cost optimization and fleet utilization efficiency are critical to achieving long-term sustainability and competitiveness in the market.
Regulatory and Liability Complexities
Managing compliance with diverse regional regulations on insurance, taxation, and data privacy is a significant hurdle. Liability issues related to accidents, damages, and misuse of shared vehicles can increase operational risks for providers. Variations in local rules can complicate fleet deployment and service expansion strategies. Companies must invest in strong legal frameworks, robust insurance coverage, and transparent user agreements to build trust and reduce exposure to regulatory and legal challenges while scaling across multiple regions.
Regional Analysis
North America
North America held 36% share of the vehicle as a service market in 2024, driven by strong adoption of subscription-based and on-demand mobility solutions. The U.S. leads the region due to high consumer acceptance of flexible vehicle ownership models, advanced digital infrastructure, and the presence of leading OEMs and mobility service providers. Growth is further supported by the rapid expansion of electric vehicle fleets and partnerships between automakers and tech startups. Canada is contributing steadily, supported by urban mobility initiatives and government incentives for EV adoption, making North America a mature and lucrative market for VaaS players.
Europe
Europe accounted for 30% share in 2024, supported by stringent emission regulations and growing demand for sustainable mobility options. Countries such as Germany, France, and the UK are leading markets due to the popularity of car subscription services and corporate fleet leasing programs. The European Union’s push for carbon neutrality and expansion of EV charging infrastructure is accelerating adoption of electric vehicle-based VaaS solutions. Strong consumer preference for flexible ownership models and the presence of innovative mobility startups are creating a robust ecosystem, driving steady growth across passenger and commercial vehicle segments in the region.
Asia-Pacific
Asia-Pacific captured 26% share of the global vehicle as a service market in 2024, making it one of the fastest-growing regions. China, Japan, and India are key contributors, with rising urbanization, increasing disposable incomes, and growing adoption of digital mobility platforms. Government initiatives promoting EV adoption and shared mobility services are boosting market penetration. The popularity of app-based vehicle subscriptions and on-demand rentals is rising among younger consumers. Expanding ride-hailing and delivery industries are also driving demand for fleet-based VaaS models, positioning Asia-Pacific as a high-potential region for future market expansion and innovation.
Latin America
Latin America held 5% share of the vehicle as a service market in 2024, led by Brazil and Mexico. Increasing demand for cost-effective mobility solutions and rising penetration of digital platforms are driving adoption. Vehicle subscription services are gaining traction among urban consumers seeking alternatives to traditional ownership. Government programs supporting fleet electrification and partnerships with international mobility providers are further supporting growth. Economic recovery and growing e-commerce activity are boosting demand for flexible commercial fleets, creating opportunities for VaaS providers to expand their presence and introduce new service models tailored to the region’s needs.
Middle East & Africa
The Middle East & Africa region accounted for 3% share in 2024, supported by increasing investments in smart city projects and sustainable transportation initiatives. The UAE and Saudi Arabia are at the forefront, offering strong infrastructure for mobility-as-a-service platforms, including EV subscriptions and connected vehicle solutions. Africa is witnessing gradual adoption, led by South Africa and Nigeria, where rising urban population and growing app-based mobility solutions are creating demand. High vehicle costs and limited public transport infrastructure are encouraging users to explore flexible access models, presenting significant long-term opportunities for VaaS providers in this emerging market.
Market Segmentations:
By Engine
- Electric
- IC engine
By Service Provider
- Automotive OEM
- Auto dealerships
- Auto tech startups
- Car subscription software providers
By Vehicle
- Passenger cars
- Trucks
- Utility trailers
- Motorcycles
By End-user
- Enterprise users
- Private users
By Geography
- North America
- U.S.
- Canada
- Mexico
- Europe
- Germany
- France
- U.K.
- Italy
- Spain
- Rest of Europe
- Asia Pacific
- China
- Japan
- India
- South Korea
- South-east Asia
- Rest of Asia Pacific
- Latin America
- Brazil
- Argentina
- Rest of Latin America
- Middle East & Africa
- GCC Countries
- South Africa
- Rest of the Middle East and Africa
Competitive Landscape
The competitive landscape of the vehicle as a service market is defined by key players such as Flexdrive (Lyft), Porsche AG, CarNext B.V., Hertz Corporation, Drover Ltd. (Cazoo), Daimler AG (Mercedes-Benz Group), General Motors Company, Cluno GmbH, Borrow (Prazo, Inc.), and Bavarian Motor Work AG (BMW Group). These companies focus on expanding their subscription and on-demand mobility portfolios, offering flexible vehicle access options for both retail and corporate users. Strategic initiatives include partnerships with technology providers, fleet electrification, and integration of digital platforms to enhance user experience. Many players are launching tiered subscription models and bundled services including insurance, maintenance, and roadside assistance to attract wider customer segments. Investments in telematics and connected vehicle solutions are enabling real-time tracking and predictive maintenance, improving operational efficiency. The market remains highly competitive, with innovation, cost optimization, and scalability serving as key differentiators for long-term success.
Key Player Analysis
- Flexdrive (Lyft)
- Porsche AG
- CarNext B.V.
- Hertz Corporation
- Drover Ltd. (Cazoo)
- Daimler AG (Mercedes-Benz Group)
- General Motors Company
- Cluno GmbH
- Borrow (Prazo, Inc.)
- Bavarian Motor Work AG (BMW Group)
Recent Developments
- In September 2025, Lyft (via its Flexdrive unit) will manage fleet operations & maintenance of Waymo’s robotaxi service in Nashville.
- In September 2025, Porsche approved adjustments to its product portfolio under its larger realignment plan.
- In September 2025, Lyft and May Mobility launched a robotaxi pilot in Atlanta, accessible through the Lyft app.
- In August 2025, Porsche refocused its battery strategy (cells & systems), affecting its EV portfolio.
Report Coverage
The research report offers an in-depth analysis based on Engine, Service Provider, Vehicle, End-user and Geography. It details leading market players, providing an overview of their business, product offerings, investments, revenue streams, and key applications. Additionally, the report includes insights into the competitive environment, SWOT analysis, current market trends, as well as the primary drivers and constraints. Furthermore, it discusses various factors that have driven market expansion in recent years. The report also explores market dynamics, regulatory scenarios, and technological advancements that are shaping the industry. It assesses the impact of external factors and global economic changes on market growth. Lastly, it provides strategic recommendations for new entrants and established companies to navigate the complexities of the market.
Future Outlook
- Vehicle subscription models will see rapid adoption as consumers seek flexibility over ownership.
- Electric vehicle fleets will expand, supported by government incentives and corporate sustainability goals.
- OEMs will strengthen direct-to-consumer platforms to capture recurring subscription revenues.
- AI and telematics will improve fleet efficiency, predictive maintenance, and customer personalization.
- Urban areas will witness higher demand driven by congestion, parking limitations, and rising living costs.
- Corporate fleet subscriptions will grow as businesses optimize costs and meet ESG targets.
- Partnerships between automakers, tech startups, and mobility platforms will increase service reach.
- Tiered and customizable subscription plans will attract a wider customer base.
- Regulatory support for shared and low-emission mobility will accelerate market expansion.
- Emerging markets will experience significant growth with rising digital adoption and mobility infrastructure development.

Request a Free Sample
Fill in your details and we'll send you a free sample report.
- Sample data tables & charts
- Research methodology
Market Dynamics
Shift Toward Flexible Mobility Solutions
Consumers and businesses are increasingly opting for access-based vehicle usage over traditional ownership, driven by rising vehicle prices, maintenance costs, and urban congestion. This shift is fueling demand for subscription-based and on-demand vehicle services, especially in metropolitan areas where flexibility and bundled services are highly valued.
Rising Adoption of Electric and Connected Vehicles
The integration of electric vehicles into subscription and fleet models is accelerating due to lower operating costs, government incentives, and stricter emission regulations. Connected vehicle technology further enhances service efficiency through real-time tracking, predictive maintenance, and improved user experiences.
Supportive Government Policies and Urban Initiatives
Government subsidies, tax incentives, and urban mobility initiatives are encouraging the adoption of shared and low-emission transport solutions. These policies are pushing service providers to electrify fleets and integrate VaaS offerings into smart city projects, expanding market reach.
Integration of AI and Predictive Analytics
AI-driven platforms are optimizing fleet allocation, maintenance schedules, and customer personalization, reducing operational costs and downtime. Predictive analytics enable dynamic pricing and tailored offerings, making VaaS models more attractive and efficient for both providers and users.
Growth of Commercial and Corporate Subscriptions
Enterprises are adopting vehicle subscription models to manage fleets more flexibly and cost-effectively, with access to the latest vehicles and integrated telematics. This trend is particularly strong among businesses seeking to optimize operational efficiency and meet sustainability targets.
Need a Custom Version of This Report?
Tailor the scope, geography, or segments to your exact requirements.
- Custom geography or segment scope
- Direct access to our analyst team
Frequently Asked Questions
What is the current market size for Vehicle as a Service market, and what is its projected size in 2032?
At what Compound Annual Growth Rate is the Vehicle as a Service market projected to grow between 2025 and 2032?
Which Vehicle as a Service market segment held the largest share in 2024?
What are the primary factors fueling the growth of the Vehicle as a Service market?
Who are the leading companies in the Vehicle as a Service market?
Which region commanded the largest share of the Vehicle as a Service market in 2024?
Table of Content
Chapter 1 Market Segmentation
- 1.1 Segmentation Framework
- 1.1.1 Product and Service Classification
- 1.1.2 Application and End-Use Classification
- 1.1.3 Technology and Solution Classification
- 1.1.4 Customer and Distribution Channel Classification
- 1.1.5 Geographic Segmentation
- 1.1.6 Market Segment Definitions and Boundaries
- 1.2 By Engine
- 1.2.1 Electric
- 1.2.2 IC engine
- 1.3 By Vehicle
- 1.3.1 Passenger cars
- 1.3.2 Trucks
- 1.3.3 Utility trailers
- 1.3.4 Motorcycles
- 1.4 By End-user
- 1.4.1 Enterprise users
- 1.4.2 Private users
- 1.5 By Service Provider
- 1.5.1 Automotive OEM
- 1.5.2 Auto dealerships
- 1.5.3 Auto tech startups
- 1.5.4 Car subscription software providers
Chapter 2 Introduction
- 2.1 Report Objectives and Scope
- 2.2 Product Definition and Industry Terminology
- 2.3 Market Inclusions and Exclusions
- 2.4 Research Process
- 2.4.1 Primary Research and Expert Interviews
- 2.4.2 Secondary Research and Source Review
- 2.4.3 Top-Down and Bottom-Up Estimation
- 2.4.4 Data Triangulation and Verification
- 2.5 Market Size Measurement Basis
- 2.5.1 2024: USD 10.45 billion → 2032: USD 45.82 billion
- 2.6 Historical and Forecast Reference Periods
- 2.6.1 Base Year: 2024
- 2.6.2 Forecast Period: 2024-2032
- 2.7 Research Assumptions and Limitations
Chapter 3 Executive Summary
- 3.1 Market Snapshot and Key Findings
- 3.2 Base-Year Market Size, 2024
- 3.3 Forecast Market Size, 2032
- 3.4 Revenue and Volume Growth Outlook
- 3.5 Key Demand and Supply Indicators
- 3.6 Leading Market Segments
- 3.7 Fastest-Growing Market Opportunities
- 3.8 Regional Performance Highlights
- 3.9 Technology and Industry Transformation
- 3.10 Competitive Landscape Summary
- 3.11 Analyst View and Strategic Implications
Chapter 4 Global Vehicle As A Service Market Trends and Developments
- 4.1 Historical Industry Development
- 4.2 Recent Market Trends and Developments
- 4.3 Demand and Customer Behavior Trends
- 4.4 Technology and Product Innovation
- 4.5 Artificial Intelligence, Automation and Digitalization
- 4.6 Local Manufacturing and Supply Chain Realignment
- 4.7 Industry Partnerships, Mergers and Acquisitions
- 4.8 Sustainability and Circular Economy Developments
- 4.9 Government and Private Sector Investment Trends
- 4.10 Emerging Business Models and Commercialization
- 4.11 Industry Developments and Announcements
Chapter 5 Global Vehicle As A Service Market Supply and Demand Analysis
- 5.1 Demand Trend and Consumption Analysis
- 5.2 Demand Forecast, 2024-2032
- 5.3 Supply Chain Structure and Procurement Trends
- 5.4 Supply-Demand Gap and Bottlenecks
- 5.5 Import Dependence and Sourcing Structure
- 5.6 Regional Supply and Demand Concentration
Chapter 6 Global Vehicle As A Service Market Pricing Analysis
- 6.1 Pricing Structure and Measurement
- 6.2 Historical Pricing Trends
- 6.3 Pricing Outlook, 2024-2032
- 6.4 Pricing by Product and Market Segment
- 6.5 Geographic Pricing Differences
- 6.6 Key Input, Energy, Labor and Logistics Costs
- 6.7 Contract Pricing and Purchasing Models
- 6.8 Pricing Sensitivity and Competitive Positioning
- 6.9 Price, Margin and Profitability Implications
Chapter 7 Global Vehicle As A Service Market Dynamics
- 7.1 Market Growth Drivers
- 7.1.1 Demand-Side Drivers
- 7.1.2 Technology and Innovation Drivers
- 7.1.3 Infrastructure and Investment Drivers
- 7.1.4 Regulatory and Policy Drivers
- 7.2 Market Restraints
- 7.2.1 Cost and Affordability Constraints
- 7.2.2 Technology and Adoption Barriers
- 7.2.3 Supply Chain and Operational Constraints
- 7.3 Market Challenges
- 7.3.1 Competitive Pressure and Margin Erosion
- 7.3.2 Skills, Infrastructure and Implementation Gaps
- 7.4 Emerging Market Opportunities
- 7.5 Market Dynamics Impact and Time-Horizon Assessment
Chapter 8 Global Vehicle As A Service Value Chain Analysis
- 8.1 Industry Value Chain Overview
- 8.2 Upstream Suppliers and Critical Inputs
- 8.3 Technology and Component Providers
- 8.4 Manufacturing or Service Delivery
- 8.5 Distribution, Channel Partners and Integrators
- 8.6 Downstream Applications and End Users
- 8.7 Value Addition and Profit Pools
- 8.8 Vertical Integration and Outsourcing
- 8.9 Supplier Concentration and Risk
- 8.10 Supply Chain Localization and Resilience
Chapter 9 Global Vehicle As A Service Market Regulations and Policies
- 9.1 Relevant Laws, Standards and Compliance Frameworks
- 9.2 Product, Service, Safety and Quality Requirements
- 9.3 Government Policies, Incentives and Subsidies
- 9.4 Imports, Exports and Trade Barriers
- 9.5 Public Procurement and Local Content Requirements
- 9.6 Data Protection, AI and Cybersecurity Compliance
- 9.7 Upcoming Policy Changes and Market Implications
Chapter 10 Global Vehicle As A Service Market Hotspots and Opportunities
- 10.1 Market Opportunity Mapping and Growth Hotspots
- 10.2 High-Growth Applications and Customer Groups
- 10.3 Underserved Markets and White-Space Opportunities
- 10.4 Emerging Technology and Product Opportunities
- 10.5 New Capacity and Investment Hotspots
- 10.6 Market Entry and Expansion Opportunities
- 10.7 Distribution and Partnership Opportunities
- 10.8 Near-Term and Long-Term Commercial Potential
- 10.9 Opportunity Attractiveness and Execution Risks
Chapter 11 Global Vehicle As A Service Market Outlook, 2024-2032
- 11.1 Market Size and Analysis
- 11.1.1 Revenue (Market Measurement: 2024: USD 10.45 billion → 2032: USD 45.82 billion)
- 11.1.2 Historical Market Size
- 11.1.3 Base-Year Market Size, 2024
- 11.2 Market Forecast, 2024-2032
- 11.2.1 Revenue Forecast to 2032
- 11.2.2 CAGR and Year-on-Year Growth
- 11.2.3 Incremental Revenue Opportunity
- 11.3 Forecast Assumptions and Scenario Analysis
- 11.3.1 Base-Case Forecast
- 11.3.2 Optimistic and Conservative Scenarios
- 11.3.3 Technology, Pricing and Policy Sensitivities
- 11.4 Market Attractiveness and Growth Outlook
Chapter 12 Global Vehicle As A Service Market Segmentation and Outlook
- 12.1 Segmentation Summary and Market Shares, 2024
- 12.2 Largest and Fastest-Growing Segments
- 12.3 By Engine - Market Size and Forecast, 2024-2032
- 12.3.1 Segment Definition and Scope
- 12.3.2 Historical Market Size
- 12.3.3 Revenue Forecast, 2024-2032
- 12.3.4 Base-Year Market Share, 2024
- 12.3.5 Segment CAGR and Growth Drivers
- 12.3.6 Subsegment Market Size and Forecast
- 12.3.6.1 Electric
- 12.3.6.2 IC engine
- 12.3.7 Subsegment Pricing and Adoption Trends
- 12.3.8 Leading Suppliers and Competition
- 12.3.9 Regional Demand and Opportunities
- 12.4 By Vehicle - Market Size and Forecast, 2024-2032
- 12.4.1 Segment Definition and Scope
- 12.4.2 Historical Market Size
- 12.4.3 Revenue Forecast, 2024-2032
- 12.4.4 Base-Year Market Share, 2024
- 12.4.5 Segment CAGR and Growth Drivers
- 12.4.6 Subsegment Market Size and Forecast
- 12.4.6.1 Passenger cars
- 12.4.6.2 Trucks
- 12.4.6.3 Utility trailers
- 12.4.6.4 Motorcycles
- 12.4.7 Subsegment Pricing and Adoption Trends
- 12.4.8 Leading Suppliers and Competition
- 12.4.9 Regional Demand and Opportunities
- 12.5 By End-user - Market Size and Forecast, 2024-2032
- 12.5.1 Segment Definition and Scope
- 12.5.2 Historical Market Size
- 12.5.3 Revenue Forecast, 2024-2032
- 12.5.4 Base-Year Market Share, 2024
- 12.5.5 Segment CAGR and Growth Drivers
- 12.5.6 Subsegment Market Size and Forecast
- 12.5.6.1 Enterprise users
- 12.5.6.2 Private users
- 12.5.7 Subsegment Pricing and Adoption Trends
- 12.5.8 Leading Suppliers and Competition
- 12.5.9 Regional Demand and Opportunities
- 12.6 By Service Provider - Market Size and Forecast, 2024-2032
- 12.6.1 Segment Definition and Scope
- 12.6.2 Historical Market Size
- 12.6.3 Revenue Forecast, 2024-2032
- 12.6.4 Base-Year Market Share, 2024
- 12.6.5 Segment CAGR and Growth Drivers
- 12.6.6 Subsegment Market Size and Forecast
- 12.6.6.1 Automotive OEM
- 12.6.6.2 Auto dealerships
- 12.6.6.3 Auto tech startups
- 12.6.6.4 Car subscription software providers
- 12.6.7 Subsegment Pricing and Adoption Trends
- 12.6.8 Leading Suppliers and Competition
- 12.6.9 Regional Demand and Opportunities
- 12.7 Segment Growth Comparison
- 12.8 Segment Attractiveness and Priority Matrix
Chapter 13 Global Vehicle As A Service End-Use and Application Market Outlook
- 13.1 End-Use Industry and Customer Demand Structure
- 13.2 Leading Applications and Customer Groups
- 13.3 End-Use Market Size, Share and Forecast
- 13.4 Major End-Use Industry Deep Dives
- 13.4.1 Customer Requirements and Use Cases
- 13.4.2 Demand and Replacement Cycles
- 13.4.3 Technical and Regulatory Considerations
- 13.4.4 Purchasing and Procurement Models
- 13.4.5 Leading Vendors and Distribution Channels
- 13.4.6 Forecast and Commercial Opportunities
- 13.5 Emerging Applications and Cross-Segment Demand
- 13.6 End-Use Industry Investment Priorities
Chapter 14 Global Vehicle As A Service Geographic Market Outlook, 2024-2032
- 14.1 Regional Market Size and Share, 2024
- 14.2 Regional Market Forecast, 2024-2032
- 14.3 Regional Pricing, Production and Demand Differences
- 14.4 North America
- 14.4.1 United States
- 14.4.2 Canada
- 14.4.3 Mexico
- 14.5 Europe
- 14.5.1 Germany
- 14.5.2 France
- 14.5.3 Italy
- 14.5.4 United Kingdom
- 14.5.5 Spain
- 14.5.6 Poland
- 14.5.7 Russia
- 14.5.8 Netherlands
- 14.5.9 Belgium
- 14.5.10 Sweden
- 14.5.11 Denmark
- 14.5.12 Norway
- 14.5.13 Rest of Europe
- 14.6 Asia Pacific
- 14.6.1 China
- 14.6.2 India
- 14.6.3 Japan
- 14.6.4 South Korea
- 14.6.5 Thailand
- 14.6.6 Indonesia
- 14.6.7 Vietnam
- 14.6.8 Malaysia
- 14.6.9 Australia
- 14.6.10 Rest of Asia Pacific
- 14.7 Latin America
- 14.7.1 Brazil
- 14.7.2 Argentina
- 14.7.3 Colombia
- 14.7.4 Chile
- 14.7.5 Rest of Latin America
- 14.8 Middle East
- 14.8.1 Saudi Arabia
- 14.8.2 United Arab Emirates
- 14.8.3 Turkey
- 14.8.4 Israel
- 14.8.5 Iran
- 14.8.6 Rest of the Middle East
- 14.9 Africa
- 14.9.1 South Africa
- 14.9.2 Egypt
- 14.9.3 Nigeria
- 14.9.4 Morocco
- 14.9.5 Rest of Africa
- 14.10 Regional Investment, Policy and Supply Chain Differences
- 14.11 Regional Competitive Landscape
- 14.12 Geographic Growth Hotspots
Chapter 15 Global Vehicle As A Service Technology, Innovation and Sustainability Outlook
- 15.1 Technology Landscape and Maturity
- 15.2 Product, Process and Service Innovation
- 15.3 AI, Automation and Digital Tools in the Industry
- 15.4 Technology Adoption and Performance Benchmarking
- 15.5 Innovation Pipeline and R&D Investment
- 15.6 Energy Efficiency and Resource Management
- 15.7 Sustainability, Recycling and Circularity
- 15.8 Technology Roadmap, 2024-2032
- 15.9 Risks of Obsolescence and Technology Substitution
Chapter 16 Global Vehicle As A Service Market Key Strategic Imperatives
- 16.1 Growth and Market Entry Priorities
- 16.2 High-Return Products and Segments
- 16.3 Pricing, Profitability and Cost Optimization
- 16.4 Technology Investment and Product Differentiation
- 16.5 Supply Chain Localization and Resilience
- 16.6 Distribution and Customer Acquisition
- 16.7 Partnership, Acquisition and Capacity Strategy
- 16.8 Regional Expansion Priorities
- 16.9 Short-, Medium- and Long-Term Actions
Chapter 17 Competition Outlook
- 17.1 Industry Competition Characteristics
- 17.2 Market Structure and Concentration
- 17.3 Market Share and Competitive Positioning, 2024
- 17.4 Company-Wise Revenue and Product Benchmarking
- 17.5 Production and Service Capacity Benchmarking
- 17.6 Technology, Pricing and Differentiation
- 17.7 Regional Footprint and Distribution Strength
- 17.8 Mergers, Acquisitions and Strategic Alliances
- 17.9 New Entrants and Competitive Threats
- 17.10 Porter's Five Forces and Industry Attractiveness
- 17.11 Competitive Outlook, 2024-2032
Chapter 18 Company Profiles
- 18.1 Company Coverage and Selection Criteria
- 18.2 Flexdrive (Lyft)
- 18.2.1 Business Description
- 18.2.2 Company Ownership and Geographic Presence
- 18.2.3 Product and Service Portfolio
- 18.2.4 Manufacturing and Operating Footprint
- 18.2.5 Financial Performance and Investment
- 18.2.6 Market Share and Competitive Position
- 18.2.7 Technology and Innovation Capabilities
- 18.2.8 Strategic Alliances or Partnerships
- 18.2.9 Recent Developments
- 18.2.10 Growth Strategy and Outlook
- 18.3 Porsche AG
- 18.4 CarNext B.V.
- 18.5 Hertz Corporation
- 18.6 Drover Ltd. (Cazoo)
- 18.7 Daimler AG (Mercedes-Benz Group)
- 18.8 General Motors Company
- 18.9 Cluno GmbH
- 18.10 Borrow (Prazo, Inc.)
- 18.11 Bavarian Motor Work AG (BMW Group)
- 18.12 Other Relevant Market Participants
Note: Every listed company is profiled on the structure shown under the first company. The company list is preliminary and may change based on research findings, market developments, data availability and client requirements.
Chapter 19 Disclaimer
- 19.1 Research and Forecast Disclaimer
- 19.2 Data Source and Estimation Limitations
Note: The depth of individual sections depends on data availability for this market. Volume, capacity, trade and other unit-based metrics are included where applicable.