
| REPORT ATTRIBUTE | DETAILS |
|---|---|
| Historical Period | 2019-2022 |
| Base Year | 2023 |
| Forecast Period | 2024-2032 |
| Waterway Mobility Market Size 2024 | USD 574139.1 Million |
| Waterway Mobility Market, CAGR | 5.4% |
| Waterway Mobility Market Size 2032 | USD 874464.14 Million |
Market Overview:
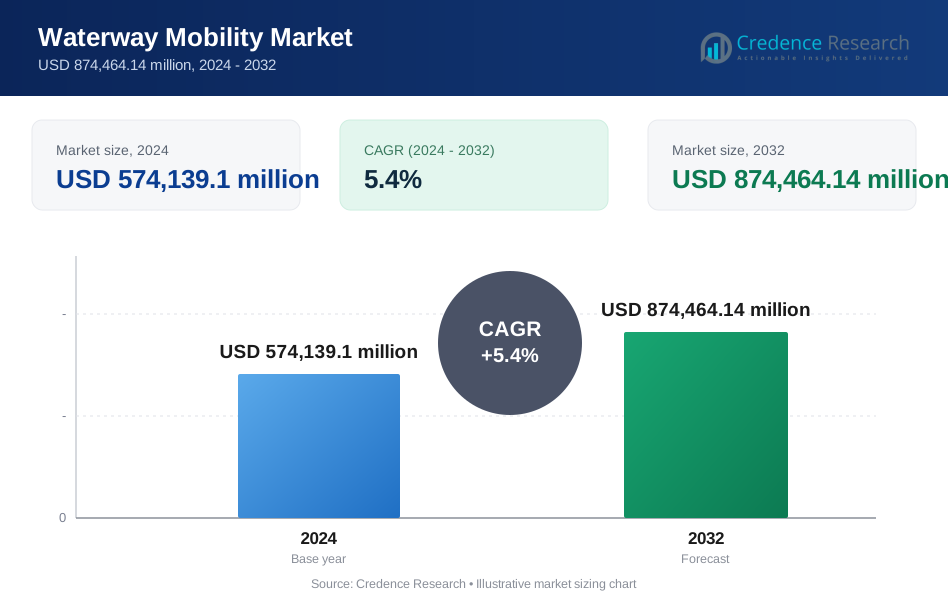
The Waterway Mobility Market is projected to grow from USD 574139.1 million in 2024 to an estimated USD 874464.14 million by 2032, with a compound annual growth rate (CAGR) of 5.4% from 2024 to 2032.
The waterway mobility market is propelled by several key drivers that underscore its growing importance in the global transportation landscape. One of the primary drivers is the increasing emphasis on reducing carbon emissions and promoting sustainable transport solutions. Waterway transportation, known for its lower fuel consumption and reduced emissions compared to road and rail transport, is gaining traction as governments and industries prioritize environmental sustainability. Moreover, the escalating global trade and the need for efficient bulk transport solutions are fueling the demand for waterway mobility, as it offers a cost-effective means of moving large volumes of goods over long distances. The integration of advanced technologies, such as autonomous vessels, smart navigation systems, and digital fleet management, is revolutionizing waterway transport by enhancing operational efficiency, safety, and reliability. These innovations are making waterway mobility an increasingly attractive option for both passenger and freight transport, further driving market growth.
Regionally, the waterway mobility market is experiencing robust growth across Europe, Asia-Pacific, and North America, each with its unique dynamics. Europe remains the leader in this market, benefiting from a well-established network of inland waterways and strong government support for green transportation initiatives. Countries such as Germany, the Netherlands, and France are at the forefront, leveraging their extensive river and canal systems to facilitate both passenger and freight transport, thus integrating waterways as a critical component of their national infrastructure. In the Asia-Pacific region, countries like China and India are rapidly emerging as key players, driven by significant investments in waterway infrastructure to support their burgeoning economies and alleviate pressure on congested road networks. China, in particular, is making strides with its ambitious plans to develop and modernize its vast network of rivers and canals. North America, particularly the United States, is also witnessing considerable growth, with increased utilization of inland waterways for freight transport. Government initiatives aimed at modernizing ports and waterways are playing a pivotal role in enhancing the efficiency and competitiveness of waterway transport in the region, positioning it as a vital part of the broader transportation ecosystem.
Market Drivers:
Environmental Sustainability and Emission Reduction:
One of the foremost drivers of the waterway mobility market is the growing global emphasis on environmental sustainability and the need to reduce carbon emissions. As countries around the world commit to ambitious climate goals, waterway transportation has gained prominence as a greener alternative to traditional road and rail transport. Waterways offer a more energy-efficient mode of transportation, with vessels consuming significantly less fuel per ton-mile compared to trucks or trains. For instance, data from Toyota Motor North America shows that 66% of Toyota and Lexus models available for purchase in North America now have an electrified option, contributing to reduced greenhouse gas emissions. This lower fuel consumption translates into reduced greenhouse gas emissions, aligning with the global push for cleaner transportation solutions. Governments and industries are increasingly recognizing the environmental benefits of waterway mobility, leading to heightened investments in developing and modernizing waterway infrastructure to support this sustainable mode of transport.
Cost-Effectiveness and Efficiency in Bulk Transport:
The cost-effectiveness of waterway transportation, particularly for bulk goods, is another key driver of the market. Transporting large volumes of goods over long distances via waterways is generally more economical than other modes of transport, especially for heavy or bulky items such as raw materials, agricultural products, and industrial goods. The ability to move substantial quantities in a single journey reduces transportation costs, making it an attractive option for industries reliant on large-scale logistics. Additionally, waterways often face less congestion compared to roads and railways, allowing for more predictable and timely deliveries. This efficiency is particularly crucial in global trade, where the ability to move goods efficiently across continents can have significant economic implications. As global trade continues to expand, the demand for cost-effective and efficient transportation solutions like waterway mobility is expected to grow.
Technological Advancements and Innovation:
Technological advancements are playing a pivotal role in driving the growth of the waterway mobility market. The introduction of autonomous vessels, smart navigation systems, and digital fleet management tools is revolutionizing the way waterway transport is conducted. Autonomous vessels, for example, are designed to operate with minimal human intervention, reducing labor costs and increasing operational efficiency. Smart navigation systems enhance the safety and reliability of waterway transport by providing real-time data on waterway conditions, weather, and traffic. Digital fleet management systems allow operators to optimize routes, monitor vessel performance, and manage logistics more effectively. These technological innovations not only improve the efficiency and safety of waterway transport but also make it a more competitive option compared to other modes of transportation. For instance, Government surveys, such as the Kochi Water Metro project, demonstrate the impact of technological advancements on urban mobility and emission reduction. According to McKinsey, about 20% of businesses analyzed are focusing on innovations related to applied AI, which includes autonomous driving and smart navigation systems. As technology continues to evolve, it is expected to further enhance the capabilities of waterway mobility, driving its adoption across various sectors.
Government Initiatives and Infrastructure Development:
Government initiatives and investments in infrastructure development are critical drivers of the waterway mobility market. Recognizing the economic and environmental benefits of waterway transport, governments around the world are investing in the modernization and expansion of waterway infrastructure. This includes dredging and maintaining rivers and canals, upgrading ports, and developing new waterway routes to enhance connectivity. In addition, governments are implementing policies and incentives to promote the use of waterways for both passenger and freight transport. For example, subsidies for the construction of energy-efficient vessels, tax incentives for companies that utilize waterway transport, and regulations encouraging the shift from road to waterway transport are all contributing to the market’s growth. These government-led efforts are essential in overcoming barriers to waterway mobility, such as outdated infrastructure and limited access to certain regions. As a result, the ongoing commitment of governments to support and develop waterway mobility is expected to significantly boost the market in the coming years.
Market Trends:
Increasing Adoption of Autonomous Vessels:
One of the most significant trends in the waterway mobility market is the growing adoption of autonomous vessels. As technological advancements continue to accelerate, the development of vessels that can operate with minimal human intervention is becoming a reality. Autonomous vessels are equipped with sophisticated sensors, navigation systems, and artificial intelligence that allow them to navigate complex waterways safely and efficiently. This technology not only reduces the need for human crew, thereby lowering operational costs, but also enhances the safety and reliability of waterway transport by minimizing the risk of human error. The adoption of autonomous vessels is expected to increase, particularly in sectors where efficiency and cost-effectiveness are paramount, such as freight transport and logistics.
Integration of Smart Waterway Infrastructure:
The integration of smart infrastructure into waterways is another emerging trend that is shaping the waterway mobility market. Smart waterway infrastructure involves the use of advanced technologies such as Internet of Things (IoT) sensors, data analytics, and real-time monitoring systems to enhance the efficiency and safety of waterway transport. For example, IoT sensors can be used to monitor water levels, traffic conditions, and weather patterns, providing real-time data to vessel operators. This data enables more informed decision-making, allowing for optimized routes, reduced fuel consumption, and improved overall efficiency. For instance, data from Smart Water Analytics LLC shows that the implementation of IoT sensors can reduce fuel consumption by up to 20%. Furthermore, the implementation of smart infrastructure is helping to address challenges related to waterway congestion and maintenance, making waterway transport a more viable and attractive option for both freight and passenger services.
Growth in Green and Sustainable Waterway Solutions:
The global push towards sustainability is driving the growth of green and sustainable solutions within the waterway mobility market. There is a rising demand for vessels that are powered by renewable energy sources such as solar, wind, and hydrogen fuel cells. These green vessels are designed to minimize environmental impact by reducing carbon emissions, fuel consumption, and noise pollution. Additionally, there is a growing focus on the development of electric and hybrid vessels, which combine the efficiency of electric propulsion with the range and power of traditional engines. The adoption of these sustainable technologies is being supported by government policies and incentives aimed at reducing the carbon footprint of the transportation sector. As a result, the market is seeing an increasing number of environmentally friendly vessels being introduced, particularly in regions with strict environmental regulations.
Expansion of Inland Waterway Networks:
The expansion and modernization of inland waterway networks are becoming increasingly important trends in the waterway mobility market. Many regions are recognizing the potential of inland waterways as a cost-effective and sustainable mode of transportation, leading to significant investments in the development and enhancement of these networks. This includes dredging and deepening rivers and canals to accommodate larger vessels, upgrading locks and bridges, and improving connectivity between inland waterways and other modes of transport, such as rail and road. For instance, data from the U.S. Army Corps of Engineers shows that the modernization of inland waterway networks can increase cargo capacity by up to 50%. The expansion of inland waterway networks is particularly prominent in Europe and Asia, where governments are actively promoting the use of waterways to alleviate congestion on roadways and reduce transportation-related emissions. As these networks continue to expand, they are expected to play a critical role in the growth and development of the waterway mobility market, providing new opportunities for both freight and passenger transport.
Market Restraints and Challenges:
High Infrastructure Development Costs:
One of the primary restraints in the waterway mobility market is the high cost associated with developing and maintaining waterway infrastructure. Unlike road and rail networks, waterways require continuous investment in dredging, maintaining, and upgrading to remain navigable and efficient. The construction of ports, locks, and bridges, as well as the modernization of existing facilities, involves substantial financial resources. These costs can be a significant barrier, particularly for developing regions where funding is limited. The high costs also make it challenging for private investors to enter the market, potentially slowing the pace of infrastructure development and expansion.
Environmental and Regulatory Challenges:
Environmental and regulatory challenges also pose significant restraints to the waterway mobility market. The construction and operation of waterway infrastructure can have environmental impacts, such as habitat disruption and water pollution, which can lead to opposition from environmental groups and local communities. Additionally, strict environmental regulations aimed at protecting water ecosystems can limit the development of new waterways or the expansion of existing ones. Compliance with these regulations often requires costly modifications to vessels and infrastructure, adding to the financial burden on operators and developers. These challenges can delay projects and increase operational costs, hindering market growth.
Limited Accessibility and Connectivity:
Limited accessibility and connectivity of waterway networks present another challenge for the waterway mobility market. In many regions, waterways are not well-integrated with other modes of transport, such as rail and road, reducing the efficiency and appeal of waterway transport. This lack of connectivity can lead to logistical bottlenecks, particularly in freight transport, where seamless intermodal connections are crucial for timely deliveries. Additionally, the geographical limitations of some waterways, such as shallow depths or narrow channels, restrict the size and type of vessels that can be used, further limiting the market’s potential. Addressing these connectivity and accessibility challenges requires significant investment and coordinated efforts between governments and the private sector, which can be difficult to achieve in practice.
Market Segmentation Analysis:
By Type, the market includes deep-sea, coastal, Great Lakes, and inland water transport. Inland water transport is particularly significant due to its cost-effectiveness and environmental benefits, facilitating the movement of goods and passengers within regions. Coastal and deep-sea transport also play crucial roles, especially in international trade, where large volumes of cargo are moved across continents.
By Vessel Type, the market is categorized into cargo ships, container ships, tankers, and other vessel types. Cargo and container ships dominate this segment, driven by the global demand for transporting goods efficiently over long distances. Tankers, particularly those carrying oil and gas, are essential for energy supply chains, contributing significantly to the market's growth.
By Transport Services, the segment includes electrically powered ferries, Sea Bubbles boats, Roboats, water scooters, water taxis, and water buses. Electrically powered ferries and water taxis are gaining popularity due to their eco-friendly nature and efficiency in urban and coastal areas. The emergence of innovative transport solutions like Roboats and Sea Bubbles boats highlights the market's shift towards autonomous and sustainable mobility options.
By Application, the market is divided into onshore and offshore applications. Onshore applications, which include transportation within inland waterways and coastal areas, are expanding rapidly due to their accessibility and integration with other transport modes. Offshore applications, including deep-sea and oil-related transport, are also growing, driven by global trade and energy exploration activities. This segmentation reflects the market's complexity and the varied demands driving its development.
Segmentation:
BY Type
- Deep-sea
- Coastal
- Great lakes
- Inland water transport
By Vessel Type
- Cargo Ships
- Container Ships
- Tankers
- Other Vessel Types
By Transport Services
- Electrically powered ferry
- Sea Bubbles boat
- Roboat
- Water Scooter
- water Taxi
- Water Bus
By Application
- Onshore
- Offshore
- North America
- The U.S
- Canada
- Mexico
- Europe
- Germany
- France
- The U.K.
- Italy
- Spain
- Rest of Europe
- Asia Pacific
- China
- Japan
- India
- South Korea
- South-east Asia
- Rest of Asia Pacific
- Latin America
- Brazil
- Argentina
- Rest of Latin America
- Middle East & Africa
- GCC Countries
- South Africa
- Rest of Middle East and Africa
Regional Analysis:
North America
North America holds a significant position in the global waterway mobility market, accounting for approximately 20% of the market share. The region's extensive network of inland waterways, particularly in the United States, plays a crucial role in freight transport, offering a cost-effective and environmentally friendly alternative to road and rail transport. The Mississippi River, Great Lakes, and numerous other inland waterways are integral to the region's logistics network, supporting the movement of bulk goods such as agricultural products, minerals, and chemicals. The U.S. government’s continued investment in modernizing ports and upgrading waterway infrastructure is expected to further enhance the region's market position. However, challenges such as aging infrastructure and the need for dredging and maintenance continue to pose hurdles to the market's growth.
Europe
Europe is the leading region in the waterway mobility market, commanding approximately 35% of the global market share. The region’s extensive and well-maintained network of rivers and canals, especially in countries like Germany, the Netherlands, and France, positions it at the forefront of waterway transport. The European Union's strong commitment to reducing carbon emissions and promoting sustainable transport has led to substantial investments in waterway infrastructure and the adoption of green technologies. Inland waterways in Europe are crucial for both freight and passenger transport, providing a vital link between major industrial hubs and ports. The region's leadership in implementing smart waterway infrastructure and autonomous vessel technology further strengthens its dominant position in the global market. However, environmental regulations and the need for continuous investment in infrastructure maintenance remain key challenges.
Asia-Pacific
Asia-Pacific is rapidly emerging as a key player in the waterway mobility market, holding approximately 30% of the global market share. China is the primary driver of this growth, with its extensive network of rivers and canals, such as the Yangtze River, serving as major transportation arteries. The Chinese government's aggressive investment in waterway infrastructure, aimed at boosting economic growth and reducing road congestion, is propelling the market forward. Additionally, India is making significant strides in developing its inland waterways as part of its broader infrastructure development strategy. The region's focus on integrating waterway transport with other modes of transport, such as rail and road, is enhancing the efficiency of logistics networks. However, challenges such as waterway pollution and the need for modernization of existing infrastructure continue to affect the market’s potential in the region.
Rest of the World
The Rest of the World, including regions such as Latin America, Africa, and the Middle East, accounts for approximately 15% of the global waterway mobility market. These regions are gradually recognizing the potential of waterway transport as a sustainable and cost-effective alternative to road and rail. In Latin America, countries like Brazil and Argentina are leveraging their river networks for the transportation of bulk goods, particularly agricultural products. Africa and the Middle East are also beginning to invest in waterway infrastructure to enhance connectivity and support economic development. However, these regions face significant challenges, including underdeveloped infrastructure, limited access to financing, and political instability, which can hinder market growth. Despite these obstacles, the potential for growth in these regions remains substantial as governments and private investors increasingly recognize the benefits of waterway mobility.
Key Player Analysis:
- P. Møller-Mærsk A/S
- American Commercial Barge Line
- American River Transportation
- Cargill Incorporated
- China Ocean Shipping Company Limited
- CMA CGM Group
- European Cruise
- Evergreen Marine Corp
- Hapag-Lloyd AG
- Hyundai Merchant
- Imperial Logistics International
- Ingram Barge
- Jeffboat
- Kirby Inland Marine
- Kuehne + Nagel International AG
- Marine Co. Ltd.
- McKeil Marine Limited
- Nippon Yusen
- Rhenus Group
- Renault Group
Competitive Analysis:
The waterway mobility market is moderately competitive, with several key players and regional operators vying for market share. Prominent companies such as Viking Line, Carnival Corporation, and Maersk dominate the passenger and freight segments, leveraging their extensive fleets, strong brand recognition, and global reach. These companies are continuously investing in fleet modernization, incorporating green technologies, and enhancing operational efficiency to maintain their competitive edge. Additionally, regional operators play a significant role in localized markets, particularly in Europe and Asia-Pacific, where inland waterways are crucial for transportation. The market also sees competition from emerging players focusing on innovative solutions like autonomous vessels and smart waterway infrastructure. Strategic partnerships, mergers, and acquisitions are common as companies seek to expand their geographical presence and technological capabilities. However, high infrastructure costs and stringent environmental regulations present challenges that all competitors must navigate to sustain growth in this evolving market.
Market Concentration & Characteristics:
The waterway mobility market is characterized by a moderate level of concentration, with a mix of global leaders and regional players. Major companies such as Maersk, Carnival Corporation, and Viking Line dominate the market, particularly in the passenger cruise and freight transport segments, due to their extensive fleets, advanced technologies, and strong market presence. These leading players benefit from economies of scale, allowing them to invest in fleet modernization and sustainable technologies, thereby maintaining a competitive edge. However, the market also features numerous regional operators, especially in Europe and Asia-Pacific, where inland waterways play a critical role in local transport networks. These regional players often have deep local expertise and strong relationships with governmental bodies, enabling them to effectively navigate regulatory environments. The market’s characteristics include high barriers to entry due to significant infrastructure and capital requirements, as well as the growing importance of sustainability and technological innovation.
Report Coverage:
The research report offers an in-depth analysis based on BY Type, By Vessel Type, By Transport Services and By Application. It details leading market players, providing an overview of their business, product offerings, investments, revenue streams, and key applications. Additionally, the report includes insights into the competitive environment, SWOT analysis, current market trends, as well as the primary drivers and constraints. Furthermore, it discusses various factors that have driven market expansion in recent years. The report also explores market dynamics, regulatory scenarios, and technological advancements that are shaping the industry. It assesses the impact of external factors and global economic changes on market growth. Lastly, it provides strategic recommendations for new entrants and established companies to navigate the complexities of the market.
Future Outlook:
- Expansion of smart waterway infrastructure will enhance efficiency and safety in transport operations.
- Autonomous vessels will gain traction, reducing operational costs and improving reliability.
- Growth in green technologies, including electric and hybrid vessels, will drive sustainability.
- Government investments in modernizing waterways will boost market development.
- Integration of waterway transport with multimodal logistics networks will increase efficiency.
- Increased focus on environmental regulations will push the adoption of low-emission technologies.
- Asia-Pacific will emerge as a dominant player due to significant infrastructure investments.
- Demand for cost-effective bulk transport solutions will drive market expansion.
- Technological advancements in navigation and fleet management will optimize operations.
- Rising global trade will further amplify the need for efficient waterway mobility solutions.
Request a Free Sample
Fill in your details and we'll send you a free sample report.
- Sample data tables & charts
- Research methodology
Need a Custom Version of This Report?
Tailor the scope, geography, or segments to your exact requirements.
- Custom geography or segment scope
- Direct access to our analyst team
Frequently Asked Questions
What is the projected growth of the Waterway Mobility Market?
What are the key drivers of the Waterway Mobility Market?
Which regions are leading the Waterway Mobility Market?
What challenges does the Waterway Mobility Market face?
Table of Content
Chapter 1. Report Introduction
- 1.1 Report Description & Purpose
- 1.1.1 Report Title & Market Definition
- 1.1.2 Unique Selling Propositions (USP) & Key Differentiators
- 1.1.3 Value Proposition for Stakeholders
- 1.2 Research Objectives
- 1.2.1 Market Sizing Objectives (Volume & Revenue)
- 1.2.2 Segmentation Objectives
- 1.2.3 Competitive Intelligence Objectives
- 1.2.4 Forecast & Scenario Objectives
- 1.3 Report Scope
- 1.3.1 Waterway Mobility Scope – Types & Subtypes Covered
- 1.3.2 Geographic Scope – Regions & Countries Covered
- 1.3.3 Historical Period, Base Year & Forecast Period (2024; forecast to 2032)
- 1.3.4 Inclusions & Exclusions
- 1.4 HS Code & Classification Framework
- 1.5 Currency, Units & Pricing Basis
- 1.6 Target Stakeholders
- 1.7 Limitations & Assumptions
Chapter 2. Executive Summary
- 2.1 Global Waterway Mobility Market Snapshot
- 2.1.1 Market Size – Historical (2024) & Forecast (2024-2032) (2024: USD 574,139.1 million → 2032: USD 874,464.14 million)
- 2.1.2 Volume & Revenue – Global Totals
- 2.1.3 Key Market Highlights – Top Five Facts
- 2.2 Waterway Mobility Market Segmentation Snapshot
- 2.2.1 Market Split by Region – 2024 vs. 2032
- 2.3 Competitive Snapshot
- 2.3.1 Top 10 Players by Revenue Share – 2024
- 2.3.2 Top 10 Players by Volume Share – 2024
- 2.3.3 Recent Strategic Developments (18-Month Summary)
- 2.4 Key Investment Highlights & Strategic Conclusions
Chapter 3. Waterway Mobility Market Dynamics & Industry Analysis
- 3.1 Market Overview & Context
- 3.1.1 Waterway Mobility Market Position in the Broader Automotive Value Chain
- 3.1.2 OEM vs. Replacement Market Dynamics
- 3.1.3 Market Maturity & Development Stage by Region
- 3.2 Waterway Mobility Market Drivers
- 3.3 Waterway Mobility Market Restraints & Challenges
- 3.4 Waterway Mobility Market Opportunities
- 3.5 Porter's Five Forces Analysis
- 3.5.1 Threat of New Entrants
- 3.5.2 Bargaining Power of Suppliers
- 3.5.3 Bargaining Power of Buyers
- 3.5.4 Threat of Substitutes
- 3.5.5 Competitive Rivalry – Intensity Assessment
- 3.6 Waterway Mobility Value Chain Analysis
- 3.6.1 Upstream – Raw Material/Input Suppliers
- 3.6.1.1 Raw Material/Input 1
- 3.6.1.2 Raw Material/Input 2
- 3.6.1.3 Raw Material/Input 3
- 3.6.2 Midstream – Production/Manufacturing/Service Delivery
- 3.6.2.1 Production/Process Overview
- 3.6.2.2 Key Facility Locations & Capacity by Manufacturer
- 3.6.3 Downstream – Distribution & End Consumer
- 3.6.3.1 Primary Channel – B2B/OEM
- 3.6.3.2 Secondary Channels – Dealer, Retail, Online, Direct
- 3.6.4 Value Chain Profitability Analysis
- 3.6.1 Upstream – Raw Material/Input Suppliers
- 3.7 PESTEL Analysis
- 3.7.1 Political Factors
- 3.7.2 Economic Factors
- 3.7.3 Social Factors
- 3.7.4 Technological Factors
- 3.7.5 Environmental Factors
- 3.7.6 Legal Factors
- 3.8 Waterway Mobility Supply Chain Analysis
- 3.8.1 Raw Material/Input Supply Risk Assessment
- 3.8.2 Manufacturing Concentration Risk (Geographic Exposure)
- 3.8.3 Trade Disruption Impact Analysis
- 3.9 Regulatory & Policy Landscape
Note: The regulatory and policy landscape section covers regulations based on their applicability to the market, Waterway Mobility category, geography, and scope of the study. Only regulatory frameworks with a material impact on operations, compliance, trade, sustainability, or market access are analyzed in detail.
Chapter 4. Key Investment Pockets & Opportunity Analysis
- 4.1 Waterway Mobility Market Attractiveness Analysis
- 4.1.1 By Region – Investment Attractiveness Matrix (Volume × CAGR)
- 4.2 Absolute Revenue Growth Opportunity
- 4.2.1 By Region – Absolute USD Growth Through 2032
- 4.3 Incremental Volume Opportunity
- 4.3.1 By Region – Incremental Volume Through 2032
- 4.3.2 Segment – Incremental Volume
- 4.4 Emerging Submarket Opportunity Deep Dive (Subject to Applicability)
- 4.5 Emerging Market Opportunity Scorecards
- 4.5.1 United States
- 4.5.2 Europe
- 4.5.3 Asia
- 4.5.4 Middle East & Africa
Note: Emerging Market Opportunity Scorecards will be included based on relevance and strategic importance. Regions listed are indicative and may vary depending on data availability and market dynamics.
Chapter 5. Waterway Mobility Import-Export Analysis & Trade Flows
- 5.1 Global Trade Overview
- 5.1.1 Global Export Value by Country (2024)
- 5.1.2 Global Export Volume by Country (2024)
- 5.1.3 Global Import Value by Country (2024)
- 5.1.4 Global Import Volume by Country (2024)
- 5.1.5 Net Trade Balance by Country (2024)
- 5.2 Export Analysis – Segment
- 5.2.1 Type 1 (HS Code)
- 5.2.2 Type 2 (HS Code)
- 5.2.3 Type 3 (HS Code)
- 5.2.4 Type 4 (HS Code)
- 5.2.5 Type 5 (HS Code)
- 5.3 Import Analysis – Segment
- 5.3.1 Type 1 (HS Code)
- 5.3.2 Type 2 (HS Code)
- 5.3.3 Type 3 (HS Code)
- 5.3.4 Type 4 (HS Code)
- 5.3.5 Type 5 (HS Code)
- 5.4 Average Unit Trade Prices
- 5.4.1 Average Export Price – Segment & Country
- 5.4.2 Average Import Price – Segment & Source Country
- 5.4.3 Price Trends (2024)
- 5.5 Key Trade Route Analysis
- 5.5.1 Trade Route 1
- 5.5.2 Trade Route 2
- 5.5.3 Trade Route 3
- 5.5.4 Trade Route 4
- 5.5.5 Trade Route 5
- 5.6 Trade Policy Impact Assessment
- 5.6.1 US Anti-Dumping & Section 301 Tariffs
- 5.6.2 EU Customs Union Impact
- 5.6.3 Major Free Trade Agreements
- 5.6.4 USMCA Rules of Origin
Note: Trade policy analysis will be included only where relevant to the Waterway Mobility market.
Chapter 6. Competitive Landscape & Company Benchmarking
- 6.1 Waterway Mobility Market Concentration & Structure
- 6.1.1 Herfindahl-Hirschman Index (HHI) – vs. 2024
- 6.1.2 Tier 1, Tier 2 & Tier 3 Market Structure
- 6.1.3 Global, Regional & Local Player Dynamics
- 6.2 Waterway Mobility Market Share Analysis – 2024
- 6.2.1 Global Revenue Share by Company
- 6.2.2 Global Volume Share by Company
- 6.2.3 Regional Revenue Share
- 6.2.4 Market Share Evolution ( vs. 2024)
- 6.2.5 OEM Segment Share by Company
- 6.2.6 Replacement Segment Share by Company
- 6.3 Production/Delivery Capacity & Facility Analysis
- 6.3.1 Global Installed Capacity
- 6.3.2 Capacity Utilization Rates
- 6.3.3 Production/Output Volume
- 6.3.4 Facility Locations & Capacity Map
- 6.3.5 Planned Capacity Additions
- 6.4 Waterway Mobility Competitive Benchmarking Matrix
- 6.4.1 Revenue, Volume, CAGR & Profitability Comparison
- 6.4.2 Channel Revenue Mix
- 6.4.3 Geographic Revenue Exposure
- 6.4.4 R&D Intensity
- 6.4.5 Sustainability Maturity
- 6.5 Strategic Developments in Waterway Mobility (Last 24 Months)
- 6.5.1 Mergers, Acquisitions & Divestments
- 6.5.2 New Waterway Mobility Launches
- 6.5.3 Facility Expansions
- 6.5.4 Strategic Alliances, Joint Ventures & Partnerships
- 6.5.5 Distribution Expansion & Market Entry
- 6.5.6 Sustainability & ESG Initiatives
- 6.6 Competitive Strategy Mapping
- 6.6.1 Leader, Challenger, Follower & Niche Classification
- 6.6.2 Pricing Strategy Comparison
- 6.6.3 Channel Strategy Matrix
Note: Strategic developments are included based on their materiality and the availability of reliable information.
Chapter 7. Global Waterway Mobility Market – By Distribution Channel
- 7.1 Segment Overview
- 7.1.1 Volume & Revenue Split by Channel (2024 & 2032)
- 7.1.2 Channel Mix Evolution (2024-2032)
Chapter 8. Regional Market Analysis – Global Overview
- 8.1 Global Regional Overview
- 8.1.1 Regional Volume Share
- 8.1.2 Regional Revenue Share
- 8.1.3 Regional Volume by Region
- 8.1.4 Regional Revenue by Region
- 8.1.5 Regional Forecast Through 2032
- 8.2 Cross-Regional Segment Analysis
- 8.2.1 By Distribution Channel
- 8.2.2 By Brand/Price Tier
Chapter 9. North America Waterway Mobility Market
- 9.1 United States
- 9.2 Canada
- 9.3 Mexico
Chapter 10. Europe Waterway Mobility Market
- 10.1 Germany
- 10.2 France
- 10.3 Italy
- 10.4 United Kingdom
- 10.5 Spain
- 10.6 Poland
- 10.7 Russia
- 10.8 Netherlands
- 10.9 Belgium
- 10.10 Sweden
- 10.11 Denmark
- 10.12 Norway
- 10.13 Rest of Europe
Chapter 11. Asia Pacific Waterway Mobility Market
- 11.1 China
- 11.2 India
- 11.3 Japan
- 11.4 South Korea
- 11.5 Thailand
- 11.6 Indonesia
- 11.7 Vietnam
- 11.8 Malaysia
- 11.9 Australia
- 11.10 Rest of Asia Pacific
Chapter 12. Latin America Waterway Mobility Market
- 12.1 Brazil
- 12.2 Argentina
- 12.3 Colombia
- 12.4 Chile
- 12.5 Rest of Latin America
Chapter 13. Middle East Waterway Mobility Market
- 13.1 Saudi Arabia
- 13.2 United Arab Emirates
- 13.3 Turkey
- 13.4 Israel
- 13.5 Iran
- 13.6 Rest of the Middle East
Chapter 14. Africa Waterway Mobility Market
- 14.1 South Africa
- 14.2 Egypt
- 14.3 Nigeria
- 14.4 Morocco
- 14.5 Rest of Africa
Chapter 15. Waterway Mobility Company Profiles
- 15.1 [Company 01]
- 15.1.1 Company Overview
- 15.1.2 Key Management Personnel
- 15.1.3 Products & Services Portfolio
- 15.1.4 Financial Performance
- 15.1.5 Key Market Focus & Geographic Presence
- 15.1.6 Recent Developments & Strategic Initiatives
Note: The company profile list is preliminary and may change based on research findings, market developments, data availability, and client requirements.
Chapter 16. Appendices
- Appendix A – List of Abbreviations & Acronyms
- Appendix B – Industry Classification Code Reference – Full Series
- Appendix C – Production & Capacity Data Tables
- Appendix D – End-Use & Demand Base Tables
- Appendix E – Consumption & Replacement Rate Assumptions
- Appendix F – ASP Reference Tables
- Appendix G – Manufacturing & Facility Database
- Appendix H – Import-Export Data Tables
- Appendix I – Regulatory Summary Tables
- Appendix J – Primary Research Participant List (Anonymized)
- Appendix K – Primary Research Questionnaire Framework
- Appendix L – Data Sources & Bibliography
- Appendix M – Market Size Divergence & Source Comparison
Chapter 17. Research Methodology
- 17.1 Research Framework & Philosophy
- 17.2 Secondary Research – Sources, Hierarchy & Data Extraction
- 17.3 Data Modeling – Bottom-Up & Top-Down Market Sizing
- 17.4 Primary Research – Stakeholder Framework, LOI & Sample Sizes
- 17.5 Forecast Methodology – Regression, Scenario & Sensitivity Analysis
- 17.6 Quality Control – Four-Layer Validation Framework
- 17.7 Limitations & Standard Assumptions
- 17.8 Disclaimer
