
| REPORT ATTRIBUTE | DETAILS |
|---|---|
| Historical Period | 2019-2022 |
| Base Year | 2023 |
| Forecast Period | 2024-2032 |
| Aerial Imaging Market Size 2023 | USD 2745.8 Million |
| Aerial Imaging Market, CAGR | 14.80% |
| Aerial Imaging Market Size 2032 | USD 9509.24 Million |
Market Insights
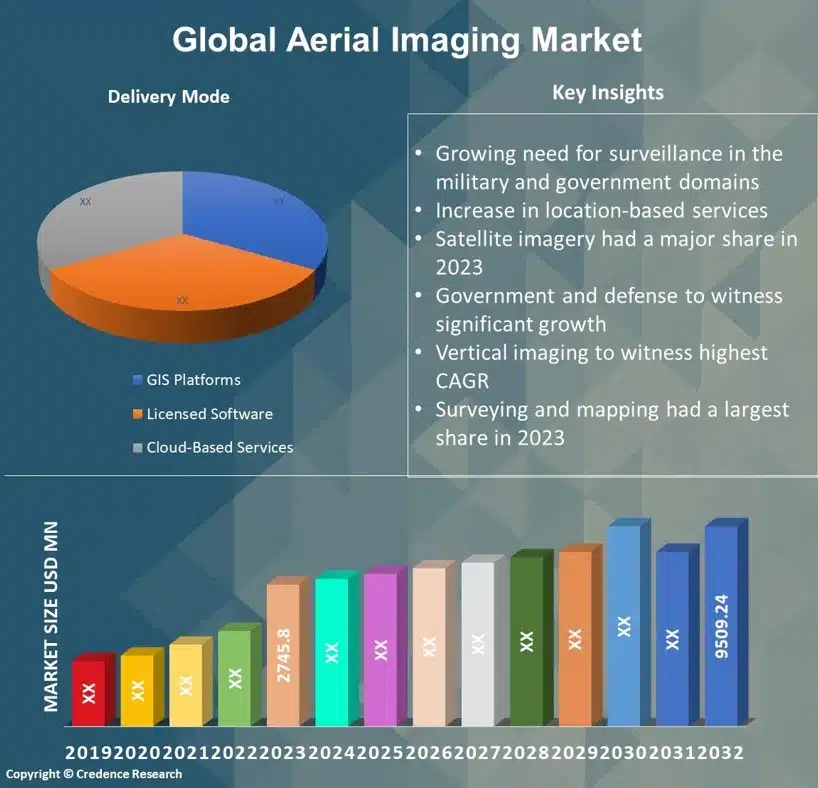
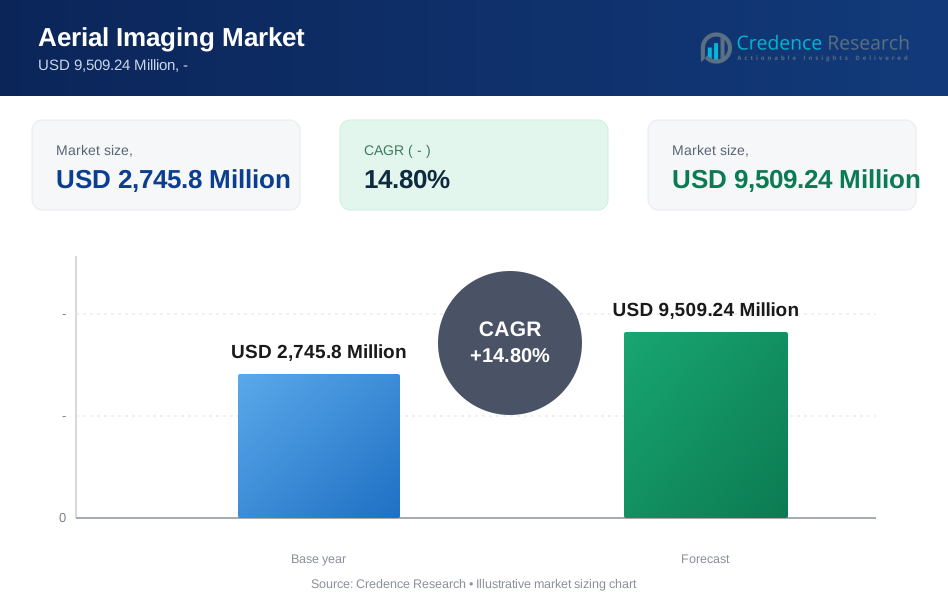
- The global demand for aerial imaging was valued at USD 2745.8 Million in 2023 and is expected to reach USD 9509.24 Million in 2032, growing at a CAGR of 14.80% between 2024 and 2032.
- The largest platform type section is satellite imagery. On the other hand, unmanned aerial vehicles or drones are expected to grow at a strong CAGR.
- The leading end-user industry segment is government and defense.
- The CAGR for vertical imaging is expected to be the highest during the projection period.
- The high resolution will likely have the highest CAGR during the forecast time frame.
- Surveying and mapping are estimated to have the greatest CAGR during the forecast period.
- The GIS platforms segment will likely have the highest CAGR during the prediction period.
- North America dominated the aerial imaging market.
- Regarding aerial imaging market share, Europe is expected to come second.
- In the aerial imaging market, Asia Pacific is anticipated to grow fastest.
- Technological developments, the growing need for high-resolution photography, and the expanding use of drones are the primary drivers of market expansion.
- The aerial imaging industry offers several potentials due to incorporating artificial intelligence and machine learning, the need for 3D aerial imaging, and agricultural precision.
Executive Summary
Market Definition
The technique of taking pictures of the Earth's surface using cameras mounted on various vehicles—such as airships, balloons, aircraft, parachutes, helicopters, and kites—is known as aerial imaging. Risk reduction, resource planning, mapping, research and excavation, security and surveillance, engineering, urban planning, farmland management, tourism, and other areas are all aided by aerial imagery.
Market Overview
The global aerial imaging market has witnessed steady growth in recent years and is expected to grow at a CAGR of 14.80% between 2024 and 2032. The market was valued at USD 2745.8 million in 2023 and is expected to reach USD 9509.24 million in 2032.
The unmanned aerial system performs better when artificial intelligence (AI) software is added, especially for photos, mapping, inspection, and other tasks. UUVs used to be limited to what their cameras could display. Drones can now track objects, map areas, and give real-time analytical input because of the development of artificial intelligence software.
Drone AI software, such as aerial mapping and real-time data and analytics, is created by Folio3 Software Inc. Drone camera data is processed using specialized AI algorithms that analyze, analyze, and generate a comprehensive report in a dashboard format. Drones are automated and given autonomy through the use of AI.
The business sells a drone AI automation system with numerous uses in precision agriculture, crack and change detection, livestock management, terrain mapping, and other fields. Leading software companies like Google, Microsoft, and Amazon provide AI cloud technologies that Folio3 leverages. These factors are expected to support the growth of the aerial imaging market.
Segmentation by Platform Type
- By platform type, satellite imagery is the market leader. Images captured of Earth from satellites in orbit are called satellite imagery. These satellites have a variety of sensors that allow them to capture high-resolution photos by identifying light sources such as microwave radiation, infrared light, and light that is visible.
- The unmanned aerial vehicles (UAVs) or drones category is anticipated to exhibit a sizable CAGR during the projected period. An aerial vehicle that is driven and does not have a human operator is known as an unmanned aerial vehicle (UAV). It can be remotely controlled or operated autonomously, carrying a deadly or nonlethal payload. Additionally, it can be expendable or recoverable. Finally, it can be controlled by aerodynamic forces.
- Other platform types, such as fixed-wing aircraft and helicopters, also contribute to the demand for aerial imaging.
Segmentation by End-User Industry
- The main end-user industry is government and defense. Military training exercises use aerial imagery to generate realistic situations and replicate battlefield circumstances.
- The agriculture category will likely register a significant CAGR during forecasting. Crop yields are estimated using aerial imaging, which evaluates variables like biomass, canopy cover, and plant density.
- Other end-user industries, such as construction and infrastructure, environmental monitoring, oil and gas, real estate, GIS, and mapping, also contribute to the demand for aerial imaging.
Segmentation by Imaging Type
- It is projected that over the projection period, the category of vertical imaging will grow at the fastest rate. Creating precise maps and maintaining geographic information systems (GIS) depend on vertical aerial images.
- Other imaging types, such as oblique, multispectral, and hyperspectral imaging, also contribute to the demand for aerial imaging.
Segmentation by Resolution
- The high-resolution category will likely have the highest CAGR during the projection period. High-resolution aerial photography is useful in forestry for monitoring tree species, determining changes in vegetation structure, and evaluating the health of the forest.
- Other resolutions, such as low, medium, and ultra-high resolutions, also contribute to the demand for aerial imaging.
Segmentation by Application
- Surveying and mapping will be expected to have the foremost CAGR during the prediction period. Collecting, analyzing, and interpreting location data is crucial in surveying and mapping to produce precise maps of the Earth's surface.
- Other applications, such as disaster management, navigation and tourism, and 3D Modeling, also contribute to the demand for aerial imaging.
Segmentation by Delivery Mode
- Throughout the forecast duration, the category for GIS platforms is anticipated to have the greatest CAGR. Computer systems that evaluate and provide data with a geographic context are known as geographic information systems or GISs. This system makes use of location-specific data.
- Other delivery modes, such as licensed software and cloud-based services, also contribute to the demand for aerial imaging.
Segmentation by Region
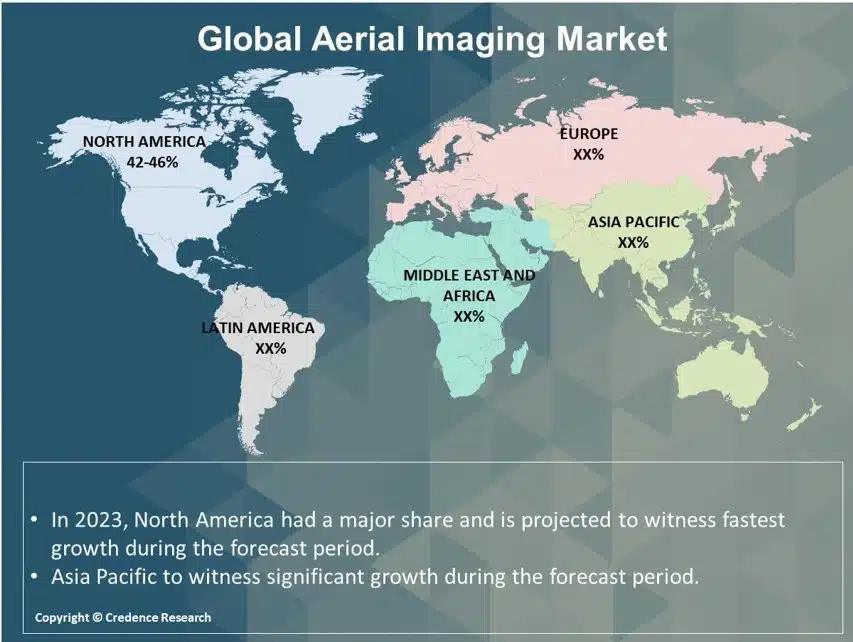
- North America leads the global aerial imaging industry. In North America, 3D aerial imaging technology is growing, particularly in infrastructure, building, and urban planning projects.
- Europe is estimated to rank second in market size for aerial imaging.
- Asia Pacific will witness the most rapid growth of the aerial imaging market.
- The remaining aerial imaging demand is satisfied by regions of the world, such as Africa, the Middle East, and Latin America.
Government policies and regulations, environmental preservation and monitoring, and the need for real-time data are the main factors driving the aerial imaging industry.
Regarding forecasting, North America is likely to dominate the aerial imaging market. North America is one of the main investors and users in the market because of the in-depth research carried out by local companies and the increasing uptake of the technologies among local end-user industries. Geographic data from orthographic photographs is used by aerial imaging to extract information on maps of land cover, vegetation, soil, and geology. Government initiatives including handling emergency response and disasters, researching the environment, maintaining inland and property information, and archaeology use aerial images. Subsequently, plans, maps, and forecasts required for the correct representation of the Earth's surface are produced using aerial imaging.
In addition, the use of aerial imagery for land mapping and construction is becoming more and more popular among engineers, planners, and developers. The augmentation of aerial imaging platforms in forestry, military, disaster management, and urban planning applications can be attributed mostly to industry expansion.
Throughout the forecast, the Asia Pacific region is anticipated to increase at the quickest rate. Drones are used not just by consumers and enthusiasts but also by businesses due to their rising affordability, portability, and wireless mobile connectivity. The mining, construction, insurance, media and entertainment, mining, building, transportation, and logistics sectors are some potential possibilities. Airborne instruments like drones, planes, helicopters, and balloons are utilized for aerial imaging. Planning and analysis require the interpretation of locations for topographical mapping and aerial imaging. It provides essential data for uses in forestry, urban planning, asset monitoring, conservation, habitat preservation, and precision farming.
Moreover, crop intelligence services and agricultural drone aircraft leasing have new markets due to agriculture drone technology, which also targets specialized crops and small-scale farms. Drone use in agriculture is increasing because of financial incentives and government support. The legal framework for commercial drones and agriculture drone operation, including quality and safety, operator certification, and insurance requirements for each country's market, will dictate the pace, scope, and type of agricultural drones to be adopted in different market contexts. These elements boost the growth of the Asia Pacific aerial imaging market.
Key Highlights of the Report
The global aerial imaging market is segmented by platform type, end-user industry, imaging type, resolution, application, delivery mode, and region. As far as the platform type is concerned, satellite imagery is the market spearhead. Government and defense are the top end-user industry segments. During the forecast period, the vertical imaging category is expected to grow at the highest CAGR. High-resolution aerial imaging will experience the highest CAGR during the forecast period. Aerial imaging is expanding mostly in North America.
Aerial imagery finds various uses in business applications, mHealth, personal tracking, sports, emergency and safety, mapping and GIS, geomarketing and advertising, navigation, and social networking. Each of these apps was made expressly to fulfill certain specifications and needs. Vendors of aerial imaging markets utilize vertical and oblique images to plan land-use projects, environmental research, movie production, archaeology, oil and gas surveys, surveillance, power line inspection, commercial advertising, and even art projects. Vertical and oblique photos can locate water, oil and gas line breaks, and archaeological objects. Also, throughout the conflict, targets can be found using aerial photos. Because drone technology is advancing, there are more and more application cases for this particular technology.
However, according to forecasts, North America will hold the largest market share for aerial imaging globally. Because of the ongoing building in the area, there is a growing need for aerial imaging. Field engineers, for instance, can more effectively check these discrepancies and track the status of jobs utilizing drone technology. Drone technology can help with both problems, as manual labor accounts for 48% of all rework on US construction sites. The Asia Pacific region is also assumed to have the market's sharpest growth. The need for drones, the growing number of imaging applications, rising government revenues and expenditures, shifting government preferences, and growing commercial prospects all contribute to the market's development in the area.
Which Key Factors Are Driving The Global Aerial Imaging Market?
The growth of metropolitan areas, partnerships and collaborations, and improvements in LiDAR technology are all contributing factors to the expansion of the aerial imaging sector.
What Are The Key Challenges In The Global Market For Aerial Imaging?
The risk of accidents and crashes, restricted accessibility in distant places, and worries about the security of aerial imaging data are some barriers preventing the aerial imaging sector from expanding.
What Market Opportunities Exist For Aerial Imaging Globally?
The market for aerial imaging is expanding due to more economical satellite launches, better data management and storage, and reduced costs for aerial imaging solutions.
Market Drivers
Multiple factors propel the aerial imaging industry across the globe. The primary factors propelling the global aerial imaging market are as follows:
Growing Need for Surveillance in the Military and Government Domains
Due to the wide range of uses for aerial imagery services—including photogrammetric surveys, surveillance, topographic map creation, and more—their use has grown dramatically in recent years. There is a greater need for aerial photography due to the increasing use of surveillance drones for applications in public safety and security, wildlife, animal welfare, and critical infrastructure protection. For Example, Nearmap has plans to significantly expand its post-catastrophe project in North America in November 2021. Insurance companies, emergency services, governments, property management companies, and construction and engineering firms will be able to organize a disaster response better and oversee rebuilding and recovery activities due to the program's high-resolution aerial photography and location data. In the 20th century, aerial photography evolved into a crucial step in the mapping process. Aerial photos offer a clear representation of the physical and cultural landscape of a region at a certain point in time. Governments can effectively benefit from aerial photos by using them to anticipate, respond to, and recover from the effects of predicted impending or actual dangerous circumstances. Furthermore, the expansion of the aerial imaging market is driven by an increase in contracts between government agencies and key players.
Market Restraints
There are several obstacles that the global aerial imaging market must overcome to continue growing. Among them are the following:
Inconsistency in Drone and UAV Regulations
Aerial imaging takes pictures of the ground using cameras attached to many types of vehicles, including airships, balloons, aircraft, parachutes, helicopters, and kites. Drones are extensively utilised in the world's business, military & defence, and civil sectors for taking aerial photos. Government rules have resulted in significant restrictions on drone flying for industry and end users in several nations during the past few years. A few nations require a flight licence, and others let tiny drones to fly commercially beyond visual line of sight (BVLOS). One key barrier facing the sector is the lack of uniform air traffic laws. Operational difficulties can be reduced when there is consistent air traffic control. The Federal Aviation Administration and NASA collaborated to create a cooperative unmanned traffic management (UTM) research plan in May 2022, which included research goals and the evolution of UTM. Research at Unmanned Aircraft System Test Sites is being directed by NASA to investigate more UTM capabilities that can be used to modify rulemaking when chances for aerial vehicle integration arise.
Opportunities
There are plenty of potential prospects in the global aerial imaging industry. Among these are the following:
Increase in Location-Based Services
GPS aids in pinpointing a location when utilized in aerial imaging. For example, GPS targeting can be used by farmers to monitor crop health, identify trouble spots, and fertilize crops. Because aerial imagery provides more exact targeting and weather damage repair, its accuracy aids in managing energy and power sites. Among the many new cloud-based services that seek to inform, notify, and guide is location-based mobile advertising. Furthermore, it is often accepted that high-resolution aerial photography is an affordable answer to problems with sales, marketing, and customer service. Insurance firms may easily check claims data together with property features with the help of location-based aerial photography technologies, which is essential for accurate and effective claims administration.
Because of geographic technology, aerial imagery has become more common in recent years to give accurate location data for various uses. Within the defense and security industry, aerial pictures and geospatial data are becoming increasingly important. During the projection period, location-based services for information and entertainment are expected to generate new growth prospects for the market as they become more and more popular with common people.
Competitive Landscape
Key Players
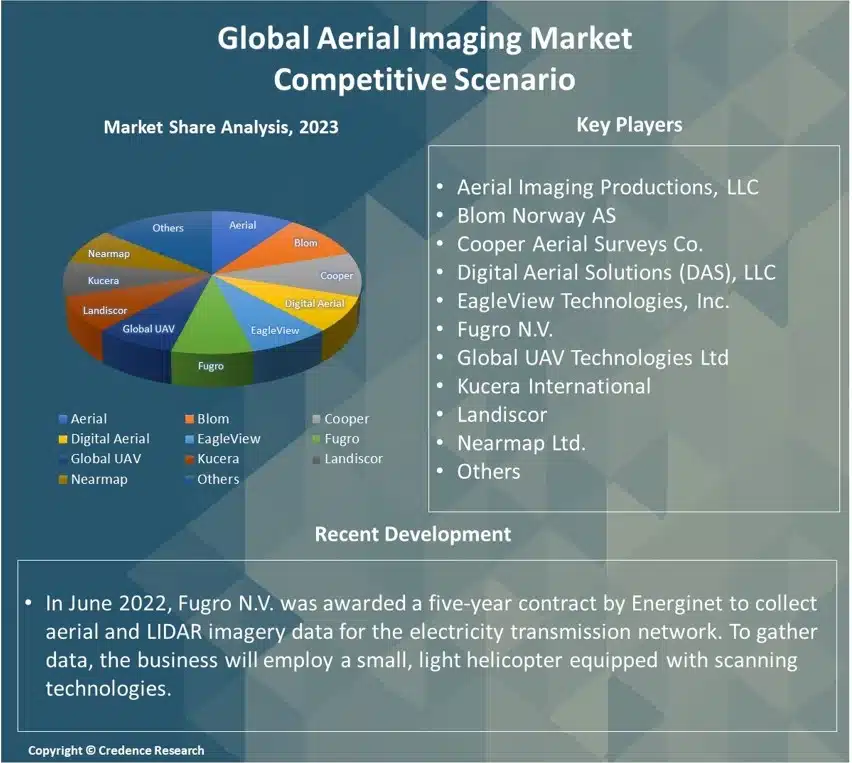
There are several major competitors in the fiercely competitive global aerial imaging market. The following are a few of the leading market participants and their market shares:
- Aerial Imaging Productions, LLC
- Blom Norway AS
- Cooper Aerial Surveys Co.
- Digital Aerial Solutions (DAS), LLC
- EagleView Technologies, Inc.
- Fugro N.V.
- Global UAV Technologies Ltd
- Kucera International
- Landiscor
- Nearmap Ltd.
- Others
To remain competitive, these companies place a high priority on product innovation, distribution channel expansion, and mergers and acquisitions.
The major global aerial imaging market players are always trying to remain ahead of the competition by introducing innovations and products.
In May 2023, Inspired Flight Technologies and Phase One introduced a cutting-edge plug-and-play system that blends aerial imagery with adaptable operations to meet diverse surveying and inspection needs. Medium and large-format aerial photography systems are developed and manufactured by Phase One, a leading global manufacturer. Inspired Flight Technologies is a top provider of tiny unmanned aerial systems (UAS) for commercial use simultaneously.
In March 2023, the Aviation & Defence Universe News reported that UP42, a geospatial developer platform and marketplace, greatly increased the range of aerial photography and elevation data it offered by partnering with Vexcel, a 30-year leader in the photogrammetric and remote sensing industries. Vexcel has launched a massive global aerial data gathering initiative that has captured geospatial data in over 30 nations with ultra-high-resolution imagery (at 7.5 to 15 cm resolution).
Summary of Key Findings
- The emergence of ready-to-fly (RTF) equipment, soft-copy photogrammetry software, low-cost digital cameras, image processing, GPS, thermal, multispectral, hyperspectral, and LiDAR sensors has expanded the aerial imaging market.
- The market is segmented by platform type, end-user industry, imaging type, resolution, application, delivery mode, and region.
- The most popular type of platform type in the market is satellite imagery.
- Agriculture is the foremost end-user industry category.
- Regarding CAGR, vertical imaging is expected to grow fastest during the forecast period.
- The category for GIS platforms will likely see the highest CAGR during the anticipated time frame.
- North America is leading market development; the market is highly competitive with key players including Aerial Imaging Productions, LLC, Blom Norway AS, Cooper Aerial Surveys Co., Digital Aerial Solutions (DAS), LLC, EagleView Technologies, Inc., Fugro N.V., Global UAV Technologies Ltd, Kucera International, Landiscor, Nearmap Ltd., and Others.
Future Outlook
- The aerial imaging industry is expected to increase significantly in North America and has a positive outlook worldwide.
- Aerial imaging technologies are being used by public and government organizations to produce 360-degree panoramic interfaces and for archaeological purposes. Throughout the projected period, this aspect is anticipated to support market expansion.
- High upfront investment costs are one of the key factors expected to limit the aerial imaging market's growth throughout the forecast period.
- To stay ahead of the competition, key enterprises must concentrate on developing new products, expanding their market reach, and keeping their prices competitive.
How CXOs Can Benefit from the Credence Research Aerial Imaging Market Report
The Credence Research Aerial Imaging Market Report provides CXOs with a comprehensive overview of the market, including:
- Market size and growth forecast: The report provides detailed estimates of the global aerial imaging market size, segmented by platform type, end-user industry, imaging type, resolution, application, delivery mode, and region. It also includes forecasts for the market through 2032 based on key trends and drivers.
- Market segmentation: The report segments the aerial imaging market by platform type, end-user industry, imaging type, resolution, application, delivery mode, and region. This segmentation provides CXOs with a granular understanding of the market and the opportunities in each segment.
- Competitive landscape:The report profiles the key players in the aerial imaging market and provides insights into their strategies, product offerings, and financial performance. This information can help CXOs to identify and assess their competition.
- Key trends and drivers:The report identifies and analyzes the key trends and drivers shaping the aerial imaging market. This information can help CXOs to make informed decisions about their investments and strategies.
CXOs can use the insights from the Credence Research Aerial Imaging Market Report to:
- Identify growth opportunities: The report can help CXOs identify new growth opportunities in the aerial imaging market. For example, the report identifies the growing demand for aerial imaging from surveying and mapping as a key opportunity.
- Make informed investment decisions: The report can help CXOs make informed investment decisions about aerial imaging. For example, the report provides insights into the key factors to consider when evaluating aerial imaging providers and selecting aerial imaging solutions.
- Develop competitive strategies: The report can help CXOs develop competitive strategies for their aerial imaging businesses. For example, the report identifies the key strategies that aerial imaging providers are using to differentiate themselves from their competitors.
- Track market developments: The report can help CXOs track market developments and stay ahead of the curve. For example, the report provides insights into the latest trends and innovations in the aerial imaging market.
Overall, the Credence Research Aerial Imaging Market Report is a valuable resource for CXOs who are looking to gain a deeper understanding of the market and identify growth opportunities.
Segmentation
- By Platform Type
- Satellite Imagery
- Unmanned Aerial Vehicles (UAVs) or Drones
- Fixed-Wing Aircraft
- Helicopters
- By End-User Industry
- Agriculture
- Construction and Infrastructure
- Environmental Monitoring
- Government and Defense
- Oil and Gas
- Real Estate
- GIS and Mapping
- By Imaging Type
- Vertical Imaging
- Oblique Imaging
- Multispectral Imaging
- Hyperspectral Imaging
- By Resolution
- Low Resolution
- Medium Resolution
- High Resolution
- Ultra-High Resolution
- By Application
- Surveying and Mapping
- Disaster Management
- Navigation and Tourism
- 3D Modeling
- By Delivery Mode
- GIS Platforms
- Licensed Software
- Cloud-Based Services
- By Region
- North America
- The U.S.
- Canada
- Mexico
- Europe
- Germany
- France
- The U.K.
- Italy
- Spain
- Rest of Europe
- Asia Pacific
- China
- Japan
- India
- South Korea
- South-east Asia
- Rest of Asia Pacific
- Latin America
- Brazil
- Argentina
- Rest of Latin America
- Middle East & Africa
- GCC Countries
- South Africa
- Rest of Middle East and Africa
- North America
Request a Free Sample
Fill in your details and we'll send you a free sample report.
- Sample data tables & charts
- Research methodology
Need a Custom Version of This Report?
Tailor the scope, geography, or segments to your exact requirements.
- Custom geography or segment scope
- Direct access to our analyst team
Frequently Asked Questions
How big is the global market for aerial imaging right now?
What is the projected growth rate of the aerial imaging market between 2024 and 2032?
Which market category is in the lead in platform type?
Regarding the end-user industry, which market category is in the lead?
Who are the key participants in the global market for aerial imaging?
Table of Content
Chapter 1. Report Introduction
- 1.1 Report Description & Purpose
- 1.1.1 Report Title & Market Definition
- 1.1.2 Unique Selling Propositions (USP) & Key Differentiators
- 1.1.3 Value Proposition for Stakeholders
- 1.2 Research Objectives
- 1.2.1 Market Sizing Objectives (Volume & Revenue)
- 1.2.2 Segmentation Objectives
- 1.2.3 Competitive Intelligence Objectives
- 1.2.4 Forecast & Scenario Objectives
- 1.3 Report Scope
- 1.3.1 Aerial Imaging Scope – Types & Subtypes Covered
- 1.3.2 Geographic Scope – Regions & Countries Covered
- 1.3.3 Historical Period, Base Year & Forecast Period (the historical period; forecast to the forecast period)
- 1.3.4 Inclusions & Exclusions
- 1.4 HS Code & Classification Framework
- 1.5 Currency, Units & Pricing Basis
- 1.6 Target Stakeholders
- 1.7 Limitations & Assumptions
Chapter 2. Executive Summary
- 2.1 Global Aerial Imaging Market Snapshot
- 2.1.1 Market Size – Historical (the historical period) & Forecast (the forecast period) (base year: USD 2,745.8 Million → forecast year: USD 9,509.24 Million)
- 2.1.2 Volume & Revenue – Global Totals
- 2.1.3 Key Market Highlights – Top Five Facts
- 2.2 Aerial Imaging Market Segmentation Snapshot
- 2.2.1 Market Split by Region – vs.
- 2.3 Competitive Snapshot
- 2.3.1 Top 10 Players by Revenue Share –
- 2.3.2 Top 10 Players by Volume Share –
- 2.3.3 Recent Strategic Developments (18-Month Summary)
- 2.4 Key Investment Highlights & Strategic Conclusions
Chapter 3. Aerial Imaging Market Dynamics & Industry Analysis
- 3.1 Market Overview & Context
- 3.1.1 Aerial Imaging Market Position in the Broader Automotive Value Chain
- 3.1.2 OEM vs. Replacement Market Dynamics
- 3.1.3 Market Maturity & Development Stage by Region
- 3.2 Aerial Imaging Market Drivers
- 3.3 Aerial Imaging Market Restraints & Challenges
- 3.4 Aerial Imaging Market Opportunities
- 3.5 Porter's Five Forces Analysis
- 3.5.1 Threat of New Entrants
- 3.5.2 Bargaining Power of Suppliers
- 3.5.3 Bargaining Power of Buyers
- 3.5.4 Threat of Substitutes
- 3.5.5 Competitive Rivalry – Intensity Assessment
- 3.6 Aerial Imaging Value Chain Analysis
- 3.6.1 Upstream – Raw Material/Input Suppliers
- 3.6.1.1 Raw Material/Input 1
- 3.6.1.2 Raw Material/Input 2
- 3.6.1.3 Raw Material/Input 3
- 3.6.2 Midstream – Production/Manufacturing/Service Delivery
- 3.6.2.1 Production/Process Overview
- 3.6.2.2 Key Facility Locations & Capacity by Manufacturer
- 3.6.3 Downstream – Distribution & End Consumer
- 3.6.3.1 Primary Channel – B2B/OEM
- 3.6.3.2 Secondary Channels – Dealer, Retail, Online, Direct
- 3.6.4 Value Chain Profitability Analysis
- 3.6.1 Upstream – Raw Material/Input Suppliers
- 3.7 PESTEL Analysis
- 3.7.1 Political Factors
- 3.7.2 Economic Factors
- 3.7.3 Social Factors
- 3.7.4 Technological Factors
- 3.7.5 Environmental Factors
- 3.7.6 Legal Factors
- 3.8 Aerial Imaging Supply Chain Analysis
- 3.8.1 Raw Material/Input Supply Risk Assessment
- 3.8.2 Manufacturing Concentration Risk (Geographic Exposure)
- 3.8.3 Trade Disruption Impact Analysis
- 3.9 Regulatory & Policy Landscape
Note: The regulatory and policy landscape section covers regulations based on their applicability to the market, Aerial Imaging category, geography, and scope of the study. Only regulatory frameworks with a material impact on operations, compliance, trade, sustainability, or market access are analyzed in detail.
Chapter 4. Key Investment Pockets & Opportunity Analysis
- 4.1 Aerial Imaging Market Attractiveness Analysis
- 4.1.1 By Region – Investment Attractiveness Matrix (Volume × CAGR)
- 4.2 Absolute Revenue Growth Opportunity
- 4.2.1 By Region – Absolute USD Growth Through the forecast period
- 4.3 Incremental Volume Opportunity
- 4.3.1 By Region – Incremental Volume Through the forecast period
- 4.3.2 Segment – Incremental Volume
- 4.4 Emerging Submarket Opportunity Deep Dive (Subject to Applicability)
- 4.5 Emerging Market Opportunity Scorecards
- 4.5.1 United States
- 4.5.2 Europe
- 4.5.3 Asia
- 4.5.4 Middle East & Africa
Note: Emerging Market Opportunity Scorecards will be included based on relevance and strategic importance. Regions listed are indicative and may vary depending on data availability and market dynamics.
Chapter 5. Aerial Imaging Import-Export Analysis & Trade Flows
- 5.1 Global Trade Overview
- 5.1.1 Global Export Value by Country (the historical period)
- 5.1.2 Global Export Volume by Country (the historical period)
- 5.1.3 Global Import Value by Country (the historical period)
- 5.1.4 Global Import Volume by Country (the historical period)
- 5.1.5 Net Trade Balance by Country (the historical period)
- 5.2 Export Analysis – Segment
- 5.2.1 Type 1 (HS Code)
- 5.2.2 Type 2 (HS Code)
- 5.2.3 Type 3 (HS Code)
- 5.2.4 Type 4 (HS Code)
- 5.2.5 Type 5 (HS Code)
- 5.3 Import Analysis – Segment
- 5.3.1 Type 1 (HS Code)
- 5.3.2 Type 2 (HS Code)
- 5.3.3 Type 3 (HS Code)
- 5.3.4 Type 4 (HS Code)
- 5.3.5 Type 5 (HS Code)
- 5.4 Average Unit Trade Prices
- 5.4.1 Average Export Price – Segment & Country
- 5.4.2 Average Import Price – Segment & Source Country
- 5.4.3 Price Trends (the historical period)
- 5.5 Key Trade Route Analysis
- 5.5.1 Trade Route 1
- 5.5.2 Trade Route 2
- 5.5.3 Trade Route 3
- 5.5.4 Trade Route 4
- 5.5.5 Trade Route 5
- 5.6 Trade Policy Impact Assessment
- 5.6.1 US Anti-Dumping & Section 301 Tariffs
- 5.6.2 EU Customs Union Impact
- 5.6.3 Major Free Trade Agreements
- 5.6.4 USMCA Rules of Origin
Note: Trade policy analysis will be included only where relevant to the Aerial Imaging market.
Chapter 6. Competitive Landscape & Company Benchmarking
- 6.1 Aerial Imaging Market Concentration & Structure
- 6.1.1 Herfindahl-Hirschman Index (HHI) – vs.
- 6.1.2 Tier 1, Tier 2 & Tier 3 Market Structure
- 6.1.3 Global, Regional & Local Player Dynamics
- 6.2 Aerial Imaging Market Share Analysis –
- 6.2.1 Global Revenue Share by Company
- 6.2.2 Global Volume Share by Company
- 6.2.3 Regional Revenue Share
- 6.2.4 Market Share Evolution ( vs. )
- 6.2.5 OEM Segment Share by Company
- 6.2.6 Replacement Segment Share by Company
- 6.3 Production/Delivery Capacity & Facility Analysis
- 6.3.1 Global Installed Capacity
- 6.3.2 Capacity Utilization Rates
- 6.3.3 Production/Output Volume
- 6.3.4 Facility Locations & Capacity Map
- 6.3.5 Planned Capacity Additions
- 6.4 Aerial Imaging Competitive Benchmarking Matrix
- 6.4.1 Revenue, Volume, CAGR & Profitability Comparison
- 6.4.2 Channel Revenue Mix
- 6.4.3 Geographic Revenue Exposure
- 6.4.4 R&D Intensity
- 6.4.5 Sustainability Maturity
- 6.5 Strategic Developments in Aerial Imaging (Last 24 Months)
- 6.5.1 Mergers, Acquisitions & Divestments
- 6.5.2 New Aerial Imaging Launches
- 6.5.3 Facility Expansions
- 6.5.4 Strategic Alliances, Joint Ventures & Partnerships
- 6.5.5 Distribution Expansion & Market Entry
- 6.5.6 Sustainability & ESG Initiatives
- 6.6 Competitive Strategy Mapping
- 6.6.1 Leader, Challenger, Follower & Niche Classification
- 6.6.2 Pricing Strategy Comparison
- 6.6.3 Channel Strategy Matrix
Note: Strategic developments are included based on their materiality and the availability of reliable information.
Chapter 7. Global Aerial Imaging Market – By Distribution Channel
- 7.1 Segment Overview
- 7.1.1 Volume & Revenue Split by Channel ( & )
- 7.1.2 Channel Mix Evolution (the forecast period)
Chapter 8. Regional Market Analysis – Global Overview
- 8.1 Global Regional Overview
- 8.1.1 Regional Volume Share
- 8.1.2 Regional Revenue Share
- 8.1.3 Regional Volume by Region
- 8.1.4 Regional Revenue by Region
- 8.1.5 Regional Forecast Through the forecast period
- 8.2 Cross-Regional Segment Analysis
- 8.2.1 By Distribution Channel
- 8.2.2 By Brand/Price Tier
Chapter 9. North America Aerial Imaging Market
- 9.1 United States
- 9.2 Canada
- 9.3 Mexico
Chapter 10. Europe Aerial Imaging Market
- 10.1 Germany
- 10.2 France
- 10.3 Italy
- 10.4 United Kingdom
- 10.5 Spain
- 10.6 Poland
- 10.7 Russia
- 10.8 Netherlands
- 10.9 Belgium
- 10.10 Sweden
- 10.11 Denmark
- 10.12 Norway
- 10.13 Rest of Europe
Chapter 11. Asia Pacific Aerial Imaging Market
- 11.1 China
- 11.2 India
- 11.3 Japan
- 11.4 South Korea
- 11.5 Thailand
- 11.6 Indonesia
- 11.7 Vietnam
- 11.8 Malaysia
- 11.9 Australia
- 11.10 Rest of Asia Pacific
Chapter 12. Latin America Aerial Imaging Market
- 12.1 Brazil
- 12.2 Argentina
- 12.3 Colombia
- 12.4 Chile
- 12.5 Rest of Latin America
Chapter 13. Middle East Aerial Imaging Market
- 13.1 Saudi Arabia
- 13.2 United Arab Emirates
- 13.3 Turkey
- 13.4 Israel
- 13.5 Iran
- 13.6 Rest of the Middle East
Chapter 14. Africa Aerial Imaging Market
- 14.1 South Africa
- 14.2 Egypt
- 14.3 Nigeria
- 14.4 Morocco
- 14.5 Rest of Africa
Chapter 15. Aerial Imaging Company Profiles
- 15.1 [Company 01]
- 15.1.1 Company Overview
- 15.1.2 Key Management Personnel
- 15.1.3 Products & Services Portfolio
- 15.1.4 Financial Performance
- 15.1.5 Key Market Focus & Geographic Presence
- 15.1.6 Recent Developments & Strategic Initiatives
Note: The company profile list is preliminary and may change based on research findings, market developments, data availability, and client requirements.
Chapter 16. Appendices
- Appendix A – List of Abbreviations & Acronyms
- Appendix B – Industry Classification Code Reference – Full Series
- Appendix C – Production & Capacity Data Tables
- Appendix D – End-Use & Demand Base Tables
- Appendix E – Consumption & Replacement Rate Assumptions
- Appendix F – ASP Reference Tables
- Appendix G – Manufacturing & Facility Database
- Appendix H – Import-Export Data Tables
- Appendix I – Regulatory Summary Tables
- Appendix J – Primary Research Participant List (Anonymized)
- Appendix K – Primary Research Questionnaire Framework
- Appendix L – Data Sources & Bibliography
- Appendix M – Market Size Divergence & Source Comparison
Chapter 17. Research Methodology
- 17.1 Research Framework & Philosophy
- 17.2 Secondary Research – Sources, Hierarchy & Data Extraction
- 17.3 Data Modeling – Bottom-Up & Top-Down Market Sizing
- 17.4 Primary Research – Stakeholder Framework, LOI & Sample Sizes
- 17.5 Forecast Methodology – Regression, Scenario & Sensitivity Analysis
- 17.6 Quality Control – Four-Layer Validation Framework
- 17.7 Limitations & Standard Assumptions
- 17.8 Disclaimer
