
Bioinformatics Market Overview:
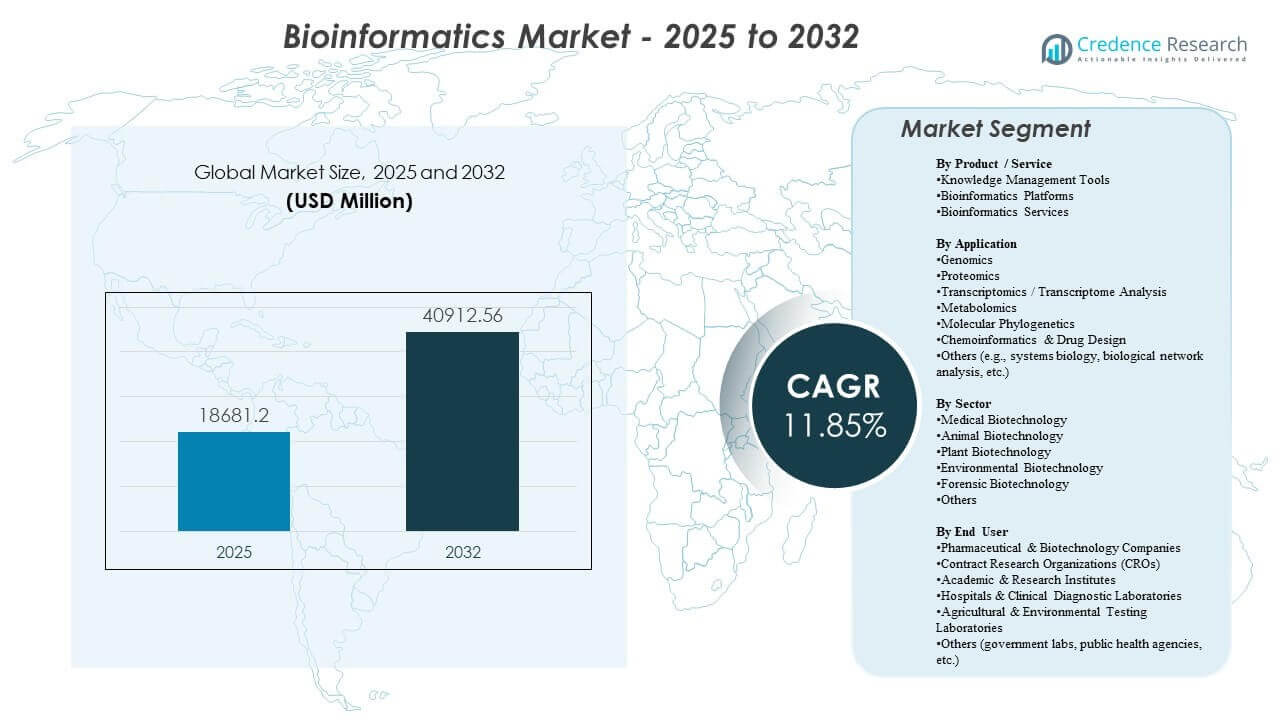
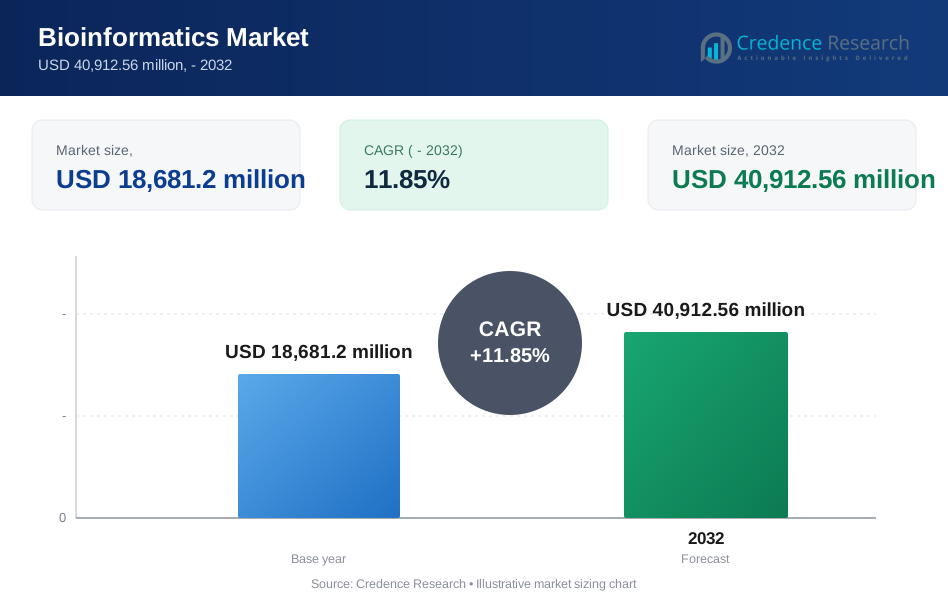
The global Bioinformatics Market size was estimated at USD 18681.2 million in 2025 and is expected to reach USD 40912.56 million by 2032, growing at a CAGR of 11.85% from 2025 to 2032. The strongest growth driver is the accelerating volume and complexity of genomics and multi-omics datasets across discovery research and clinical workflows, which increases demand for scalable data management, analysis pipelines, and interpretation. The bioinformatics market expansion is further supported by broader adoption of AI-enabled analytics, increasing cloud-based deployment of computational workloads, and the growing need to standardize data governance across distributed research ecosystems.
| REPORT ATTRIBUTE | DETAILS |
|---|---|
| Historical Period | 2020-2024 |
| Base Year | 2025 |
| Forecast Period | 2026-2032 |
| Bioinformatics Market Size 2025 | USD 18681.2 million |
| Bioinformatics Market, CAGR | 11.85% |
| Bioinformatics Market Size 2032 | USD 40912.56 million |
Key Market Trends & Insights
- The Bioinformatics Market is projected to expand from USD 18681.2 million to USD 40912.56 million, reflecting a 11.85% growth trajectory over the forecast window.
- North America accounted for the largest regional share of 44.80%, supported by strong biopharma R&D intensity and mature sequencing adoption.
- Knowledge Management Tools led the product/service landscape with a 34.8% share, reflecting demand for curated repositories, annotation, and governance-ready data organization.
- Genomics remained the leading application with a 35.6% share, driven by routine sequencing in research and expanding clinical testing volumes.
- Pharmaceutical & Biotechnology Companies represented the largest end-user group with a 45.3% share, reflecting sustained demand for scalable pipelines and decision-grade insights.
Segment Analysis
The bioinformatics market adoption profile is shaped by the practical need to store, harmonize, and interpret high-throughput biological data in a repeatable manner. Bioinformatics market workflows increasingly prioritize automation across ingestion, quality control, variant/protein annotation, and reporting, reducing turnaround times and improving reproducibility across multi-site teams. Bioinformatics market demand also benefits from expanding usage of integrated platforms that connect primary data generation, downstream analytics, and knowledge repositories under standardized governance.
The bioinformatics market also shows rising preference for scalable computing, collaborative environments, and modular pipelines that can be adapted across genomics, proteomics, and emerging multi-omics use cases. Bioinformatics market users increasingly evaluate solutions based on interoperability, integration with laboratory and clinical systems, and the ability to support regulated documentation and audit trails. Bioinformatics market competitive differentiation therefore centers on end-to-end workflow coverage, curated content depth, and flexibility across research and clinical-grade applications.
By Product / Service Insights
Knowledge Management Tools accounted for the largest share of 34.8% in 2025. Knowledge Management Tools leadership reflects the central requirement to organize, annotate, and govern rapidly growing datasets across distributed research and clinical environments. Knowledge Management Tools adoption is reinforced by the need to standardize metadata, enable dataset discoverability, and improve cross-team reuse of validated insights. Knowledge Management Tools also support compliance-ready documentation and versioning practices that strengthen reproducibility in bioinformatics market workflows.
By Application Insights
Genomics accounted for the largest share of 35.6% in 2025. Genomics demand remains strongest because sequencing programs generate continuous high-volume data requiring alignment, variant calling, annotation, and interpretation at scale. Genomics workflows also expand with broader adoption of precision medicine and population-scale projects that increase sample throughput and pipeline standardization requirements. Genomics leadership is further supported by the growing role of integrated analytics in biomarker discovery, patient stratification, and translational research programs.
By Sector Insights
Medical Biotechnology accounted for the largest share of 48.9% in 2025. Medical Biotechnology leadership is supported by high concentration of human health research activity across oncology, rare disease, infectious disease surveillance, and therapy development. Medical Biotechnology workflows require robust analytics for clinically relevant interpretation, longitudinal cohort analysis, and standardized reporting practices. Medical Biotechnology demand also benefits from investment in data-driven drug discovery and translational pipelines that depend on interoperable bioinformatics market infrastructure.
By End User Insights
Pharmaceutical & Biotechnology Companies accounted for the largest share of 45.3% in 2025. Pharmaceutical & Biotechnology Companies leadership reflects sustained demand for scalable analytics that supports discovery, preclinical validation, and translational decision-making. Pharmaceutical & Biotechnology Companies prioritize workflow standardization, collaboration, and integration of multi-omics evidence into program governance. Pharmaceutical & Biotechnology Companies adoption is further strengthened by the need to accelerate time-to-insight while maintaining traceability across complex datasets.
Bioinformatics Market Drivers
Expansion of genomics and multi-omics data generation
Bioinformatics market growth is strongly supported by the increasing volume of sequencing and multi-omics datasets produced across research and clinical settings. Higher throughput creates larger pipelines for ingestion, alignment, annotation, and interpretation, increasing recurring demand for platforms and services. Multi-omics strategies also raise integration complexity, increasing the value of workflow orchestration and standardized metadata. Bioinformatics market adoption therefore rises as data growth outpaces manual analytical capacity.
- For instance, Illumina’s NovaSeq X Plus platform can generate up to 16 Tb of sequencing data per run and has been ordered by customers in nearly 30 countries, enabling projects that process tens of thousands of whole genomes per year and dramatically expanding downstream bioinformatics workloads.
Rising use of bioinformatics in drug discovery and translational research
Bioinformatics market demand increases as drug discovery programs rely more on molecular evidence for target identification, biomarker mapping, and patient stratification. Bioinformatics market workflows help convert biological signals into decision-grade insights, improving portfolio prioritization and experimental design. Data-driven strategies also increase demand for curated reference content and knowledge graphs that connect biological entities and pathways. Bioinformatics market investments therefore grow with broader adoption of computational approaches in life science R&D.
Increasing clinical adoption of molecular testing and interpretation workflows
Bioinformatics market expansion is supported by the growing role of clinical genomics and molecular diagnostics across oncology and rare disease testing pathways. Clinical environments require standardized pipelines, quality control, interpretive support, and structured reporting, which increases demand for robust bioinformatics market solutions. Bioinformatics market needs are further reinforced by requirements for traceability, documentation, and audit readiness in regulated workflows. Wider test menu expansion therefore translates into higher analytic throughput demand.
Scaling of collaborative and cloud-enabled analytics environments
Bioinformatics market adoption benefits from increased use of scalable computing and collaborative environments that support multi-site teams and distributed data access. Bioinformatics market users increasingly prefer modular pipelines that can run consistently across projects while scaling compute on demand. Cloud-enabled approaches also support faster deployment cycles, better collaboration, and improved operational efficiency for high-throughput analysis. Bioinformatics market growth is supported as organizations modernize infrastructure and adopt standardized workflow frameworks.
- For instance, Google’s DeepVariant variant-calling pipeline, combined with the GLnexus cohort-processing framework, has been demonstrated to scale to population-level cohorts while maintaining high calibration and accuracy, and can efficiently leverage additional vCPUs in cloud environments to achieve near-linear speedups in processing time.
Bioinformatics Market Challenges
Bioinformatics market expansion faces constraints from data integration complexity across heterogeneous formats, instruments, and workflows. Bioinformatics market deployments often encounter friction in harmonizing metadata standards, maintaining consistent pipeline performance, and ensuring interoperability across systems. Bioinformatics market users also manage rising storage and compute costs as dataset volumes scale, increasing emphasis on cost governance and efficient workflow design.
Bioinformatics market adoption can be slowed by talent gaps in advanced analytics, pipeline engineering, and domain interpretation, especially in organizations scaling multi-omics programs. Bioinformatics market stakeholders also face governance hurdles tied to privacy, cross-border data handling, and compliance requirements that influence deployment models. Bioinformatics market solution selection therefore depends on balancing performance, usability, and governance readiness across research and clinical contexts.
- For instance, GA4GH prioritizes alignment of its genomics data standards with external health data standards such as HL7 and CDISC so hospitals and clinical research sponsors can adopt interoperable workflows that meet institutional compliance and operational requirements.
Bioinformatics Market Trends and Opportunities
Bioinformatics market product roadmaps increasingly emphasize AI-enabled interpretation, automation of repetitive pipeline stages, and decision support aligned to clinical and translational outcomes. Bioinformatics market opportunity rises for platforms that combine curated content, scalable computation, and reproducible workflows within governed environments. Bioinformatics market buyers also value interoperability with laboratory and clinical systems, strengthening demand for integration-ready solutions.
- For instance, Lifebit’s federated Trusted Research Environment securely manages over 270 million patient records across more than 30 countries for institutions such as NIH and Genomics England, enabling governed, in-place analysis without data leaving local cloud environments.
Bioinformatics market opportunity is also expanding in workflow standardization for multi-omics integration, enabling cross-evidence modeling across genomics, proteomics, and transcriptomics. Bioinformatics market growth can accelerate where solutions reduce time-to-insight and support collaboration across sponsors, CROs, and research partners. Bioinformatics market vendors that deliver modular pipelines, robust governance controls, and rapid deployment paths can capture higher adoption in scaling environments.
Regional Insights
North America (44.80%)
North America leads the bioinformatics market due to a high concentration of sequencing programs, mature biopharma R&D ecosystems, and strong adoption of advanced analytics workflows. Demand is reinforced by enterprise-scale pipeline standardization across discovery and clinical settings, along with emphasis on interoperability, governance controls, and scalable deployment models for regulated use. As a result, the region maintains the largest installed base for platforms, services, and bio-content solutions.
Europe (23.90%)
Europe holds a strong share supported by established research infrastructure, public genomics initiatives, and a mature biotech and pharmaceutical footprint. Adoption is strengthened by focus on standardized data governance, reproducibility, and cross-institution collaboration, with additional momentum from expanding precision medicine programs and multi-omics research networks. These conditions sustain broad demand across academic, clinical, and enterprise environments.
Asia Pacific (22.40%)
Asia Pacific shows fast adoption driven by expanding sequencing capacity, growing biopharma investment, and increasing clinical genomics activity in large population markets. Growth is reinforced by scaling multi-omics research programs, rising demand for scalable computing, and modernization of analytics infrastructure through standardized pipelines. The region continues to narrow the gap with mature markets as implementation moves from pilots to wider institutional deployment.
Latin America (5.70%)
Latin America adoption remains selective, with deployments concentrated in leading research hubs and larger private diagnostics environments. Key constraints include uneven infrastructure and variable access to specialized expertise, although gradual expansion of molecular testing and improving availability of analytics tools are supporting uptake. The region remains smaller in share but shows localized growth pockets where sequencing and clinical testing capacity is expanding.
Middle East & Africa (3.20%)
Middle East & Africa participation is emerging, supported by national initiatives, reference laboratory modernization, and targeted investments in genomics capabilities. Adoption remains constrained by smaller installed bases and variable infrastructure depth, but opportunity is strongest where centralized programs standardize workflows and scale analytics across public health and clinical applications. This keeps the region the smallest share while preserving meaningful long-term growth potential.
Competitive Landscape
Bioinformatics market competition centers on end-to-end workflow coverage, scalability across high-throughput datasets, and differentiation through curated content depth, automation, and interoperability. Bioinformatics market participants compete on reproducibility, pipeline flexibility, collaboration features, and governance readiness for research and clinical settings. Bioinformatics market differentiation is also shaped by integration with sequencing ecosystems, cloud deployment maturity, and speed of implementation in operational environments.
Illumina Inc. remains a prominent participant through emphasis on genomics ecosystem enablement and downstream analytical workflow integration aligned to sequencing-driven use cases. Bioinformatics market positioning for Illumina Inc. is supported by alignment to high-throughput sequencing demand and the need for standardized analysis and interpretation pipelines. Bioinformatics market engagement also benefits from partnerships and workflow integrations that reduce friction between data generation and actionable insights. Bioinformatics market adoption strengthens when the Illumina Inc. ecosystem supports scalable, reproducible analytics across research and clinical workflows.
The industry research and growth report includes detailed analyses of the competitive landscape of the market and information about key companies, including:
- Illumina Inc.
- Thermo Fisher Scientific Inc.
- QIAGEN N.V.
- BGI Genomics (BGI Group)
- Agilent Technologies Inc.
- PerkinElmer Inc. (Revvity)
- F. Hoffmann-La Roche Ltd (Roche)
- Eurofins Scientific
- GENEWIZ (Azenta Life Sciences)
- DNAnexus
- Seven Bridges Genomics
- Genedata
- SOPHiA GENETICS
- Labcorp
Qualitative and quantitative analysis of companies has been conducted to help clients understand the wider business environment as well as the strengths and weaknesses of key industry players. Data is qualitatively analyzed to capture market trends and growth drivers, while quantitative analysis is used to highlight strategic performance, market positioning, and competitive intensity.
Recent Developments
- In January 2026, Illumina, Inc. launched Illumina Connected Multiomics, a new cloud-based research software platform designed to analyze and visualize large-scale multiomic and multimodal biological data, integrating genomics, transcriptomics, proteomics, epigenetics, and more to streamline bioinformatics workflows for researchers.
- In September 2025, SeqOne revealed that it had entered into a definitive agreement to acquire Congenica, creating a major global player in AI-powered genomic medicine software by combining SeqOne’s NGS analysis platform with Congenica’s clinical decision support technology and interpretation services.
- In May 2025, QIAGEN disclosed its acquisition of Israeli AI genomics startup Genoox, integrating Genoox’s Franklin AI-powered clinical decision support platform into QIAGEN’s portfolio to enhance bioinformatics-driven genetic testing insights for clinical laboratories.
- In March 2025, Cmbio® announced the acquisition of Eagle Genomics’ enterprise cloud platform e[datascientist]™, a move that strengthens Cmbio’s digital biology and bioinformatics capabilities by adding advanced AI- and ML-driven multi-omics data management and analysis tools to its portfolio.
Report Scope
| Report Attribute | Details |
| Market size value in 2025 | USD 18681.2 million |
| Revenue forecast in 2032 | USD 40912.56 million |
| Growth rate (CAGR) | 11.85% (2025–2032) |
| Base year | 2025 |
| Forecast period | 2026–2032 |
| Quantitative units | USD million |
| Segments covered | By Product / Service Outlook: Knowledge Management Tools, Bioinformatics Platforms, Bioinformatics Services, Biocontent; By Application Outlook: Genomics, Proteomics, Transcriptomics / Transcriptome Analysis, Metabolomics, Molecular Phylogenetics, Chemoinformatics & Drug Design, Others; By Sector Outlook: Medical Biotechnology, Animal Biotechnology, Plant Biotechnology, Environmental Biotechnology, Forensic Biotechnology, Others; By End User Outlook: Pharmaceutical & Biotechnology Companies, Contract Research Organizations (CROs), Academic & Research Institutes, Hospitals & Clinical Diagnostic Laboratories, Agricultural & Environmental Testing Laboratories, Others |
| Regional scope | North America, Europe, Asia Pacific, Latin America, Middle East & Africa |
| Key companies profiled | Illumina Inc., Thermo Fisher Scientific Inc., QIAGEN N.V., BGI Genomics (BGI Group), Agilent Technologies Inc., PerkinElmer Inc. (Revvity), F. Hoffmann-La Roche Ltd (Roche), Eurofins Scientific, GENEWIZ (Azenta Life Sciences), DNAnexus, Seven Bridges Genomics, Genedata, SOPHiA GENETICS, Labcorp |
| No. of Pages | 332 |
Segmentation
By Product / Service
- Knowledge Management Tools
- Bioinformatics Platforms
- Bioinformatics Services
- Biocontent
By Application
- Genomics
- Proteomics
- Transcriptomics / Transcriptome Analysis
- Metabolomics
- Molecular Phylogenetics
- Chemoinformatics & Drug Design
- Others [systems biology, biological network analysis, others]
By Sector
- Medical Biotechnology
- Animal Biotechnology
- Plant Biotechnology
- Environmental Biotechnology
- Forensic Biotechnology
- Others
By End User
- Pharmaceutical & Biotechnology Companies
- Contract Research Organizations (CROs)
- Academic & Research Institutes
- Hospitals & Clinical Diagnostic Laboratories
- Agricultural & Environmental Testing Laboratories
- Others [government labs, public health agencies, others]
By Region
- North America
- U.S.
- Canada
- Mexico
- Europe
- Germany
- France
- U.K.
- Italy
- Spain
- Rest of Europe
- Asia Pacific
- China
- Japan
- India
- South Korea
- South-east Asia
- Rest of Asia Pacific
- Latin America
- Brazil
- Argentina
- Rest of Latin America
- Middle East & Africa
- GCC Countries
- South Africa
- Rest of the Middle East and Africa
Request a Free Sample
Fill in your details and we'll send you a free sample report.
- Sample data tables & charts
- Research methodology
Need a Custom Version of This Report?
Tailor the scope, geography, or segments to your exact requirements.
- Custom geography or segment scope
- Direct access to our analyst team
Frequently Asked Questions
What is the current size of the Bioinformatics Market?
What is the forecast value of the Bioinformatics Market?
What is the CAGR of the Bioinformatics Market?
Which segment leads the Bioinformatics Market by product/service?
Who are the leading companies operating in the Bioinformatics Market?
Which region leads the Bioinformatics Market?
Table of Content
Chapter 1. Report Introduction
- 1.1 Report Description & Purpose
- 1.1.1 Report Title & Market Definition
- 1.1.2 Unique Selling Propositions (USP) & Key Differentiators
- 1.1.3 Value Proposition for Stakeholders
- 1.2 Research Objectives
- 1.2.1 Market Sizing Objectives (Volume & Revenue)
- 1.2.2 Segmentation Objectives
- 1.2.3 Competitive Intelligence Objectives
- 1.2.4 Forecast & Scenario Objectives
- 1.3 Report Scope
- 1.3.1 Bioinformatics Scope – Types & Subtypes Covered
- 1.3.2 Geographic Scope – Regions & Countries Covered
- 1.3.3 Historical Period, Base Year & Forecast Period (the historical period; forecast to 2032)
- 1.3.4 Inclusions & Exclusions
- 1.4 HS Code & Classification Framework
- 1.5 Currency, Units & Pricing Basis
- 1.6 Target Stakeholders
- 1.7 Limitations & Assumptions
Chapter 2. Executive Summary
- 2.1 Global Bioinformatics Market Snapshot
- 2.1.1 Market Size – Historical (the historical period) & Forecast (2032) (base year: USD 18,681.2 million → 2032: USD 40,912.56 million)
- 2.1.2 Volume & Revenue – Global Totals
- 2.1.3 Key Market Highlights – Top Five Facts
- 2.2 Bioinformatics Market Segmentation Snapshot
- 2.2.1 Market Split by Region – vs. 2032
- 2.3 Competitive Snapshot
- 2.3.1 Top 10 Players by Revenue Share –
- 2.3.2 Top 10 Players by Volume Share –
- 2.3.3 Recent Strategic Developments (18-Month Summary)
- 2.4 Key Investment Highlights & Strategic Conclusions
Chapter 3. Bioinformatics Market Dynamics & Industry Analysis
- 3.1 Market Overview & Context
- 3.1.1 Bioinformatics Market Position in the Broader Automotive Value Chain
- 3.1.2 OEM vs. Replacement Market Dynamics
- 3.1.3 Market Maturity & Development Stage by Region
- 3.2 Bioinformatics Market Drivers
- 3.3 Bioinformatics Market Restraints & Challenges
- 3.4 Bioinformatics Market Opportunities
- 3.5 Porter's Five Forces Analysis
- 3.5.1 Threat of New Entrants
- 3.5.2 Bargaining Power of Suppliers
- 3.5.3 Bargaining Power of Buyers
- 3.5.4 Threat of Substitutes
- 3.5.5 Competitive Rivalry – Intensity Assessment
- 3.6 Bioinformatics Value Chain Analysis
- 3.6.1 Upstream – Raw Material/Input Suppliers
- 3.6.1.1 Raw Material/Input 1
- 3.6.1.2 Raw Material/Input 2
- 3.6.1.3 Raw Material/Input 3
- 3.6.2 Midstream – Production/Manufacturing/Service Delivery
- 3.6.2.1 Production/Process Overview
- 3.6.2.2 Key Facility Locations & Capacity by Manufacturer
- 3.6.3 Downstream – Distribution & End Consumer
- 3.6.3.1 Primary Channel – B2B/OEM
- 3.6.3.2 Secondary Channels – Dealer, Retail, Online, Direct
- 3.6.4 Value Chain Profitability Analysis
- 3.6.1 Upstream – Raw Material/Input Suppliers
- 3.7 PESTEL Analysis
- 3.7.1 Political Factors
- 3.7.2 Economic Factors
- 3.7.3 Social Factors
- 3.7.4 Technological Factors
- 3.7.5 Environmental Factors
- 3.7.6 Legal Factors
- 3.8 Bioinformatics Supply Chain Analysis
- 3.8.1 Raw Material/Input Supply Risk Assessment
- 3.8.2 Manufacturing Concentration Risk (Geographic Exposure)
- 3.8.3 Trade Disruption Impact Analysis
- 3.9 Regulatory & Policy Landscape
Note: The regulatory and policy landscape section covers regulations based on their applicability to the market, Bioinformatics category, geography, and scope of the study. Only regulatory frameworks with a material impact on operations, compliance, trade, sustainability, or market access are analyzed in detail.
Chapter 4. Key Investment Pockets & Opportunity Analysis
- 4.1 Bioinformatics Market Attractiveness Analysis
- 4.1.1 By Region – Investment Attractiveness Matrix (Volume × CAGR)
- 4.2 Absolute Revenue Growth Opportunity
- 4.2.1 By Region – Absolute USD Growth Through 2032
- 4.3 Incremental Volume Opportunity
- 4.3.1 By Region – Incremental Volume Through 2032
- 4.3.2 Segment – Incremental Volume
- 4.4 Emerging Submarket Opportunity Deep Dive (Subject to Applicability)
- 4.5 Emerging Market Opportunity Scorecards
- 4.5.1 United States
- 4.5.2 Europe
- 4.5.3 Asia
- 4.5.4 Middle East & Africa
Note: Emerging Market Opportunity Scorecards will be included based on relevance and strategic importance. Regions listed are indicative and may vary depending on data availability and market dynamics.
Chapter 5. Bioinformatics Import-Export Analysis & Trade Flows
- 5.1 Global Trade Overview
- 5.1.1 Global Export Value by Country (the historical period)
- 5.1.2 Global Export Volume by Country (the historical period)
- 5.1.3 Global Import Value by Country (the historical period)
- 5.1.4 Global Import Volume by Country (the historical period)
- 5.1.5 Net Trade Balance by Country (the historical period)
- 5.2 Export Analysis – Segment
- 5.2.1 Type 1 (HS Code)
- 5.2.2 Type 2 (HS Code)
- 5.2.3 Type 3 (HS Code)
- 5.2.4 Type 4 (HS Code)
- 5.2.5 Type 5 (HS Code)
- 5.3 Import Analysis – Segment
- 5.3.1 Type 1 (HS Code)
- 5.3.2 Type 2 (HS Code)
- 5.3.3 Type 3 (HS Code)
- 5.3.4 Type 4 (HS Code)
- 5.3.5 Type 5 (HS Code)
- 5.4 Average Unit Trade Prices
- 5.4.1 Average Export Price – Segment & Country
- 5.4.2 Average Import Price – Segment & Source Country
- 5.4.3 Price Trends (the historical period)
- 5.5 Key Trade Route Analysis
- 5.5.1 Trade Route 1
- 5.5.2 Trade Route 2
- 5.5.3 Trade Route 3
- 5.5.4 Trade Route 4
- 5.5.5 Trade Route 5
- 5.6 Trade Policy Impact Assessment
- 5.6.1 US Anti-Dumping & Section 301 Tariffs
- 5.6.2 EU Customs Union Impact
- 5.6.3 Major Free Trade Agreements
- 5.6.4 USMCA Rules of Origin
Note: Trade policy analysis will be included only where relevant to the Bioinformatics market.
Chapter 6. Competitive Landscape & Company Benchmarking
- 6.1 Bioinformatics Market Concentration & Structure
- 6.1.1 Herfindahl-Hirschman Index (HHI) – vs.
- 6.1.2 Tier 1, Tier 2 & Tier 3 Market Structure
- 6.1.3 Global, Regional & Local Player Dynamics
- 6.2 Bioinformatics Market Share Analysis –
- 6.2.1 Global Revenue Share by Company
- 6.2.2 Global Volume Share by Company
- 6.2.3 Regional Revenue Share
- 6.2.4 Market Share Evolution ( vs. )
- 6.2.5 OEM Segment Share by Company
- 6.2.6 Replacement Segment Share by Company
- 6.3 Production/Delivery Capacity & Facility Analysis
- 6.3.1 Global Installed Capacity
- 6.3.2 Capacity Utilization Rates
- 6.3.3 Production/Output Volume
- 6.3.4 Facility Locations & Capacity Map
- 6.3.5 Planned Capacity Additions
- 6.4 Bioinformatics Competitive Benchmarking Matrix
- 6.4.1 Revenue, Volume, CAGR & Profitability Comparison
- 6.4.2 Channel Revenue Mix
- 6.4.3 Geographic Revenue Exposure
- 6.4.4 R&D Intensity
- 6.4.5 Sustainability Maturity
- 6.5 Strategic Developments in Bioinformatics (Last 24 Months)
- 6.5.1 Mergers, Acquisitions & Divestments
- 6.5.2 New Bioinformatics Launches
- 6.5.3 Facility Expansions
- 6.5.4 Strategic Alliances, Joint Ventures & Partnerships
- 6.5.5 Distribution Expansion & Market Entry
- 6.5.6 Sustainability & ESG Initiatives
- 6.6 Competitive Strategy Mapping
- 6.6.1 Leader, Challenger, Follower & Niche Classification
- 6.6.2 Pricing Strategy Comparison
- 6.6.3 Channel Strategy Matrix
Note: Strategic developments are included based on their materiality and the availability of reliable information.
Chapter 7. Global Bioinformatics Market – By Distribution Channel
- 7.1 Segment Overview
- 7.1.1 Volume & Revenue Split by Channel ( & 2032)
- 7.1.2 Channel Mix Evolution (2032)
Chapter 8. Regional Market Analysis – Global Overview
- 8.1 Global Regional Overview
- 8.1.1 Regional Volume Share
- 8.1.2 Regional Revenue Share
- 8.1.3 Regional Volume by Region
- 8.1.4 Regional Revenue by Region
- 8.1.5 Regional Forecast Through 2032
- 8.2 Cross-Regional Segment Analysis
- 8.2.1 By Distribution Channel
- 8.2.2 By Brand/Price Tier
Chapter 9. North America Bioinformatics Market
- 9.1 United States
- 9.2 Canada
- 9.3 Mexico
Chapter 10. Europe Bioinformatics Market
- 10.1 Germany
- 10.2 France
- 10.3 Italy
- 10.4 United Kingdom
- 10.5 Spain
- 10.6 Poland
- 10.7 Russia
- 10.8 Netherlands
- 10.9 Belgium
- 10.10 Sweden
- 10.11 Denmark
- 10.12 Norway
- 10.13 Rest of Europe
Chapter 11. Asia Pacific Bioinformatics Market
- 11.1 China
- 11.2 India
- 11.3 Japan
- 11.4 South Korea
- 11.5 Thailand
- 11.6 Indonesia
- 11.7 Vietnam
- 11.8 Malaysia
- 11.9 Australia
- 11.10 Rest of Asia Pacific
Chapter 12. Latin America Bioinformatics Market
- 12.1 Brazil
- 12.2 Argentina
- 12.3 Colombia
- 12.4 Chile
- 12.5 Rest of Latin America
Chapter 13. Middle East Bioinformatics Market
- 13.1 Saudi Arabia
- 13.2 United Arab Emirates
- 13.3 Turkey
- 13.4 Israel
- 13.5 Iran
- 13.6 Rest of the Middle East
Chapter 14. Africa Bioinformatics Market
- 14.1 South Africa
- 14.2 Egypt
- 14.3 Nigeria
- 14.4 Morocco
- 14.5 Rest of Africa
Chapter 15. Bioinformatics Company Profiles
- 15.1 [Company 01]
- 15.1.1 Company Overview
- 15.1.2 Key Management Personnel
- 15.1.3 Products & Services Portfolio
- 15.1.4 Financial Performance
- 15.1.5 Key Market Focus & Geographic Presence
- 15.1.6 Recent Developments & Strategic Initiatives
Note: The company profile list is preliminary and may change based on research findings, market developments, data availability, and client requirements.
Chapter 16. Appendices
- Appendix A – List of Abbreviations & Acronyms
- Appendix B – Industry Classification Code Reference – Full Series
- Appendix C – Production & Capacity Data Tables
- Appendix D – End-Use & Demand Base Tables
- Appendix E – Consumption & Replacement Rate Assumptions
- Appendix F – ASP Reference Tables
- Appendix G – Manufacturing & Facility Database
- Appendix H – Import-Export Data Tables
- Appendix I – Regulatory Summary Tables
- Appendix J – Primary Research Participant List (Anonymized)
- Appendix K – Primary Research Questionnaire Framework
- Appendix L – Data Sources & Bibliography
- Appendix M – Market Size Divergence & Source Comparison
Chapter 17. Research Methodology
- 17.1 Research Framework & Philosophy
- 17.2 Secondary Research – Sources, Hierarchy & Data Extraction
- 17.3 Data Modeling – Bottom-Up & Top-Down Market Sizing
- 17.4 Primary Research – Stakeholder Framework, LOI & Sample Sizes
- 17.5 Forecast Methodology – Regression, Scenario & Sensitivity Analysis
- 17.6 Quality Control – Four-Layer Validation Framework
- 17.7 Limitations & Standard Assumptions
- 17.8 Disclaimer
