
Virtual Reality (VR) Market Overview:
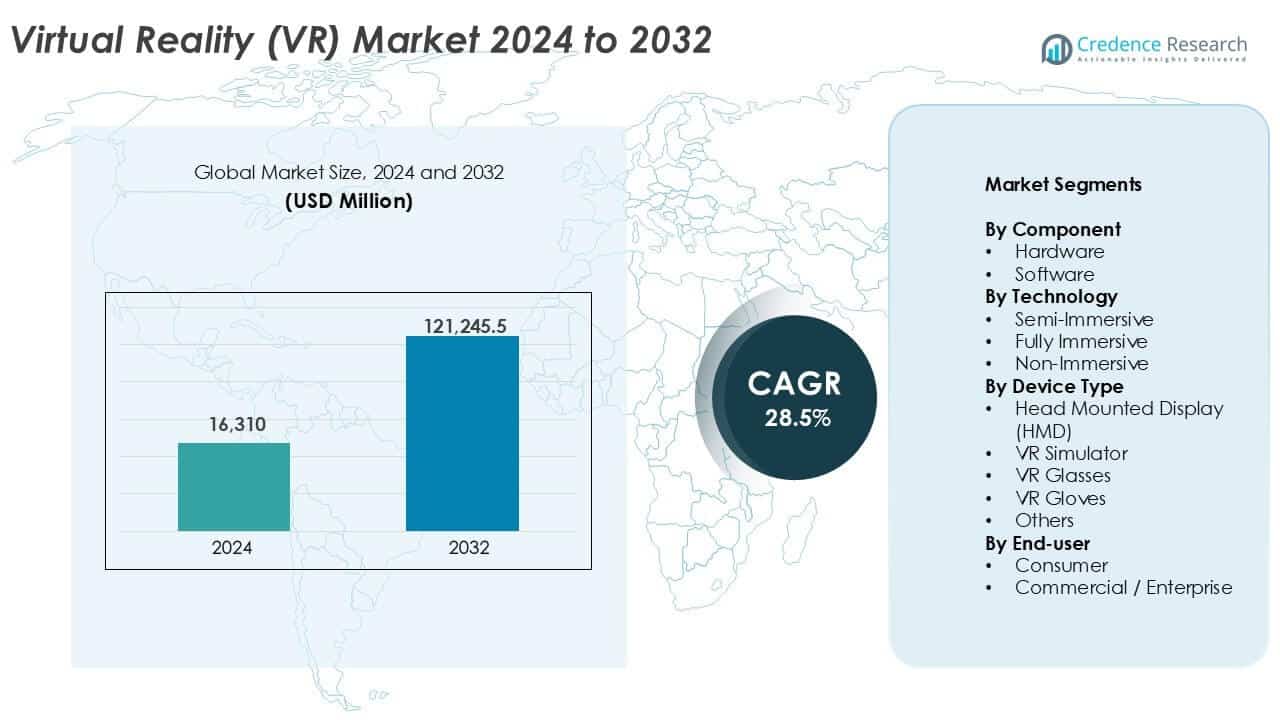
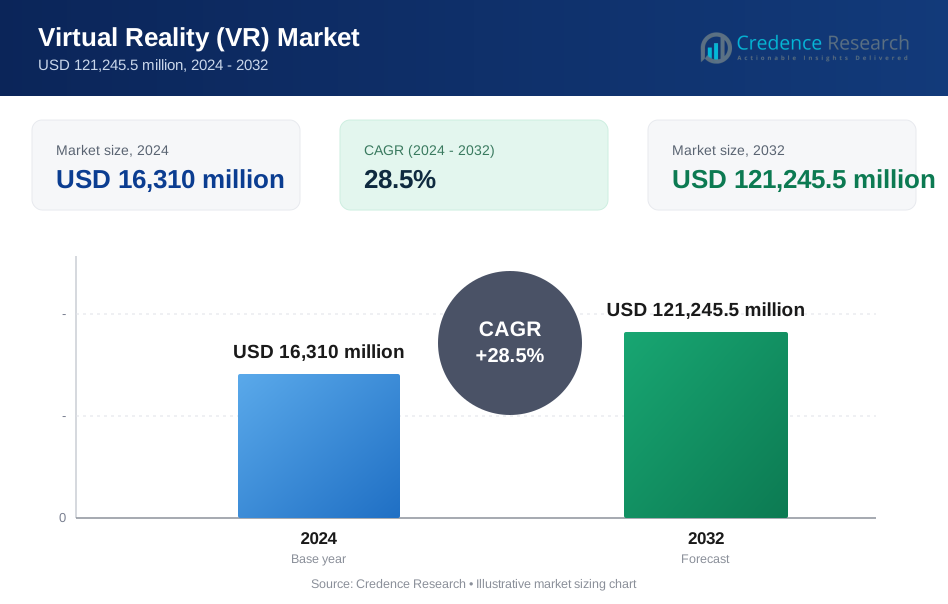
The Virtual Reality (VR) market size was valued at USD 16,310 million in 2024 and is anticipated to reach USD 121,245.5 million by 2032, growing at a CAGR of 28.5% during the forecast period.
| REPORT ATTRIBUTE | DETAILS |
|---|---|
| Historical Period | 2020-2024 |
| Base Year | 2025 |
| Forecast Period | 2026-2032 |
| Virtual Reality (VR) Market Size 2024 | USD 16,310 million |
| Virtual Reality (VR) Market, CAGR | 28.5% |
| Virtual Reality (VR) Market Size 2032 | USD 121,245.5 million |
Virtual Reality (VR) Market Insights
- Rising adoption of VR in gaming, healthcare, and enterprise training drives market expansion. Consumer interest in immersive entertainment and enterprise demand for simulation-based learning boost hardware and software sales.
- Major trends include growing use of standalone wireless headsets, AI-integrated virtual environments, and VR-based collaboration tools. These innovations widen use cases across education, design, and retail.
- Leading companies include Meta Platforms, HTC Corp., Microsoft, and Samsung Electronics. Competitive advantage centers on display quality, ecosystem support, and haptics integration.
- North America leads the market with 35% share, followed by Asia Pacific at 30%, driven by tech innovation and government support. The hardware segment dominates with 65% share, led by head-mounted displays used in gaming and enterprise sectors.
Virtual Reality (VR) Market Segmentation Analysis:
By Component
The hardware segment dominates the VR market, accounting for over 65% share in 2024. High-cost items like head-mounted displays, sensors, and motion trackers drive hardware revenue. Growth in consumer gaming and enterprise training applications fuels demand for immersive devices. Key drivers include falling hardware prices, increasing availability of standalone VR headsets, and expanding content compatibility. Innovations in 6DoF tracking and wireless connectivity further enhance user experience. Meanwhile, the software segment grows steadily, supported by content development, simulation platforms, and collaborative VR environments across education, defense, and design sectors.
- For instance, Meta Quest 3 uses dual displays with 2,064 × 2,208 pixels per eye and supports inside-out 6DoF tracking with four cameras.
By Technology
Fully immersive VR led the market with over 55% share in 2024, driven by demand for high-fidelity user experiences. It offers deeper engagement through spatial audio, 3D visuals, and motion tracking, making it ideal for gaming, simulation, and training. Enterprises adopt this technology for realistic safety drills and design visualization. Semi-immersive VR follows closely, especially in healthcare and education, due to its lower setup cost. Non-immersive VR, while limited in sensory feedback, still finds use in desktop-based simulation and virtual tours, maintaining relevance in budget-sensitive applications.
- For instance, Varjo XR-3 combines human-eye resolution of 70 pixels per degree in the focus area with integrated LiDAR depth sensing up to 20 meters.
By Device Type
Head Mounted Displays (HMDs) held the largest share, contributing over 45% of global VR device sales in 2024. This dominance stems from their use in gaming, military training, and industrial prototyping. Leading manufacturers offer standalone and PC-tethered variants with enhanced resolution, comfort, and mobility. VR simulators ranked second, gaining traction in automotive and aviation sectors for cost-effective training. VR glasses and gloves also saw adoption in consumer and healthcare applications, supporting gesture control and lightweight wearability. The “Others” category includes treadmills and suits, which grow slowly due to niche usage and high costs.
Key Growth Drivers
Rising Adoption of VR in Gaming and Entertainment
The gaming and entertainment sector remains the strongest growth driver for the VR market. Consumers seek deeper engagement through realistic visuals, spatial audio, and interactive environments. VR gaming platforms deliver immersive gameplay that traditional screens cannot match. Major studios invest in VR-first titles to boost user retention. Esports and social VR experiences expand multiplayer adoption. Location-based entertainment centers also deploy VR for arcade gaming and virtual attractions. Lower headset prices improve consumer access. Standalone headsets reduce dependency on high-end PCs. Content libraries continue to expand across genres. These factors sustain strong demand from casual and professional gamers. Entertainment companies use VR for virtual concerts and live events. This driver supports recurring hardware upgrades and software revenue.
- For instance, Meta reported over 500 VR titles available on the Quest platform with several exceeding 1 million downloads each.
Expanding Enterprise Use Across Training and Simulation
Enterprises increasingly adopt VR for training, simulation, and operational planning. VR enables safe, repeatable, and cost-efficient training environments. Industries like defense, aviation, healthcare, and manufacturing benefit the most. Medical institutions use VR for surgical training and therapy simulations. Manufacturers deploy VR for assembly training and process optimization. Defense agencies rely on VR for combat and mission readiness drills. Remote training needs accelerate adoption across global workforces. VR reduces travel and downtime costs. Performance tracking improves skill assessment accuracy. Enterprises value consistent training outcomes across locations. This driver strengthens demand for high-end hardware and customized software platforms.
- For instance, Walmart trained over 1 million associates using VR modules developed with Strivr across nearly 4,700 U.S. store locations to improve operational readiness.
Growth of VR in Education and Remote Collaboration
Educational institutions adopt VR to improve learning engagement and outcomes. Virtual classrooms support experiential learning beyond textbooks. Students explore complex subjects through 3D visualization. STEM education benefits from interactive simulations. Universities use VR for virtual labs and campus tours. Corporate teams adopt VR for remote collaboration and design reviews. Virtual workspaces improve team interaction across geographies. The rise of hybrid work supports this shift. VR enhances focus compared to video conferencing tools. Platform providers develop collaboration-focused VR software. This driver expands adoption beyond entertainment into daily professional use.
Key Trend & Opportunities
Shift Toward Standalone and Wireless VR Devices
The market shows a clear shift toward standalone and wireless VR devices. These devices remove the need for external PCs or cables. Users gain better mobility and comfort. Consumer adoption rises due to ease of use. Enterprises prefer portable systems for training deployment. Battery efficiency and onboard processing continue to improve. Chipmakers optimize processors for VR workloads. This trend lowers total ownership costs. Developers design content optimized for standalone platforms. Emerging markets benefit from simplified setups. This opportunity supports mass-market penetration and faster adoption cycles.
- For instance, Meta Quest 3 runs on Snapdragon XR2 Gen 2 with 8 GB RAM and delivers up to 2.5 hours of active use per charge.
Integration of VR with AI and Digital Twins
VR increasingly integrates with artificial intelligence and digital twin platforms. AI improves object recognition and adaptive environments. Digital twins allow real-time simulation of physical assets. Industries use this combination for design and predictive maintenance. Smart factories adopt VR-based monitoring systems. Healthcare providers use AI-driven VR for personalized therapy. Training simulations adapt to user performance. This trend enhances realism and decision-making value. It opens new revenue streams in industrial and enterprise markets. Vendors offering integrated solutions gain competitive advantage.
Key Challenges
High Cost of Advanced VR Hardware and Content
High upfront costs remain a major challenge for VR adoption. Advanced headsets and accessories remain expensive for many users. Enterprise-grade systems require additional software customization. Content development costs stay high due to technical complexity. Small developers face funding constraints. Consumers delay upgrades due to price sensitivity. Emerging markets face affordability barriers. Maintenance and replacement costs add to ownership burden. This challenge slows mass adoption in price-sensitive regions. Vendors must balance innovation with cost efficiency. Cost reduction remains critical for sustained growth.
User Comfort, Health, and Technical Limitations
User comfort and health concerns limit extended VR usage. Motion sickness affects some users during immersive experiences. Heavy headsets cause physical fatigue. Display resolution and field-of-view limits reduce realism. Latency issues impact user experience. Content optimization remains inconsistent across devices. Long-term health effects still require research validation. These concerns affect consumer trust and enterprise deployment. Developers work on lighter designs and better optics. Solving these issues is essential for long-duration and professional use.
Regional Analysis
North America
North America held the largest share of the global VR market in 2024, accounting for over 35% of total revenue. The region benefits from strong consumer electronics penetration, advanced digital infrastructure, and a well-established gaming industry. U.S.-based tech giants drive innovation in both hardware and software. High adoption in enterprise training, education, and healthcare further fuels demand. Government support for defense simulation and virtual therapy programs adds to growth. Increasing investments in immersive media and the rise of location-based VR centers also support expansion. Continued leadership in content development and R&D strengthens the region's global influence.
Europe
Europe accounted for nearly 25% of the global VR market in 2024, led by countries like Germany, the UK, and France. The region sees high enterprise adoption in automotive, manufacturing, and healthcare training applications. VR is used extensively in design visualization and simulation workflows. Cultural institutions and educational sectors adopt VR for immersive learning and virtual museum tours. EU funding programs support research in AR/VR technologies. Growing consumer interest in gaming and fitness applications also contributes to hardware sales. Regulatory alignment and strong privacy norms encourage responsible VR adoption in both consumer and enterprise sectors.
Asia Pacific
Asia Pacific represented over 30% of the global VR market in 2024 and is expected to grow at the fastest pace. China, Japan, and South Korea lead with strong manufacturing capabilities and expanding consumer bases. China’s VR sector is backed by government incentives and widespread deployment in education and tourism. Japan excels in hardware innovation and immersive content development. South Korea integrates VR across gaming cafes and 5G-driven applications. India and Southeast Asia show rapid growth due to increasing smartphone penetration and low-cost headset availability. Rising demand in both urban and rural markets drives regional expansion.
Latin America
Latin America held approximately 5% of the global VR market in 2024, with Brazil and Mexico as major contributors. The region experiences rising demand in entertainment and education sectors. VR adoption grows in classrooms, virtual field trips, and gaming cafes. E-commerce and real estate sectors experiment with VR for product demos and virtual tours. Despite economic constraints, affordable mobile-based VR headsets gain popularity. Local startups and partnerships with international tech players fuel market awareness. Infrastructure limitations and content localization challenges remain, but government initiatives in digital learning support long-term growth potential.
Middle East & Africa (MEA)
The Middle East & Africa accounted for under 5% of the global VR market in 2024 but shows growing interest across verticals. The UAE and Saudi Arabia lead regional adoption, driven by smart city initiatives and entertainment investments. VR is deployed in tourism, education, and museum experiences. Healthcare applications and military training also see growing traction. Africa’s adoption is nascent, limited by infrastructure and affordability. However, mobile VR and education-focused deployments show promise. International collaborations and government-backed innovation hubs are likely to expand access. Growth in MEA is steady, supported by rising awareness and digital transformation programs.
Virtual Reality (VR) Market Segmentations:
By Component
- Hardware
- Software
By Technology
- Semi-Immersive
- Fully Immersive
- Non-Immersive
By Device Type
- Head Mounted Display (HMD)
- VR Simulator
- VR Glasses
- VR Gloves
- Others
By End-user
- Consumer
- Commercial / Enterprise
By Geography
- North America
- U.S.
- Canada
- Mexico
- Europe
- Germany
- France
- U.K.
- Italy
- Spain
- Rest of Europe
- Asia Pacific
- China
- Japan
- India
- South Korea
- South-east Asia
- Rest of Asia Pacific
- Latin America
- Brazil
- Argentina
- Rest of Latin America
- Middle East & Africa
- GCC Countries
- South Africa
- Rest of the Middle East and Africa
Competitive Landscape
The Virtual Reality (VR) market remains highly competitive and innovation-driven, with key players focusing on hardware upgrades, software development, and immersive content creation. Major companies such as Meta Platforms Inc., HTC Corp., Microsoft Corp., and Samsung Electronics Co., Ltd. lead in headset design, tracking systems, and platform ecosystems. Alphabet Inc. continues to invest in WebXR and immersive browser-based solutions. Ultraleap Ltd. and CyberGlove Systems, Inc. specialize in haptics and gesture control, enhancing realism in enterprise and training use cases. Barco NV and Sensics, Inc. focus on visualization systems for professional and simulation markets. Sixense Enterprises, Inc. (Penumbra, Inc.) targets medical rehabilitation through VR-based therapy. Strategic partnerships, acquisitions, and investment in AI integration drive differentiation across offerings. Companies compete on display quality, field of view, motion tracking precision, and ecosystem depth. Customization, multi-platform compatibility, and cloud integration also emerge as key differentiators in the enterprise segment.
Key Player Analysis
- Ultraleap Ltd.
- CyberGlove Systems, Inc.
- Microsoft Corp.
- Meta Platforms Inc.
- Barco NV
- Sixense Enterprises, Inc. (Penumbra, Inc.)
- HTC Corp.
- Alphabet Inc.
- Samsung Electronics Co., Ltd.
- Sensics, Inc.
Recent Developments
- In December 2023, DPVR collaborated with SchooVR, provider of immersive educational content. The collaboration between DPVR and SchooVR aims to enhance learning solutions for teachers and students by integrating virtual reality (VR) into the classroom environment.
- In October 2023, Sony unveiled PlayStation 5 Slim version. It's a redesigned version of the original PS5 that's smaller and lighter, with a few other improvements. The PS5 Slim is about 30% smaller in volume than the original PS5. It's also lighter, making it easier to transport and fit into entertainment centers.
Report Coverage
The research report offers an in-depth analysis based on Component, Technology, Device Type, End-User and Geography. It details leading market players, providing an overview of their business, product offerings, investments, revenue streams, and key applications. Additionally, the report includes insights into the competitive environment, SWOT analysis, current market trends, as well as the primary drivers and constraints. Furthermore, it discusses various factors that have driven market expansion in recent years. The report also explores market dynamics, regulatory scenarios, and technological advancements that are shaping the industry. It assesses the impact of external factors and global economic changes on market growth. Lastly, it provides strategic recommendations for new entrants and established companies to navigate the complexities of the market.
Future Outlook
- The VR market will continue expanding with increased adoption across gaming, education, and healthcare.
- Standalone and wireless VR headsets will replace traditional tethered systems.
- Enterprise use of VR for training, design, and remote collaboration will grow rapidly.
- VR content development will rise, supported by tools that reduce production time and cost.
- Integration of AI and machine learning will enhance personalized and adaptive virtual experiences.
- Growth in 5G networks will enable smoother cloud-based VR streaming and mobile access.
- Haptic feedback devices and full-body tracking will improve user immersion and realism.
- VR in retail will offer virtual showrooms and product interaction before purchase.
- Government support for digital learning will drive adoption in public education systems.
- Emerging markets will see strong uptake due to falling hardware costs and mobile compatibility.
Request a Free Sample
Fill in your details and we'll send you a free sample report.
- Sample data tables & charts
- Research methodology
Need a Custom Version of This Report?
Tailor the scope, geography, or segments to your exact requirements.
- Custom geography or segment scope
- Direct access to our analyst team
Frequently Asked Questions
What is the current market size for the Virtual Reality (VR) market, and what is its projected size in 2032?
At what Compound Annual Growth Rate is the Virtual Reality (VR) market projected to grow between 2024 and 2032?
Which Virtual Reality (VR) market segment held the largest share in 2024?
What are the primary factors fueling the growth of the Virtual Reality (VR) market?
Who are the leading companies in the Virtual Reality (VR) market?
Which region commanded the largest share of the Virtual Reality (VR) market in 2024?
Table of Content
Chapter 1. Report Introduction
- 1.1 Report Description & Purpose
- 1.1.1 Report Title & Market Definition
- 1.1.2 Unique Selling Propositions (USP) & Key Differentiators
- 1.1.3 Value Proposition for Stakeholders
- 1.2 Research Objectives
- 1.2.1 Market Sizing Objectives (Volume & Revenue)
- 1.2.2 Segmentation Objectives
- 1.2.3 Competitive Intelligence Objectives
- 1.2.4 Forecast & Scenario Objectives
- 1.3 Report Scope
- 1.3.1 Virtual Reality (VR) Scope – Types & Subtypes Covered
- 1.3.2 Geographic Scope – Regions & Countries Covered
- 1.3.3 Historical Period, Base Year & Forecast Period (2024; forecast to 2032)
- 1.3.4 Inclusions & Exclusions
- 1.4 HS Code & Classification Framework
- 1.5 Currency, Units & Pricing Basis
- 1.6 Target Stakeholders
- 1.7 Limitations & Assumptions
Chapter 2. Executive Summary
- 2.1 Global Virtual Reality (VR) Market Snapshot
- 2.1.1 Market Size – Historical (2024) & Forecast (2024-2032) (2024: USD 16,310 million → 2032: USD 121,245.5 million)
- 2.1.2 Volume & Revenue – Global Totals
- 2.1.3 Key Market Highlights – Top Five Facts
- 2.2 Virtual Reality (VR) Market Segmentation Snapshot
- 2.2.1 Market Split by Region – 2024 vs. 2032
- 2.3 Competitive Snapshot
- 2.3.1 Top 10 Players by Revenue Share – 2024
- 2.3.2 Top 10 Players by Volume Share – 2024
- 2.3.3 Recent Strategic Developments (18-Month Summary)
- 2.4 Key Investment Highlights & Strategic Conclusions
Chapter 3. Virtual Reality (VR) Market Dynamics & Industry Analysis
- 3.1 Market Overview & Context
- 3.1.1 Virtual Reality (VR) Market Position in the Broader Automotive Value Chain
- 3.1.2 OEM vs. Replacement Market Dynamics
- 3.1.3 Market Maturity & Development Stage by Region
- 3.2 Virtual Reality (VR) Market Drivers
- 3.3 Virtual Reality (VR) Market Restraints & Challenges
- 3.4 Virtual Reality (VR) Market Opportunities
- 3.5 Porter's Five Forces Analysis
- 3.5.1 Threat of New Entrants
- 3.5.2 Bargaining Power of Suppliers
- 3.5.3 Bargaining Power of Buyers
- 3.5.4 Threat of Substitutes
- 3.5.5 Competitive Rivalry – Intensity Assessment
- 3.6 Virtual Reality (VR) Value Chain Analysis
- 3.6.1 Upstream – Raw Material/Input Suppliers
- 3.6.1.1 Raw Material/Input 1
- 3.6.1.2 Raw Material/Input 2
- 3.6.1.3 Raw Material/Input 3
- 3.6.2 Midstream – Production/Manufacturing/Service Delivery
- 3.6.2.1 Production/Process Overview
- 3.6.2.2 Key Facility Locations & Capacity by Manufacturer
- 3.6.3 Downstream – Distribution & End Consumer
- 3.6.3.1 Primary Channel – B2B/OEM
- 3.6.3.2 Secondary Channels – Dealer, Retail, Online, Direct
- 3.6.4 Value Chain Profitability Analysis
- 3.6.1 Upstream – Raw Material/Input Suppliers
- 3.7 PESTEL Analysis
- 3.7.1 Political Factors
- 3.7.2 Economic Factors
- 3.7.3 Social Factors
- 3.7.4 Technological Factors
- 3.7.5 Environmental Factors
- 3.7.6 Legal Factors
- 3.8 Virtual Reality (VR) Supply Chain Analysis
- 3.8.1 Raw Material/Input Supply Risk Assessment
- 3.8.2 Manufacturing Concentration Risk (Geographic Exposure)
- 3.8.3 Trade Disruption Impact Analysis
- 3.9 Regulatory & Policy Landscape
Note: The regulatory and policy landscape section covers regulations based on their applicability to the market, Virtual Reality (VR) category, geography, and scope of the study. Only regulatory frameworks with a material impact on operations, compliance, trade, sustainability, or market access are analyzed in detail.
Chapter 4. Key Investment Pockets & Opportunity Analysis
- 4.1 Virtual Reality (VR) Market Attractiveness Analysis
- 4.1.1 By Region – Investment Attractiveness Matrix (Volume × CAGR)
- 4.2 Absolute Revenue Growth Opportunity
- 4.2.1 By Region – Absolute USD Growth Through 2032
- 4.3 Incremental Volume Opportunity
- 4.3.1 By Region – Incremental Volume Through 2032
- 4.3.2 Segment – Incremental Volume
- 4.4 Emerging Submarket Opportunity Deep Dive (Subject to Applicability)
- 4.5 Emerging Market Opportunity Scorecards
- 4.5.1 United States
- 4.5.2 Europe
- 4.5.3 Asia
- 4.5.4 Middle East & Africa
Note: Emerging Market Opportunity Scorecards will be included based on relevance and strategic importance. Regions listed are indicative and may vary depending on data availability and market dynamics.
Chapter 5. Virtual Reality (VR) Import-Export Analysis & Trade Flows
- 5.1 Global Trade Overview
- 5.1.1 Global Export Value by Country (2024)
- 5.1.2 Global Export Volume by Country (2024)
- 5.1.3 Global Import Value by Country (2024)
- 5.1.4 Global Import Volume by Country (2024)
- 5.1.5 Net Trade Balance by Country (2024)
- 5.2 Export Analysis – Segment
- 5.2.1 Type 1 (HS Code)
- 5.2.2 Type 2 (HS Code)
- 5.2.3 Type 3 (HS Code)
- 5.2.4 Type 4 (HS Code)
- 5.2.5 Type 5 (HS Code)
- 5.3 Import Analysis – Segment
- 5.3.1 Type 1 (HS Code)
- 5.3.2 Type 2 (HS Code)
- 5.3.3 Type 3 (HS Code)
- 5.3.4 Type 4 (HS Code)
- 5.3.5 Type 5 (HS Code)
- 5.4 Average Unit Trade Prices
- 5.4.1 Average Export Price – Segment & Country
- 5.4.2 Average Import Price – Segment & Source Country
- 5.4.3 Price Trends (2024)
- 5.5 Key Trade Route Analysis
- 5.5.1 Trade Route 1
- 5.5.2 Trade Route 2
- 5.5.3 Trade Route 3
- 5.5.4 Trade Route 4
- 5.5.5 Trade Route 5
- 5.6 Trade Policy Impact Assessment
- 5.6.1 US Anti-Dumping & Section 301 Tariffs
- 5.6.2 EU Customs Union Impact
- 5.6.3 Major Free Trade Agreements
- 5.6.4 USMCA Rules of Origin
Note: Trade policy analysis will be included only where relevant to the Virtual Reality (VR) market.
Chapter 6. Competitive Landscape & Company Benchmarking
- 6.1 Virtual Reality (VR) Market Concentration & Structure
- 6.1.1 Herfindahl-Hirschman Index (HHI) – vs. 2024
- 6.1.2 Tier 1, Tier 2 & Tier 3 Market Structure
- 6.1.3 Global, Regional & Local Player Dynamics
- 6.2 Virtual Reality (VR) Market Share Analysis – 2024
- 6.2.1 Global Revenue Share by Company
- 6.2.2 Global Volume Share by Company
- 6.2.3 Regional Revenue Share
- 6.2.4 Market Share Evolution ( vs. 2024)
- 6.2.5 OEM Segment Share by Company
- 6.2.6 Replacement Segment Share by Company
- 6.3 Production/Delivery Capacity & Facility Analysis
- 6.3.1 Global Installed Capacity
- 6.3.2 Capacity Utilization Rates
- 6.3.3 Production/Output Volume
- 6.3.4 Facility Locations & Capacity Map
- 6.3.5 Planned Capacity Additions
- 6.4 Virtual Reality (VR) Competitive Benchmarking Matrix
- 6.4.1 Revenue, Volume, CAGR & Profitability Comparison
- 6.4.2 Channel Revenue Mix
- 6.4.3 Geographic Revenue Exposure
- 6.4.4 R&D Intensity
- 6.4.5 Sustainability Maturity
- 6.5 Strategic Developments in Virtual Reality (VR) (Last 24 Months)
- 6.5.1 Mergers, Acquisitions & Divestments
- 6.5.2 New Virtual Reality (VR) Launches
- 6.5.3 Facility Expansions
- 6.5.4 Strategic Alliances, Joint Ventures & Partnerships
- 6.5.5 Distribution Expansion & Market Entry
- 6.5.6 Sustainability & ESG Initiatives
- 6.6 Competitive Strategy Mapping
- 6.6.1 Leader, Challenger, Follower & Niche Classification
- 6.6.2 Pricing Strategy Comparison
- 6.6.3 Channel Strategy Matrix
Note: Strategic developments are included based on their materiality and the availability of reliable information.
Chapter 7. Global Virtual Reality (VR) Market – By Distribution Channel
- 7.1 Segment Overview
- 7.1.1 Volume & Revenue Split by Channel (2024 & 2032)
- 7.1.2 Channel Mix Evolution (2024-2032)
Chapter 8. Regional Market Analysis – Global Overview
- 8.1 Global Regional Overview
- 8.1.1 Regional Volume Share
- 8.1.2 Regional Revenue Share
- 8.1.3 Regional Volume by Region
- 8.1.4 Regional Revenue by Region
- 8.1.5 Regional Forecast Through 2032
- 8.2 Cross-Regional Segment Analysis
- 8.2.1 By Distribution Channel
- 8.2.2 By Brand/Price Tier
Chapter 9. North America Virtual Reality (VR) Market
- 9.1 United States
- 9.2 Canada
- 9.3 Mexico
Chapter 10. Europe Virtual Reality (VR) Market
- 10.1 Germany
- 10.2 France
- 10.3 Italy
- 10.4 United Kingdom
- 10.5 Spain
- 10.6 Poland
- 10.7 Russia
- 10.8 Netherlands
- 10.9 Belgium
- 10.10 Sweden
- 10.11 Denmark
- 10.12 Norway
- 10.13 Rest of Europe
Chapter 11. Asia Pacific Virtual Reality (VR) Market
- 11.1 China
- 11.2 India
- 11.3 Japan
- 11.4 South Korea
- 11.5 Thailand
- 11.6 Indonesia
- 11.7 Vietnam
- 11.8 Malaysia
- 11.9 Australia
- 11.10 Rest of Asia Pacific
Chapter 12. Latin America Virtual Reality (VR) Market
- 12.1 Brazil
- 12.2 Argentina
- 12.3 Colombia
- 12.4 Chile
- 12.5 Rest of Latin America
Chapter 13. Middle East Virtual Reality (VR) Market
- 13.1 Saudi Arabia
- 13.2 United Arab Emirates
- 13.3 Turkey
- 13.4 Israel
- 13.5 Iran
- 13.6 Rest of the Middle East
Chapter 14. Africa Virtual Reality (VR) Market
- 14.1 South Africa
- 14.2 Egypt
- 14.3 Nigeria
- 14.4 Morocco
- 14.5 Rest of Africa
Chapter 15. Virtual Reality (VR) Company Profiles
- 15.1 [Company 01]
- 15.1.1 Company Overview
- 15.1.2 Key Management Personnel
- 15.1.3 Products & Services Portfolio
- 15.1.4 Financial Performance
- 15.1.5 Key Market Focus & Geographic Presence
- 15.1.6 Recent Developments & Strategic Initiatives
Note: The company profile list is preliminary and may change based on research findings, market developments, data availability, and client requirements.
Chapter 16. Appendices
- Appendix A – List of Abbreviations & Acronyms
- Appendix B – Industry Classification Code Reference – Full Series
- Appendix C – Production & Capacity Data Tables
- Appendix D – End-Use & Demand Base Tables
- Appendix E – Consumption & Replacement Rate Assumptions
- Appendix F – ASP Reference Tables
- Appendix G – Manufacturing & Facility Database
- Appendix H – Import-Export Data Tables
- Appendix I – Regulatory Summary Tables
- Appendix J – Primary Research Participant List (Anonymized)
- Appendix K – Primary Research Questionnaire Framework
- Appendix L – Data Sources & Bibliography
- Appendix M – Market Size Divergence & Source Comparison
Chapter 17. Research Methodology
- 17.1 Research Framework & Philosophy
- 17.2 Secondary Research – Sources, Hierarchy & Data Extraction
- 17.3 Data Modeling – Bottom-Up & Top-Down Market Sizing
- 17.4 Primary Research – Stakeholder Framework, LOI & Sample Sizes
- 17.5 Forecast Methodology – Regression, Scenario & Sensitivity Analysis
- 17.6 Quality Control – Four-Layer Validation Framework
- 17.7 Limitations & Standard Assumptions
- 17.8 Disclaimer
