
| REPORT ATTRIBUTE | DETAILS |
|---|---|
| Historical Period | 2019-2022 |
| Base Year | 2023 |
| Forecast Period | 2024-2032 |
| Continuous Emission Monitoring System Market Size 2024 | USD 2,725 Million |
| Continuous Emission Monitoring System Market, CAGR | 4.3% |
| Continuous Emission Monitoring System Market Size 2032 | USD 3,816.28 Million |
Market Overview:
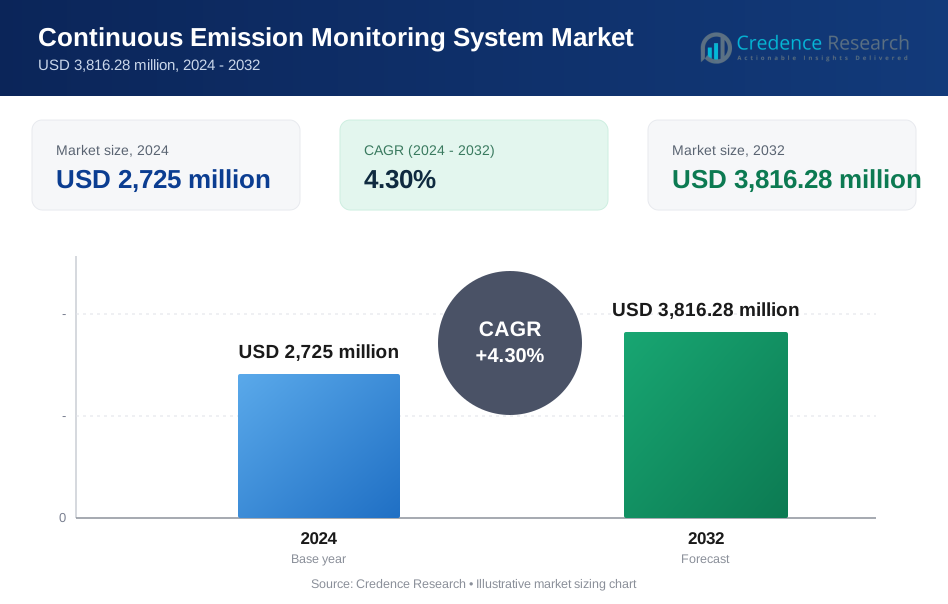
The Continuous Emission Monitoring System (CEMS) Market size is poised to grow from USD 2,725 million in 2024 to USD 3,816.28 million by 2032, at a compound annual growth rate (CAGR) of 4.3% during the forecast period 2024-2032.
The market's growth is driven by stringent environmental regulations worldwide, such as the Clean Air Act in the U.S. and the European Union's Industrial Emissions Directive, which mandate the monitoring and control of industrial emissions to mitigate air pollution. Compliance with these regulations has led to widespread adoption of Continuous Emission Monitoring Systems (CEMS) across various industries. Increasing global awareness of environmental sustainability and corporate responsibility further propels adoption. Advancements in monitoring technologies, including the integration of IoT-enabled sensors and cloud-based analytics, enhance the functionality and efficiency of CEMS, encouraging wider adoption. IoT-based systems can provide real-time data monitoring and analytics, reducing emission reporting times by up to 50%. Additionally, the rising focus on decarbonization and the green energy transition creates further opportunities for market expansion, as governments and corporations commit to achieving net-zero emissions by mid-century. Reports indicate that investment in green technologies, including emission monitoring systems, grew by over 20% in 2023, signaling strong momentum in this space.
North America leads the market, accounting for the largest share in 2024, driven by stringent environmental policies and significant adoption of advanced monitoring technologies. Over 60% of large-scale industrial facilities in the region utilize CEMS. Europe follows closely, supported by stringent EU directives and a strong focus on achieving the European Green Deal targets. The Asia-Pacific region is expected to witness the fastest growth, fueled by rapid industrialization and urbanization. China alone is committed to reducing emissions by 70% in key industrial zones by 2035. Emerging regions in Latin America and the Middle East & Africa are also gaining traction, driven by a 15% annual increase in environmental regulatory frameworks and a growing emphasis on sustainable industrial practices to combat regional air quality issues.
Market Insights:
- The CEMS market is projected to grow from USD 2,725 million in 2024 to USD 3,816.28 million by 2032, at a CAGR of 4.3%.
- Stringent environmental regulations worldwide drive the adoption of emission monitoring systems across industries.
- Integration of IoT and cloud-based analytics enhances the efficiency and functionality of CEMS, boosting demand.
- Increasing awareness of sustainability and corporate environmental responsibility propels market growth.
- North America leads the market due to stringent policies like the Clean Air Act and widespread adoption of advanced monitoring technologies.
- The Asia-Pacific region shows the fastest growth, supported by rapid industrialization and government initiatives to curb air pollution in countries like China and India.
- High initial costs and complex system integration may restrain market growth in certain regions.
Market Drivers:
Environmental Regulations and Compliance:
Stringent environmental regulations drive substantial demand for Continuous Emission Monitoring Systems (CEMS) across industries. For instance, the EPA's new 2024 regulations have lowered the primary annual standard for fine particulate matter from 12 to 9 micrograms per cubic meter, affecting 119 counties that will need enhanced monitoring capabilities to comply with these stricter limits. These regulations mandate continuous compliance monitoring across metro areas with populations exceeding 350,000 people, making CEMS implementation essential for maintaining operational licenses. As a result, companies in these regions are increasingly investing in advanced monitoring technologies to avoid penalties and ensure compliance.
Industrial Sector Growth:
The rapid expansion of crude oil, natural gas infrastructure, and power generation facilities significantly influences CEMS adoption. For instance, recent data from India indicates that crude oil production reached 32.2 million metric tons (MMT), with petroleum products consumption growing by 4.5% to 213.69 MMT. This growth in industrial activities necessitates advanced emission monitoring solutions to ensure environmental compliance and operational efficiency. In fact, many new facilities are now required to install CEMS as part of their operational setup to meet regulatory standards and enhance their sustainability practices.
Technological Advancement:
The integration of sophisticated technologies enhances CEMS capabilities and adoption. For instance, Emerson's Rosemount XE10 CEMS launch exemplifies the evolution of monitoring systems with integrated performance analytics and automated validation features that improve accuracy and reliability. These advancements in sensor technology, data analytics, and connectivity enable real-time, precise measurements of pollutant levels across various industrial processes. Reports suggest that systems equipped with these advanced features can reduce manual reporting time by up to 50%, allowing companies to focus on compliance rather than administrative tasks.
Corporate Sustainability Initiatives:
The increasing focus on corporate social responsibility and environmental sustainability drives CEMS implementation. For instance, these systems enable businesses to track emission trends, set reduction targets, and evaluate the effectiveness of sustainability initiatives. Real-time monitoring identifies deviations from acceptable emission levels; studies show that companies using CEMS can detect issues up to 30% faster than those relying on traditional methods, enabling immediate corrective actions and optimization of their environmental performance. This proactive approach not only helps in regulatory compliance but also enhances a company's reputation among environmentally conscious consumers.
Market Trends:
IoT and Cloud Integration:
The integration of Internet of Things (IoT) and cloud-based solutions is revolutionizing emission monitoring capabilities. For instance, modern Continuous Emission Monitoring Systems (CEMS) platforms achieve data transmission speeds of up to 100 Mbps, enabling real-time monitoring capabilities across multiple facilities simultaneously. These systems demonstrate an impressive 99.9% uptime in data collection and transmission, ensuring that critical emissions data is always available. Additionally, they reduce operational costs by 35% through automated monitoring and predictive maintenance procedures, allowing companies to allocate resources more efficiently.
Advanced Analytics and AI Implementation:
The incorporation of artificial intelligence (AI) and machine learning algorithms has transformed emission monitoring accuracy. For instance, modern systems achieve a 45% reduction in manual intervention requirements while maintaining measurement precision within ±2% of reference values. AI-powered systems can detect emission anomalies with 98% accuracy within 30 seconds of occurrence, enabling facilities to respond to potential violations before they escalate into critical issues. This rapid response capability is crucial for maintaining compliance and minimizing environmental impact.
Enhanced Regulatory Compliance Solutions:
New EPA regulations have driven significant improvements in monitoring capabilities. For instance, CEMS installations now monitor up to 12 different pollutants simultaneously, with accuracy rates exceeding 95%. These advanced systems track emissions at intervals as short as 10 seconds, ensuring compliance with the EPA's new primary annual standard of 9 micrograms per cubic meter for fine particulate matter, which affects over 119 counties nationwide. This level of precision and frequency in monitoring is essential for industries striving to meet stringent regulatory requirements.
Mobile and Portable Monitoring Solutions:
The development of flexible monitoring solutions addresses growing industry needs. For instance, modern portable CEMS units achieve setup times under 60 minutes while maintaining accuracy levels within ±1% of fixed installations. These systems feature wireless connectivity ranges up to 1,000 meters and can operate continuously for up to 72 hours on battery power, providing crucial flexibility for temporary monitoring requirements. This adaptability allows organizations to conduct emissions assessments in various locations without compromising on data quality or reliability.
Market Challenges Analysis:
High Initial Investment and Maintenance Costs:
The substantial financial investment required for Continuous Emission Monitoring Systems (CEMS) implementation presents a significant market barrier. For instance, according to the Environmental Protection Agency (EPA) compliance reports, initial installation costs range from $100,000 to $500,000 per facility, which can be prohibitive for many organizations. Additionally, annual maintenance costs average between 15% and 20% of the initial investment, further straining budgets. These cost barriers particularly affect small and medium-sized enterprises (SMEs) operating under financial constraints, as they may struggle to allocate sufficient funds for compliance with environmental regulations.
Technical Complexity and Integration Challenges:
The intricate nature of CEMS integration with existing infrastructure creates operational hurdles. For instance, the U.S. Department of Energy notes that facilities often face compatibility issues when implementing new monitoring systems, particularly in older installations that require retrofitting. Industry data indicates that these integration challenges can extend implementation timelines by 3 to 6 months and increase project costs by up to 25%. This added complexity can deter facilities from adopting advanced monitoring solutions, as the potential for delays and increased expenses may outweigh the perceived benefits.
Regulatory Uncertainty and Compliance Complexity:
Evolving environmental regulations across different jurisdictions create significant compliance challenges for companies. For instance, the EPA's frequent updates to emission standards and monitoring requirements necessitate continuous system upgrades and modifications. Companies operating across multiple regions face additional complexity due to varying regulatory frameworks; studies show that businesses may need to adapt their compliance strategies at least twice a year to keep pace with changing regulations. This constant need for adjustment can lead to increased operational costs and resource allocation challenges.
Limited Technical Expertise:
The shortage of skilled professionals capable of operating and maintaining CEMS presents a significant challenge for many organizations. For instance, the U.S. Bureau of Labor Statistics highlights a growing demand for environmental monitoring specialists, with projections indicating a need for an additional 30% more qualified technicians over the next decade. This limitation particularly affects developing regions, where technical expertise is scarce and training resources are limited; reports suggest that nearly 40% of facilities in these areas struggle to find adequately trained personnel to manage their emission monitoring systems effectively.
Market Opportunities:
The Continuous Emission Monitoring System (CEMS) Market offers significant growth opportunities as global industries increasingly prioritize environmental compliance and sustainability. The stringent enforcement of regulations targeting industrial emissions, such as sulfur dioxide (SO₂), nitrogen oxides (NOₓ), and particulate matter, creates a strong demand for advanced CEMS solutions. Additionally, the growing focus on decarbonization and reducing greenhouse gas emissions aligns with the adoption of monitoring systems that provide accurate, real-time data. Industries such as power generation, oil and gas, and chemicals are investing heavily in CEMS to meet regulatory requirements and demonstrate corporate environmental responsibility. Technological advancements, including IoT-enabled systems and cloud-based analytics, further enhance the functionality of these systems, enabling predictive maintenance, data-driven decision-making, and improved operational efficiency.
Emerging economies, particularly in Asia-Pacific, Latin America, and Middle East & Africa, present substantial growth potential. Rapid industrialization, urbanization, and increasing government initiatives to combat air pollution are driving the adoption of CEMS in countries such as China, India, and Brazil. The growing emphasis on sustainable industrial practices and green energy transitions in these regions amplifies the need for emission monitoring solutions. Companies that focus on developing cost-effective, scalable, and technologically advanced CEMS solutions tailored to regional requirements will be well-positioned to capitalize on these opportunities. Strategic collaborations with governments and industry stakeholders further enhance the potential for market expansion in these regions.
Market Segmentation Analysis:
By Product Type
The market includes hardware, software, and services. Hardware components, such as gas analyzers and sample probes, are essential for measuring and collecting emission data. Software solutions provide data analysis and reporting capabilities, while services encompass installation, maintenance, and support.
By End User
The market is categorized by end users, such as power generation, oil & gas, chemicals, manufacturing, cement, and other industries. Power generation plants rely on CEMS to monitor emissions from combustion processes. The oil & gas industry uses these systems to track emissions from extraction and refining operations. Chemical plants implement CEMS to ensure compliance with environmental regulations. Manufacturing and cement industries utilize CEMS to monitor emissions from various production processes.
These segments highlight the diverse applications and growing adoption of continuous emission monitoring systems, driving market expansion and innovation. The continuous advancements in technology and increasing demand for environmental compliance further propel the market forward.
Segmentations:
By Product Type:
- Hardware
- Software
- Services
By End Use:
- Power Generation
- Waste Incineration
- Petroleum Refining
- Steel Refining
- Chemicals & Fertilizers
- Cement
By Region:
- North America
- U.S.
- Canada
- Mexico
- Europe
- Germany
- France
- U.K.
- Italy
- Spain
- Rest of Europe
- Asia Pacific
- China
- Japan
- India
- South Korea
- South-east Asia
- Rest of Asia Pacific
- Latin America
- Brazil
- Argentina
- Rest of Latin America
- Middle East & Africa
- GCC Countries
- South Africa
- Rest of the Middle East and Africa
Regional Analysis:
North America
North America holds the largest market share, accounting for 35% of the global market in 2024. For instance, this dominance is attributed to stringent environmental regulations, such as the Clean Air Act in the United States, which mandates rigorous monitoring of air quality and emissions. Robust industrial activity across sectors like power generation, chemicals, and oil and gas further supports this market position; reports indicate that power generation alone accounts for nearly 40% of total emissions monitored in the region. The adoption of advanced CEMS technologies, including IoT-enabled and cloud-based systems, is widespread in North America, driven by a strong focus on operational efficiency and compliance. Additionally, Canada contributes significantly, with industries investing heavily in emission monitoring to meet sustainability goals; for example, Canadian oil sands operations have increased their monitoring budgets by 25% in response to regulatory pressures.
Europe
Europe represents 30% of the market share, supported by stringent EU directives aimed at reducing industrial emissions. For instance, countries like Germany, the United Kingdom, and France are at the forefront of CEMS adoption due to strong environmental policies; Germany's Federal Emission Control Act requires continuous monitoring for over 1,200 industrial facilities. The region's emphasis on industrial decarbonization and compliance with initiatives like the European Green Deal further fuels market growth; studies show that European industries are expected to invest over €100 billion in emission reduction technologies by 2030. Advanced manufacturing capabilities and technological innovation make Europe a hub for high-quality CEMS production and deployment, with over 60% of CEMS systems produced in Europe meeting or exceeding international standards.
Asia-Pacific
Asia-Pacific is the fastest-growing region currently accounting for 20% of the market share. For instance, rapid industrialization and urbanization in countries like China and India drive demand for emission monitoring systems; China's industrial sector alone produces over 30% of global CO2 emissions. Government initiatives to address environmental challenges, such as India’s National Clean Air Programme (NCAP), aim to reduce particulate matter levels by up to 20-30% over five years, serving as key growth drivers for CEMS adoption. The region also benefits from the presence of cost-effective manufacturing hubs; recent reports indicate that manufacturing costs in India are about 20-30% lower than in developed countries, making it an attractive location for CEMS production.
Latin America and the Middle East & Africa
Latin America and the Middle East & Africa collectively contribute 15% of the market share, fueled by growing awareness of environmental regulations and the need for sustainable industrial practices. For instance, in Latin America, countries like Brazil and Mexico are adopting CEMS to monitor emissions in power plants and heavy industries; Brazil's National Policy on Climate Change mandates emission reductions across various sectors by 37% by 2025. The Middle East & Africa region sees rising demand in oil and gas operations; reports indicate that flare gas emissions have come under increasing scrutiny, leading to a 15% increase in investment towards emission monitoring technologies. Additionally, efforts to diversify economies through sustainable practices are encouraging investments in CEMS across various industries in this region.
Key Player Analysis:
- SICK AG
- Teledyne Technologies
- Emerson Electric Co.
- Thermo Fisher Scientific
- ABB Ltd
- Horiba Ltd.
- AMETEK, Inc.
- General Electric Company
- Siemens AG
- Rockwell Automation, Inc.
Competitive Analysis:
The Continuous Emission Monitoring System (CEMS) market demonstrates intense competition among established manufacturers, with key players like ABB Ltd., Thermo Fisher Scientific Inc., and Emerson Electric Co. leading the industry. For instance, North America dominates with 40% market share, driven by stringent EPA regulations that require continuous monitoring of emissions from industrial facilities. The CEMS segment commands 78.3% of the total market revenue, highlighting the critical importance of continuous monitoring solutions in maintaining compliance and ensuring environmental protection. Major players differentiate themselves through technological innovation; for example, advancements in sensor technology have improved detection capabilities, with some systems achieving accuracy rates of over 95%. The competitive landscape is characterized by strategic developments and acquisitions; for instance, ESC Spectrum's acquisition of Monitoring Solutions in January 2022 illustrates the trend of consolidation aimed at enhancing service offerings and expanding market reach. The market's dynamics are further shaped by the integration of IoT and cloud-based platforms; companies are focusing on developing advanced solutions that offer real-time monitoring capabilities, with some systems capable of transmitting data at speeds up to 100 Mbps, thereby improving accuracy in emissions measurement and facilitating quicker compliance reporting.
Recent Developments:
- In March 2024 Rockwell Automation partnered with Microsoft to accelerate industrial transformation, focusing on enhancing automation and monitoring capabilities including emissions control systems. The collaboration aims to improve digital twin technologies and AI integration in industrial processes.
- In February 2024 Horiba Ltd. expanded its gas monitoring solutions for semiconductor processes, introducing advanced monitoring capabilities for multiple parameters in chemical solutions. The company's focus on precision measurement technology enhances their position in the emissions monitoring sector.
- In January 2024 ABB Ltd. strengthened its industrial automation portfolio through digital transformation initiatives across multiple countries, emphasizing enhanced monitoring and control capabilities for emission systems across various industries.
- In November 2023 Rockwell Automation launched FactoryTalk Analytics VisionAI, incorporating AI-powered inspection capabilities that can be applied to emission monitoring systems, demonstrating their commitment to advancing industrial automation and monitoring technologies.
Market Concentration & Characteristics:
The Continuous Emission Monitoring System (CEMS) Market is moderately concentrated, featuring a mix of global leaders and regional players providing innovative solutions for emission monitoring. Major companies such as SICK AG, Teledyne Technologies, and ABB Ltd dominate the market with advanced technologies, extensive product portfolios, and robust distribution networks. These players emphasize integrating IoT and cloud-based analytics to enhance system efficiency and compliance capabilities. Regional players contribute by offering cost-effective and tailored solutions for specific industries. The market is characterized by stringent environmental regulations driving adoption across power generation, oil and gas, and manufacturing sectors. While high initial costs and system integration complexities pose challenges, ongoing advancements in hardware and software technologies ensure steady market growth and innovation. The competitive landscape fosters continuous improvement, enabling industries to achieve sustainability goals and regulatory compliance.
Report Coverage:
The research report offers an in-depth analysis based on Product Type, End Use, and Region. It details leading market players, providing an overview of their business, product offerings, investments, revenue streams, and key applications. Additionally, the report includes insights into the competitive environment, SWOT analysis, current market trends, as well as the primary drivers and constraints. Furthermore, it discusses various factors that have driven market expansion in recent years. The report also explores market dynamics, regulatory scenarios, and technological advancements that are shaping the industry. It assesses the impact of external factors and global economic changes on market growth. Lastly, it provides strategic recommendations for new entrants and established companies to navigate the complexities of the market.
Future Outlook:
- Increasing regulatory enforcement and stringent environmental policies will drive the adoption of advanced CEMS solutions globally.
- Technological advancements, including IoT integration and cloud-based analytics, will enhance real-time monitoring and predictive maintenance capabilities.
- The growing focus on industrial decarbonization and greenhouse gas reduction will expand the scope of CEMS applications across various sectors.
- Emerging markets, particularly in Asia-Pacific and Latin America, will present significant growth opportunities due to rapid industrialization and rising environmental awareness.
- The power generation sector will continue to dominate CEMS adoption, driven by strict emission standards and the need for continuous pollutant monitoring.
- Industries such as oil and gas, chemicals, and cement will increasingly adopt CEMS to ensure compliance with evolving emission regulations.
- The demand for portable and cost-effective monitoring systems will rise, catering to small and medium-sized industries.
- Enhanced data analytics and AI-driven insights will enable more efficient operational decision-making and compliance management.
- Government and private sector initiatives supporting green energy transitions and sustainability goals will fuel market growth.
- Collaborations between manufacturers and regulatory bodies will promote the development of standardized and region-specific monitoring solutions, fostering global market expansion.
Request a Free Sample
Fill in your details and we'll send you a free sample report.
- Sample data tables & charts
- Research methodology
Market Dynamics
Stringent Environmental Regulations
Global enforcement of stricter emission standards, such as the U.S. Clean Air Act and EU Industrial Emissions Directive, compels industries to adopt CEMS for continuous compliance and to avoid penalties, driving widespread market adoption.
Industrial Sector Growth
Expansion in sectors like power generation, oil & gas, and chemicals increases the need for advanced emission monitoring to ensure regulatory compliance and operational efficiency, making CEMS a critical investment for new and existing facilities.
Technological Advancements
Integration of IoT, cloud-based analytics, and AI into CEMS enhances real-time monitoring, predictive maintenance, and data accuracy, making these systems more attractive and effective for industrial users.
Corporate Sustainability Initiatives
Growing emphasis on environmental responsibility and sustainability reporting encourages companies to implement CEMS, enabling them to track, manage, and reduce emissions as part of their ESG strategies.
Emerging Market Industrialization
Rapid industrialization and urbanization in Asia-Pacific, Latin America, and the Middle East & Africa, combined with increasing regulatory frameworks, are accelerating the adoption of CEMS in these high-growth regions.
Need a Custom Version of This Report?
Tailor the scope, geography, or segments to your exact requirements.
- Custom geography or segment scope
- Direct access to our analyst team
Frequently Asked Questions
What is the current size of the Continuous Emission Monitoring System (CEMS) Market?
What factors are driving the growth of the Continuous Emission Monitoring System (CEMS) Market?
What are some challenges faced by the Continuous Emission Monitoring System (CEMS) Market?
Who are the major players in the Continuous Emission Monitoring System (CEMS) Market?
Which segment is leading the market share?
Table of Content
Chapter 1 Market Segmentation
- 1.1 Segmentation Framework
- 1.1.1 Product and Service Classification
- 1.1.2 Application and End-Use Classification
- 1.1.3 Technology and Solution Classification
- 1.1.4 Customer and Distribution Channel Classification
- 1.1.5 Geographic Segmentation
- 1.1.6 Market Segment Definitions and Boundaries
- 1.2 By End Use
- 1.2.1 Power Generation
- 1.2.2 Waste Incineration
- 1.2.3 Petroleum Refining
- 1.2.4 Steel Refining
- 1.2.5 Chemicals & Fertilizers
- 1.2.6 Cement
- 1.3 By Product Type
- 1.3.1 Hardware
- 1.3.2 Software
- 1.3.3 Services
Chapter 2 Introduction
- 2.1 Report Objectives and Scope
- 2.2 Product Definition and Industry Terminology
- 2.3 Market Inclusions and Exclusions
- 2.4 Research Process
- 2.4.1 Primary Research and Expert Interviews
- 2.4.2 Secondary Research and Source Review
- 2.4.3 Top-Down and Bottom-Up Estimation
- 2.4.4 Data Triangulation and Verification
- 2.5 Market Size Measurement Basis
- 2.5.1 2024: USD 2,725 million → 2032: USD 3,816.28 million
- 2.6 Historical and Forecast Reference Periods
- 2.6.1 Base Year: 2024
- 2.6.2 Forecast Period: 2024-2032
- 2.7 Research Assumptions and Limitations
Chapter 3 Executive Summary
- 3.1 Market Snapshot and Key Findings
- 3.2 Base-Year Market Size, 2024
- 3.3 Forecast Market Size, 2032
- 3.4 Revenue and Volume Growth Outlook
- 3.5 Key Demand and Supply Indicators
- 3.6 Leading Market Segments
- 3.7 Fastest-Growing Market Opportunities
- 3.8 Regional Performance Highlights
- 3.9 Technology and Industry Transformation
- 3.10 Competitive Landscape Summary
- 3.11 Analyst View and Strategic Implications
Chapter 4 Global Continuous Emission Monitoring System Market Trends and Developments
- 4.1 Historical Industry Development
- 4.2 Recent Market Trends and Developments
- 4.3 Demand and Customer Behavior Trends
- 4.4 Technology and Product Innovation
- 4.5 Artificial Intelligence, Automation and Digitalization
- 4.6 Local Manufacturing and Supply Chain Realignment
- 4.7 Industry Partnerships, Mergers and Acquisitions
- 4.8 Sustainability and Circular Economy Developments
- 4.9 Government and Private Sector Investment Trends
- 4.10 Emerging Business Models and Commercialization
- 4.11 Industry Developments and Announcements
Chapter 5 Global Continuous Emission Monitoring System Market Production, Supply and Demand Analysis
- 5.1 Demand Trend and Consumption Analysis
- 5.2 Demand Forecast, 2024-2032
- 5.3 Production and Output Trend
- 5.4 Production and Output Forecast, 2024-2032
- 5.5 Installed Capacity and Capacity Utilization
- 5.6 Company-Wise Production Plants and Statistics
- 5.6.1 Installed Production Capacity
- 5.6.2 Actual Production
- 5.6.3 Planned Capacity and Expansion Targets
- 5.7 Supply Chain Structure and Procurement Trends
- 5.8 Supply-Demand Gap and Bottlenecks
- 5.9 Import Dependence and Sourcing Structure
- 5.10 Contract Manufacturing and Outsourcing
- 5.11 Regional Supply and Demand Concentration
Chapter 6 Global Continuous Emission Monitoring System Market Pricing Analysis
- 6.1 Pricing Structure and Measurement
- 6.2 Historical Pricing Trends
- 6.3 Pricing Outlook, 2024-2032
- 6.4 Average Selling Price and Unit Economics
- 6.5 Pricing by Product and Market Segment
- 6.6 Geographic Pricing Differences
- 6.7 Key Input, Energy, Labor and Logistics Costs
- 6.8 Contract Pricing and Purchasing Models
- 6.9 Pricing Sensitivity and Competitive Positioning
- 6.10 Price, Margin and Profitability Implications
Chapter 7 Global Continuous Emission Monitoring System Market Dynamics
- 7.1 Market Growth Drivers
- 7.1.1 Demand-Side Drivers
- 7.1.2 Technology and Innovation Drivers
- 7.1.3 Infrastructure and Investment Drivers
- 7.1.4 Regulatory and Policy Drivers
- 7.2 Market Restraints
- 7.2.1 Cost and Affordability Constraints
- 7.2.2 Technology and Adoption Barriers
- 7.2.3 Supply Chain and Operational Constraints
- 7.3 Market Challenges
- 7.3.1 Competitive Pressure and Margin Erosion
- 7.3.2 Skills, Infrastructure and Implementation Gaps
- 7.4 Emerging Market Opportunities
- 7.5 Market Dynamics Impact and Time-Horizon Assessment
Chapter 8 Global Continuous Emission Monitoring System Value Chain Analysis
- 8.1 Industry Value Chain Overview
- 8.2 Upstream Suppliers and Critical Inputs
- 8.3 Technology and Component Providers
- 8.4 Manufacturing or Service Delivery
- 8.5 Distribution, Channel Partners and Integrators
- 8.6 Downstream Applications and End Users
- 8.7 Value Addition and Profit Pools
- 8.8 Vertical Integration and Outsourcing
- 8.9 Supplier Concentration and Risk
- 8.10 Supply Chain Localization and Resilience
Chapter 9 Global Continuous Emission Monitoring System Market Regulations and Policies
- 9.1 Relevant Laws, Standards and Compliance Frameworks
- 9.2 Product, Service, Safety and Quality Requirements
- 9.3 Government Policies, Incentives and Subsidies
- 9.4 Imports, Exports and Trade Barriers
- 9.5 Public Procurement and Local Content Requirements
- 9.6 Environmental and Sustainability Compliance
- 9.7 Upcoming Policy Changes and Market Implications
Chapter 10 Global Continuous Emission Monitoring System Market Hotspots and Opportunities
- 10.1 Market Opportunity Mapping and Growth Hotspots
- 10.2 High-Growth Applications and Customer Groups
- 10.3 Underserved Markets and White-Space Opportunities
- 10.4 Emerging Technology and Product Opportunities
- 10.5 New Capacity and Investment Hotspots
- 10.6 Market Entry and Expansion Opportunities
- 10.7 Distribution and Partnership Opportunities
- 10.8 Near-Term and Long-Term Commercial Potential
- 10.9 Opportunity Attractiveness and Execution Risks
Chapter 11 Global Continuous Emission Monitoring System Market Outlook, 2024-2032
- 11.1 Market Size and Analysis
- 11.1.1 Revenue (Market Measurement: 2024: USD 2,725 million → 2032: USD 3,816.28 million)
- 11.1.2 Market Volume and Quantity Sold
- 11.1.3 Historical Market Size
- 11.1.4 Base-Year Market Size, 2024
- 11.2 Market Forecast, 2024-2032
- 11.2.1 Revenue Forecast to 2032
- 11.2.2 Volume Forecast to 2032
- 11.2.3 CAGR and Year-on-Year Growth
- 11.2.4 Incremental Revenue Opportunity
- 11.3 Forecast Assumptions and Scenario Analysis
- 11.3.1 Base-Case Forecast
- 11.3.2 Optimistic and Conservative Scenarios
- 11.3.3 Technology, Pricing and Policy Sensitivities
- 11.4 Market Attractiveness and Growth Outlook
Chapter 12 Global Continuous Emission Monitoring System Market Segmentation and Outlook
- 12.1 Segmentation Summary and Market Shares, 2024
- 12.2 Largest and Fastest-Growing Segments
- 12.3 By End Use - Market Size and Forecast, 2024-2032
- 12.3.1 Segment Definition and Scope
- 12.3.2 Historical Market Size
- 12.3.3 Revenue Forecast, 2024-2032
- 12.3.4 Volume Forecast, 2024-2032
- 12.3.5 Base-Year Market Share, 2024
- 12.3.6 Segment CAGR and Growth Drivers
- 12.3.7 Subsegment Market Size and Forecast
- 12.3.7.1 Power Generation
- 12.3.7.2 Waste Incineration
- 12.3.7.3 Petroleum Refining
- 12.3.7.4 Steel Refining
- 12.3.7.5 Chemicals & Fertilizers
- 12.3.7.6 Cement
- 12.3.8 Subsegment Pricing and Adoption Trends
- 12.3.9 Leading Suppliers and Competition
- 12.3.10 Regional Demand and Opportunities
- 12.4 By Product Type - Market Size and Forecast, 2024-2032
- 12.4.1 Segment Definition and Scope
- 12.4.2 Historical Market Size
- 12.4.3 Revenue Forecast, 2024-2032
- 12.4.4 Volume Forecast, 2024-2032
- 12.4.5 Base-Year Market Share, 2024
- 12.4.6 Segment CAGR and Growth Drivers
- 12.4.7 Subsegment Market Size and Forecast
- 12.4.7.1 Hardware
- 12.4.7.2 Software
- 12.4.7.3 Services
- 12.4.8 Subsegment Pricing and Adoption Trends
- 12.4.9 Leading Suppliers and Competition
- 12.4.10 Regional Demand and Opportunities
- 12.5 Segment Growth Comparison
- 12.6 Segment Attractiveness and Priority Matrix
Chapter 13 Global Continuous Emission Monitoring System End-Use and Application Market Outlook
- 13.1 End-Use Industry and Customer Demand Structure
- 13.2 Leading Applications and Customer Groups
- 13.3 End-Use Market Size, Share and Forecast
- 13.4 Major End-Use Industry Deep Dives
- 13.4.1 Customer Requirements and Use Cases
- 13.4.2 Demand and Replacement Cycles
- 13.4.3 Technical and Regulatory Considerations
- 13.4.4 Purchasing and Procurement Models
- 13.4.5 Leading Vendors and Distribution Channels
- 13.4.6 Forecast and Commercial Opportunities
- 13.5 Emerging Applications and Cross-Segment Demand
- 13.6 End-Use Industry Investment Priorities
Chapter 14 Global Continuous Emission Monitoring System Geographic Market Outlook, 2024-2032
- 14.1 Regional Market Size and Share, 2024
- 14.2 Regional Market Forecast, 2024-2032
- 14.3 Regional Pricing, Production and Demand Differences
- 14.4 North America
- 14.4.1 United States
- 14.4.2 Canada
- 14.4.3 Mexico
- 14.5 Europe
- 14.5.1 Germany
- 14.5.2 France
- 14.5.3 Italy
- 14.5.4 United Kingdom
- 14.5.5 Spain
- 14.5.6 Poland
- 14.5.7 Russia
- 14.5.8 Netherlands
- 14.5.9 Belgium
- 14.5.10 Sweden
- 14.5.11 Denmark
- 14.5.12 Norway
- 14.5.13 Rest of Europe
- 14.6 Asia Pacific
- 14.6.1 China
- 14.6.2 India
- 14.6.3 Japan
- 14.6.4 South Korea
- 14.6.5 Thailand
- 14.6.6 Indonesia
- 14.6.7 Vietnam
- 14.6.8 Malaysia
- 14.6.9 Australia
- 14.6.10 Rest of Asia Pacific
- 14.7 Latin America
- 14.7.1 Brazil
- 14.7.2 Argentina
- 14.7.3 Colombia
- 14.7.4 Chile
- 14.7.5 Rest of Latin America
- 14.8 Middle East
- 14.8.1 Saudi Arabia
- 14.8.2 United Arab Emirates
- 14.8.3 Turkey
- 14.8.4 Israel
- 14.8.5 Iran
- 14.8.6 Rest of the Middle East
- 14.9 Africa
- 14.9.1 South Africa
- 14.9.2 Egypt
- 14.9.3 Nigeria
- 14.9.4 Morocco
- 14.9.5 Rest of Africa
- 14.10 Regional Investment, Policy and Supply Chain Differences
- 14.11 Regional Competitive Landscape
- 14.12 Geographic Growth Hotspots
Chapter 15 Global Continuous Emission Monitoring System Technology, Innovation and Sustainability Outlook
- 15.1 Technology Landscape and Maturity
- 15.2 Product, Process and Service Innovation
- 15.3 AI, Automation and Digital Tools in the Industry
- 15.4 Technology Adoption and Performance Benchmarking
- 15.5 Innovation Pipeline and R&D Investment
- 15.6 Patent and Intellectual Property Trends
- 15.7 Energy Efficiency and Resource Management
- 15.8 Sustainability, Recycling and Circularity
- 15.9 Technology Roadmap, 2024-2032
- 15.10 Risks of Obsolescence and Technology Substitution
Chapter 16 Global Continuous Emission Monitoring System Market Key Strategic Imperatives
- 16.1 Growth and Market Entry Priorities
- 16.2 High-Return Products and Segments
- 16.3 Pricing, Profitability and Cost Optimization
- 16.4 Technology Investment and Product Differentiation
- 16.5 Supply Chain Localization and Resilience
- 16.6 Distribution and Customer Acquisition
- 16.7 Partnership, Acquisition and Capacity Strategy
- 16.8 Regional Expansion Priorities
- 16.9 Short-, Medium- and Long-Term Actions
Chapter 17 Competition Outlook
- 17.1 Industry Competition Characteristics
- 17.2 Market Structure and Concentration
- 17.3 Market Share and Competitive Positioning, 2024
- 17.4 Company-Wise Revenue and Product Benchmarking
- 17.5 Production and Service Capacity Benchmarking
- 17.6 Technology, Pricing and Differentiation
- 17.7 Regional Footprint and Distribution Strength
- 17.8 Mergers, Acquisitions and Strategic Alliances
- 17.9 New Entrants and Competitive Threats
- 17.10 Porter's Five Forces and Industry Attractiveness
- 17.11 Competitive Outlook, 2024-2032
Chapter 18 Company Profiles
- 18.1 Company Coverage and Selection Criteria
- 18.2 SICK AG
- 18.2.1 Business Description
- 18.2.2 Company Ownership and Geographic Presence
- 18.2.3 Product and Service Portfolio
- 18.2.4 Manufacturing and Operating Footprint
- 18.2.5 Production Capacity and Expansion Plans
- 18.2.6 Financial Performance and Investment
- 18.2.7 Market Share and Competitive Position
- 18.2.8 Technology and Innovation Capabilities
- 18.2.9 Strategic Alliances or Partnerships
- 18.2.10 Recent Developments
- 18.2.11 Growth Strategy and Outlook
- 18.3 Teledyne Technologies
- 18.4 Emerson Electric Co.
- 18.5 Thermo Fisher Scientific
- 18.6 ABB Ltd
- 18.7 Horiba Ltd.
- 18.8 AMETEK, Inc.
- 18.9 General Electric Company
- 18.10 Siemens AG
- 18.11 Rockwell Automation, Inc.
- 18.12 Other Relevant Market Participants
Note: Every listed company is profiled on the structure shown under the first company. The company list is preliminary and may change based on research findings, market developments, data availability and client requirements.
Chapter 19 Disclaimer
- 19.1 Research and Forecast Disclaimer
- 19.2 Data Source and Estimation Limitations
Note: The depth of individual sections depends on data availability for this market. Volume, capacity, trade and other unit-based metrics are included where applicable.

