CHAPTER NO. 1 : INTRODUCTION 19
1.1.1. Report Description 19
Purpose of the Report 19
USP & Key Type of Cartilages 19
1.1.2. Key Benefits for Stakeholders 19
1.1.3. Target Audience 20
1.1.4. Report Scope 20
CHAPTER NO. 2 : EXECUTIVE SUMMARY 21
2.1. Europe Cartilage Repair Regeneration Market Snapshot 21
2.1.1. Europe Cartilage Repair Regeneration Market, 2018 – 2032 (USD Million) 22
CHAPTER NO. 3 : EUROPE CARTILAGE REPAIR REGENERATION MARKET – INDUSTRY ANALYSIS 23
3.1. Introduction 23
3.2. Market Drivers 24
3.2.1. High Incidence of Osteoarthritis and Sports-Related Injuries 24
3.2.2. Advancements in Regenerative Medicine 25
3.3. Market Restraints 26
3.3.1. Limited Availability of Skilled Specialists 26
3.4. Market Opportunities 27
3.4.1. Market Opportunity Analysis 27
3.5. Porter’s Five Forces Analysis 28
CHAPTER NO. 4 : ANALYSIS COMPETITIVE LANDSCAPE 29
4.1. Company Market Share Analysis – 2024 29
4.1.1. Europe Cartilage Repair Regeneration Market: Company Market Share, by Revenue, 2024 29
4.1.2. Europe Cartilage Repair Regeneration Market: Top 6 Company Market Share, by Revenue, 2024 29
4.1.3. Europe Cartilage Repair Regeneration Market: Top 3 Company Market Share, by Revenue, 2024 30
4.2. Europe Cartilage Repair Regeneration Market Company Revenue Market Share, 2024 31
4.3. Company Assessment Metrics, 2024 32
4.3.1. Stars 32
4.3.2. Emerging Leaders 32
4.3.3. Pervasive Players 32
4.3.4. Participants 32
4.4. Start-ups /SMEs Assessment Metrics, 2024 32
4.4.1. Progressive Companies 32
4.4.2. Responsive Companies 32
4.4.3. Dynamic Companies 32
4.4.4. Starting Blocks 32
4.5. Strategic Developments 33
4.5.1. Acquisitions & Mergers 33
New Product Launch 33
Europe Expansion 33
4.6. Key Players Product Matrix 34
CHAPTER NO. 5 : PESTEL & ADJACENT MARKET ANALYSIS 35
5.1. PESTEL 35
5.1.1. Political Factors 35
5.1.2. Economic Factors 35
5.1.3. Social Factors 35
5.1.4. Technological Factors 35
5.1.5. Environmental Factors 35
5.1.6. Legal Factors 35
5.2. Adjacent Market Analysis 35
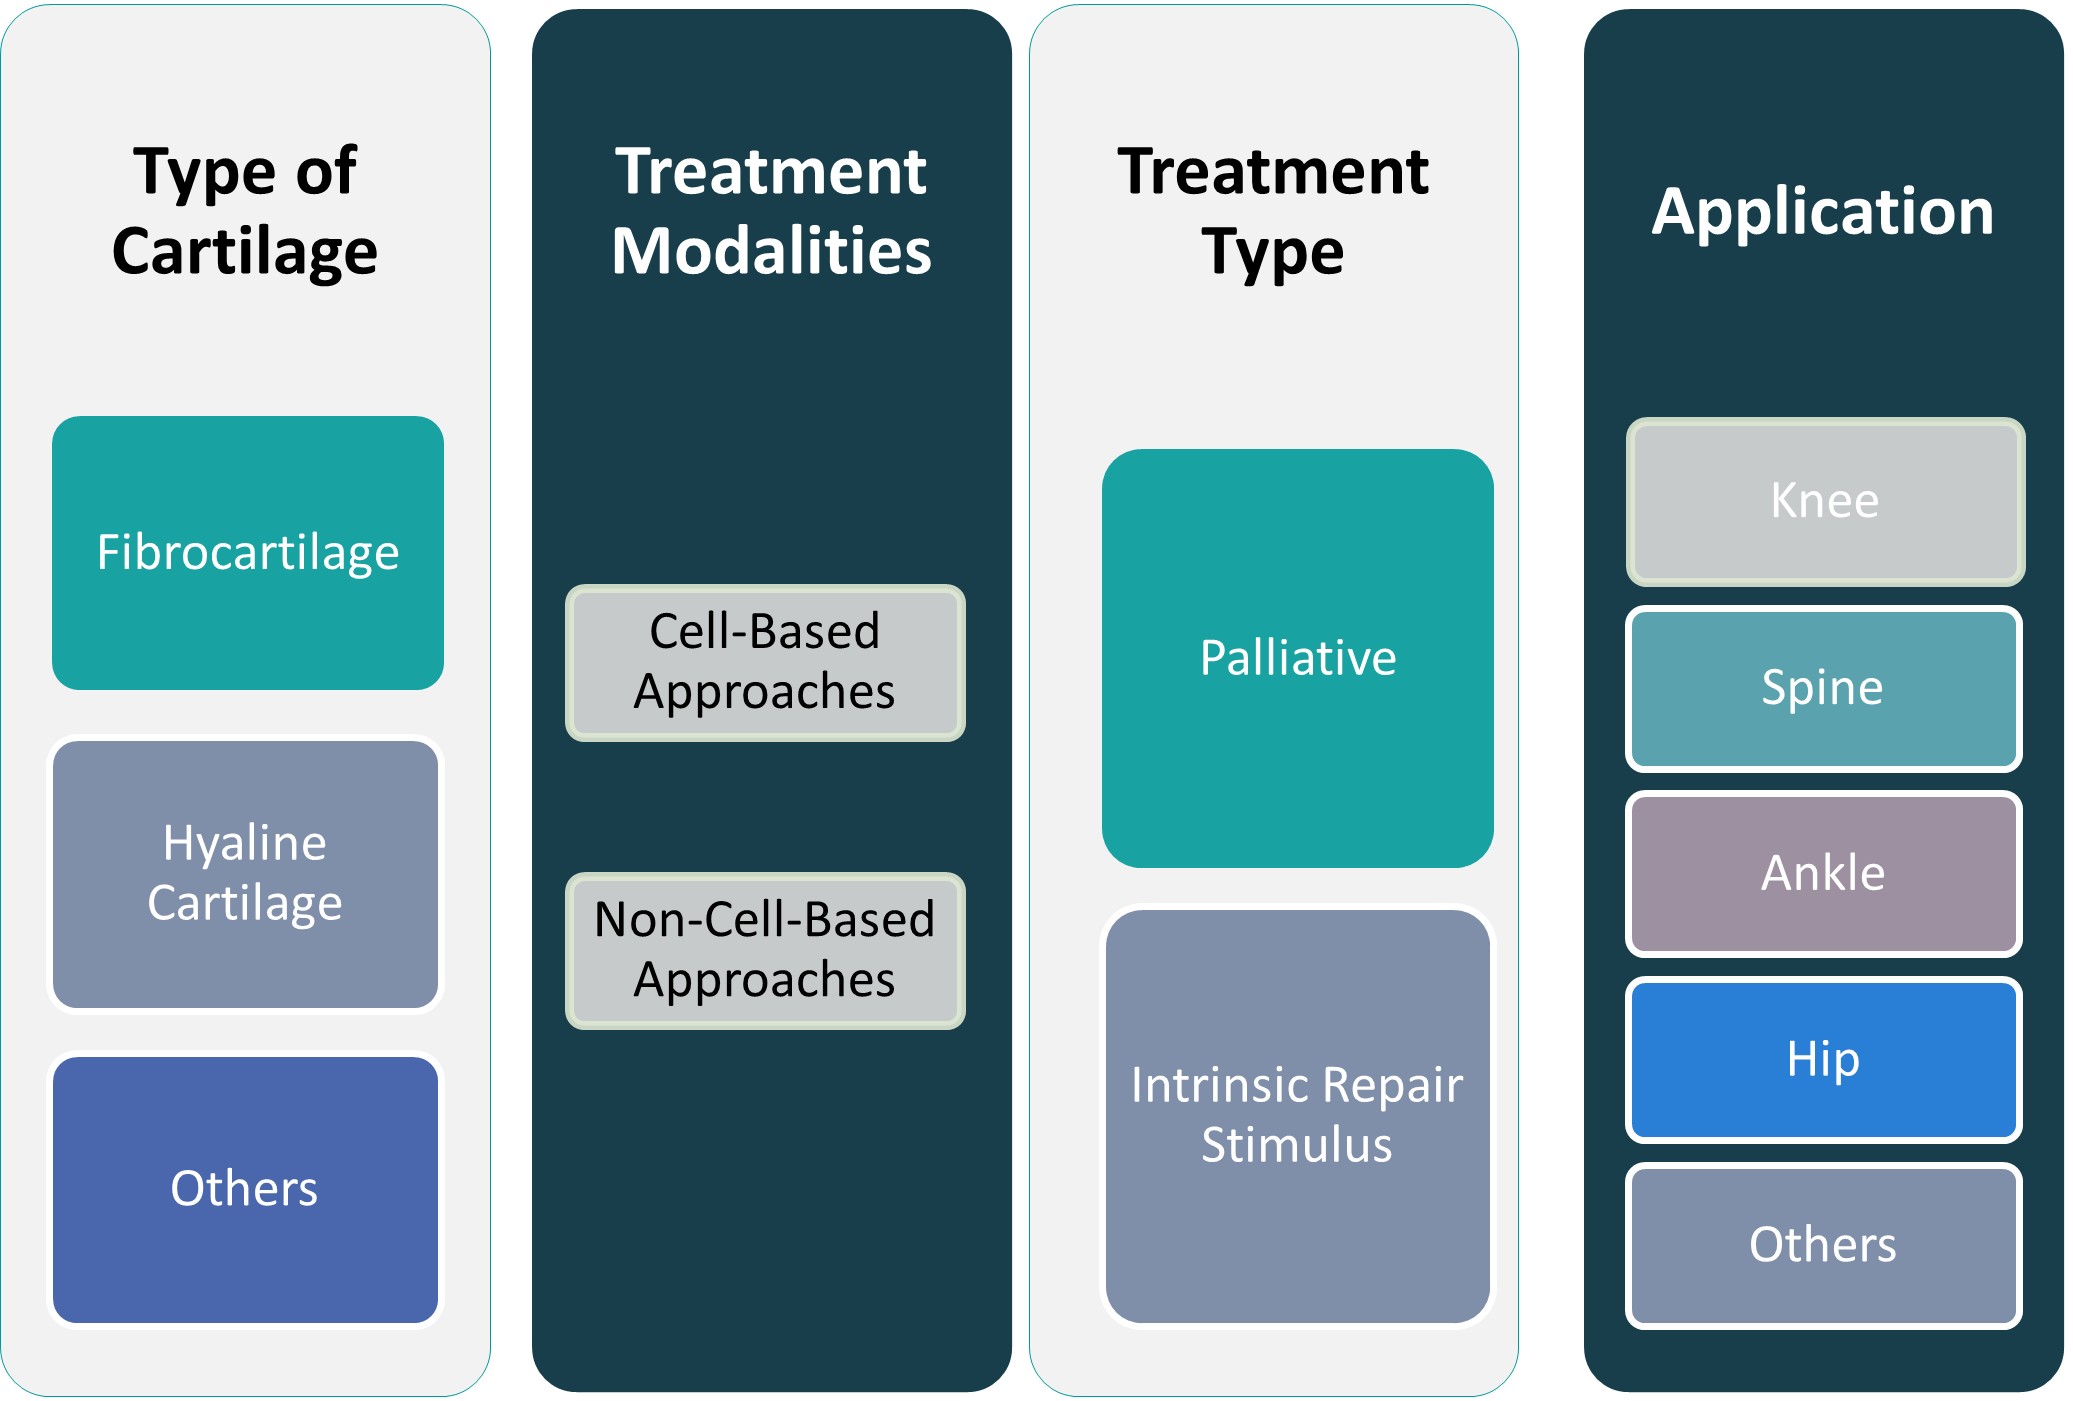
CHAPTER NO. 6 : EUROPE CARTILAGE REPAIR REGENERATION MARKET – BY TYPE OF CARTILAGE SEGMENT ANALYSIS 36
6.1. Europe Cartilage Repair Regeneration Market Overview, by Type of Cartilage Segment 36
6.1.1. Europe Cartilage Repair Regeneration Market Revenue Share, By Type of Cartilage, 2023 & 2032 37
6.1.2. Europe Cartilage Repair Regeneration Market Attractiveness Analysis, By Type of Cartilage 38
6.1.3. Incremental Revenue Growth Opportunity, by Type of Cartilage, 2024 – 2032 38
6.1.4. Europe Cartilage Repair Regeneration Market Revenue, By Type of Cartilage, 2018, 2023, 2027 & 2032 39
6.2. Fibrocartilage 40
6.3. Hyaline Cartilage 41
6.4. Others 42
CHAPTER NO. 7 : EUROPE CARTILAGE REPAIR REGENERATION MARKET – BY TREATMENT MODALITIES SEGMENT ANALYSIS 43
7.1. Europe Cartilage Repair Regeneration Market Overview, by Treatment Modalities Segment 43
7.1.1. Europe Cartilage Repair Regeneration Market Revenue Share, By Treatment Modalities, 2023 & 2032 44
7.1.2. Europe Cartilage Repair Regeneration Market Attractiveness Analysis, By Treatment Modalities 45
7.1.3. Incremental Revenue Growth Opportunity, by Treatment Modalities, 2024 – 2032 45
7.1.4. Europe Cartilage Repair Regeneration Market Revenue, By Treatment Modalities, 2018, 2023, 2027 & 2032 46
7.2. Cell-Based Approaches 47
7.3. Non-Cell-Based Approaches 48
CHAPTER NO. 8 : EUROPE CARTILAGE REPAIR REGENERATION MARKET – BY TREATMENT TYPE SEGMENT ANALYSIS 49
8.1. Europe Cartilage Repair Regeneration Market Overview, by Treatment Type Segment 49
8.1.1. Europe Cartilage Repair Regeneration Market Revenue Share, By Treatment Type, 2023 & 2032 50
8.1.2. Europe Cartilage Repair Regeneration Market Attractiveness Analysis, By Treatment Type 51
8.1.3. Incremental Revenue Growth Opportunity, by Treatment Type, 2024 – 2032 51
8.1.4. Europe Cartilage Repair Regeneration Market Revenue, By Treatment Type, 2018, 2023, 2027 & 2032 52
8.2. Palliative 53
8.3. Intrinsic Repair Stimulus 54
CHAPTER NO. 9 : EUROPE CARTILAGE REPAIR REGENERATION MARKET – BY APPLICATION SEGMENT ANALYSIS 55
9.1. Europe Cartilage Repair Regeneration Market Overview, by Application Segment 55
9.1.1. Europe Cartilage Repair Regeneration Market Revenue Share, By Application, 2023 & 2032 56
9.1.2. Europe Cartilage Repair Regeneration Market Attractiveness Analysis, By Application 57
9.1.3. Incremental Revenue Growth Opportunity, by Application, 2024 – 2032 57
9.1.4. Europe Cartilage Repair Regeneration Market Revenue, By Application, 2018, 2023, 2027 & 2032 58
9.2. Knee 59
9.3. Spine 60
9.4. Ankle 61
9.5. Hip 62
9.6. Others 63
CHAPTER NO. 10 : CARTILAGE REPAIR REGENERATION MARKET – EUROPE 64
10.1. Europe 64
10.1.1. Key Highlights 64
10.1.2. Europe Cartilage Repair Regeneration Market Revenue, By Country, 2018 – 2023 (USD Million) 65
10.1.3. Europe Cartilage Repair Regeneration Market Revenue, By Type of Cartilage, 2018 – 2023 (USD Million) 66
10.1.4. Europe Cartilage Repair Regeneration Market Revenue, By Treatment Modalities, 2018 – 2023 (USD Million) 67
10.1.5. Europe Cartilage Repair Regeneration Market Revenue, By Treatment Type, 2018 – 2023 (USD Million) 68
10.1.6. Europe Cartilage Repair Regeneration Market Revenue, By Application, 2018 – 2023 (USD Million) 69
10.2. UK 70
10.3. France 70
10.4. Germany 70
10.5. Italy 70
10.6. Spain 70
10.7. Russia 70
10.8. Belgium 70
10.9. Netherland 70
10.10. Austria 70
10.11. Sweden 70
10.12. Poland 70
10.13. Denmark 70
10.14. Switzerland 70
10.15. Rest of Europe 70
CHAPTER NO. 11 : COMPANY PROFILES 71
11.1. Mathys Ltd Bettlach 71
11.1.1. Company Overview 71
11.1.2. Product Portfolio 71
11.1.3. Swot Analysis 71
11.1.4. Business Strategy 72
11.1.5. Financial Overview 72
11.2. Össur hf. 73
11.3. Medacta International 73
11.4. Collagen Solutions plc 73
11.5. Biocomposites Ltd 73
11.6. Company 6 73
11.7. Company 7 73
11.8. Company 8 73
11.9. Company 9 73
11.10. Company 10 73
List of Figures
FIG NO. 1. Europe Cartilage Repair Regeneration Market Revenue, 2018 – 2032 (USD Million) 22
FIG NO. 2. Porter’s Five Forces Analysis for Europe Cartilage Repair Regeneration Market 28
FIG NO. 3. Company Share Analysis, 2024 29
FIG NO. 4. Company Share Analysis, 2024 29
FIG NO. 5. Company Share Analysis, 2024 30
FIG NO. 6. Europe Cartilage Repair Regeneration Market – Company Revenue Market Share, 2024 31
FIG NO. 7. Europe Cartilage Repair Regeneration Market Revenue Share, By Type of Cartilage, 2023 & 2032 37
FIG NO. 8. Market Attractiveness Analysis, By Type of Cartilage 38
FIG NO. 9. Incremental Revenue Growth Opportunity by Type of Cartilage, 2024 – 2032 38
FIG NO. 10. Europe Cartilage Repair Regeneration Market Revenue, By Type of Cartilage, 2018, 2023, 2027 & 2032 39
FIG NO. 11. Europe Cartilage Repair Regeneration Market for Fibrocartilage, Revenue (USD Million) 2018 – 2032 40
FIG NO. 12. Europe Cartilage Repair Regeneration Market for Hyaline Cartilage, Revenue (USD Million) 2018 – 2032 41
FIG NO. 13. Europe Cartilage Repair Regeneration Market for Others, Revenue (USD Million) 2018 – 2032 42
FIG NO. 14. Europe Cartilage Repair Regeneration Market Revenue Share, By Treatment Modalities, 2023 & 2032 44
FIG NO. 15. Market Attractiveness Analysis, By Treatment Modalities 45
FIG NO. 16. Incremental Revenue Growth Opportunity by Treatment Modalities, 2024 – 2032 45
FIG NO. 17. Europe Cartilage Repair Regeneration Market Revenue, By Treatment Modalities, 2018, 2023, 2027 & 2032 46
FIG NO. 18. Europe Cartilage Repair Regeneration Market for Cell-Based Approaches, Revenue (USD Million) 2018 – 2032 47
FIG NO. 19. Europe Cartilage Repair Regeneration Market for Non-Cell-Based Approaches, Revenue (USD Million) 2018 – 2032 48
FIG NO. 20. Europe Cartilage Repair Regeneration Market Revenue Share, By Treatment Type, 2023 & 2032 50
FIG NO. 21. Market Attractiveness Analysis, By Treatment Type 51
FIG NO. 22. Incremental Revenue Growth Opportunity by Treatment Type, 2024 – 2032 51
FIG NO. 23. Europe Cartilage Repair Regeneration Market Revenue, By Treatment Type, 2018, 2023, 2027 & 2032 52
FIG NO. 24. Europe Cartilage Repair Regeneration Market for Palliative, Revenue (USD Million) 2018 – 2032 53
FIG NO. 25. Europe Cartilage Repair Regeneration Market for Intrinsic Repair Stimulus, Revenue (USD Million) 2018 – 2032 54
FIG NO. 26. Europe Cartilage Repair Regeneration Market Revenue Share, By Application, 2023 & 2032 56
FIG NO. 27. Market Attractiveness Analysis, By Application 57
FIG NO. 28. Incremental Revenue Growth Opportunity by Application, 2024 – 2032 57
FIG NO. 29. Europe Cartilage Repair Regeneration Market Revenue, By Application, 2018, 2023, 2027 & 2032 58
FIG NO. 30. Europe Cartilage Repair Regeneration Market for Knee, Revenue (USD Million) 2018 – 2032 59
FIG NO. 31. Europe Cartilage Repair Regeneration Market for Spine, Revenue (USD Million) 2018 – 2032 60
FIG NO. 32. Europe Cartilage Repair Regeneration Market for Ankle, Revenue (USD Million) 2018 – 2032 61
FIG NO. 33. Europe Cartilage Repair Regeneration Market for Hip, Revenue (USD Million) 2018 – 2032 62
FIG NO. 34. Europe Cartilage Repair Regeneration Market for Others, Revenue (USD Million) 2018 – 2032 63
FIG NO. 35. Europe Cartilage Repair Regeneration Market Revenue, 2018 – 2032 (USD Million) 64
List of Tables
TABLE NO. 1. : Europe Cartilage Repair Regeneration Market: Snapshot 21
TABLE NO. 2. : Drivers for the Europe Cartilage Repair Regeneration Market: Impact Analysis 24
TABLE NO. 3. : Restraints for the Europe Cartilage Repair Regeneration Market: Impact Analysis 26
TABLE NO. 4. : Europe Cartilage Repair Regeneration Market Revenue, By Country, 2018 – 2023 (USD Million) 65
TABLE NO. 5. : Europe Cartilage Repair Regeneration Market Revenue, By Country, 2024 – 2032 (USD Million) 65
TABLE NO. 6. : Europe Cartilage Repair Regeneration Market Revenue, By Type of Cartilage, 2018 – 2023 (USD Million) 66
TABLE NO. 7. : Europe Cartilage Repair Regeneration Market Revenue, By Type of Cartilage, 2024 – 2032 (USD Million) 66
TABLE NO. 8. : Europe Cartilage Repair Regeneration Market Revenue, By Treatment Modalities, 2018 – 2023 (USD Million) 67
TABLE NO. 9. : Europe Cartilage Repair Regeneration Market Revenue, By Treatment Modalities, 2024 – 2032 (USD Million) 67
TABLE NO. 10. : Europe Cartilage Repair Regeneration Market Revenue, By Treatment Type, 2018 – 2023 (USD Million) 68
TABLE NO. 11. : Europe Cartilage Repair Regeneration Market Revenue, By Treatment Type, 2024 – 2032 (USD Million) 68
TABLE NO. 12. : Europe Cartilage Repair Regeneration Market Revenue, By Application, 2018 – 2023 (USD Million) 69
TABLE NO. 13. : Europe Cartilage Repair Regeneration Market Revenue, By Application, 2024 – 2032 (USD Million) 69