CHAPTER NO. 1 : INTRODUCTION 18
1.1.1. Report Description 18
Purpose of the Report 18
USP & Key Offerings 18
1.1.2. Key Benefits for Stakeholders 18
1.1.3. Target Audience 19
1.1.4. Report Scope 19
CHAPTER NO. 2 : EXECUTIVE SUMMARY 20
2.1. Europe Pharmaceutical Contract Sales Organizations Market Snapshot 20
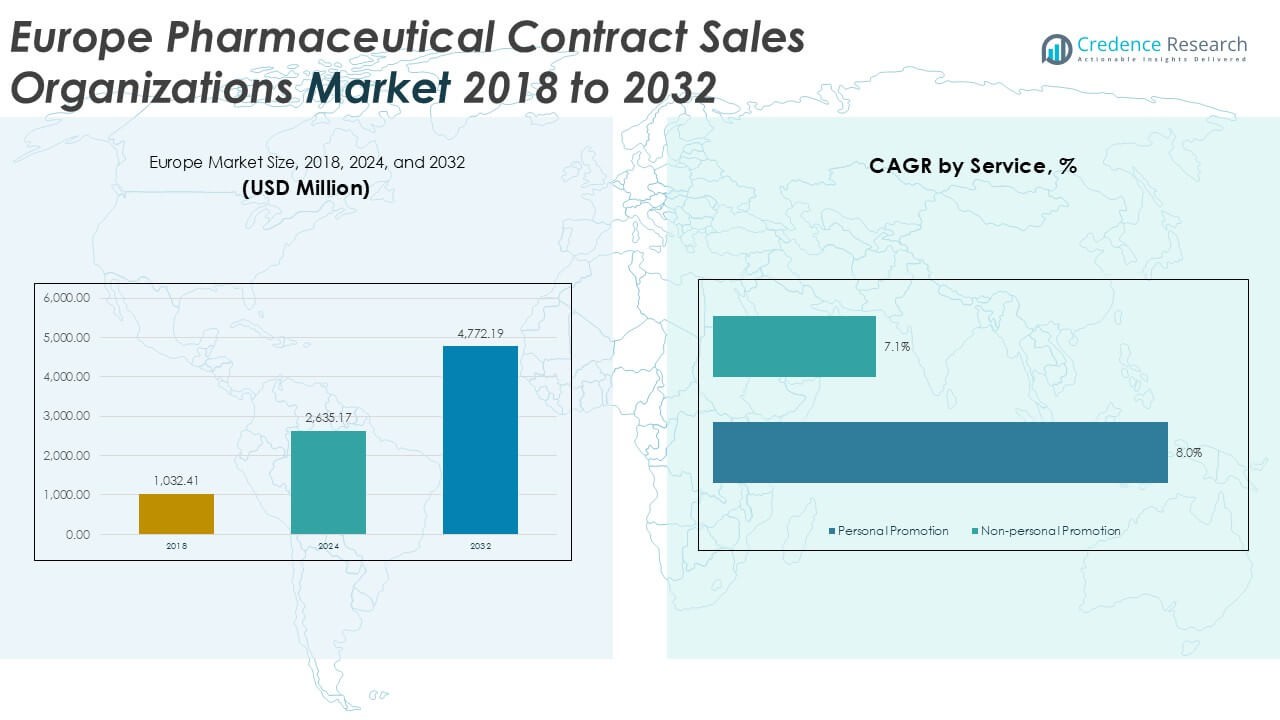
2.1.1. Europe Pharmaceutical Contract Sales Organizations Market, 2018 – 2032 (USD Million) 21
CHAPTER NO. 3 : EUROPE PHARMACEUTICAL CONTRACT SALES ORGANIZATIONS MARKET – INDUSTRY ANALYSIS 22
3.1. Introduction 22
3.2. Market Drivers 23
3.2.1. Increase the R&D activities on drugs and increase in the drug pipeline 23
3.2.2. Growing interest of pharmaceutical companies to increase the sales of the products 24
3.3. Market Restraints 25
3.3.1. Quality issues associated with outsourcing 25
3.4. Market Opportunities 26
3.4.1. Market Opportunity Analysis 26
3.5. Porter’s Five Forces Analysis 27
CHAPTER NO. 4 : ANALYSIS COMPETITIVE LANDSCAPE 28
4.1. Company Market Share Analysis – 2023 28
4.1.1. Europe Pharmaceutical Contract Sales Organizations Market: Company Market Share, by Volume, 2023 28
4.1.2. Europe Pharmaceutical Contract Sales Organizations Market: Company Market Share, by Revenue, 2023 29
4.1.3. Europe Pharmaceutical Contract Sales Organizations Market: Top 6 Company Market Share, by Revenue, 2023 29
4.1.4. Europe Pharmaceutical Contract Sales Organizations Market: Top 3 Company Market Share, by Revenue, 2023 30
4.2. Europe Pharmaceutical Contract Sales Organizations Market Company Revenue Market Share, 2023 31
4.3. Company Assessment Metrics, 2023 32
4.3.1. Stars 32
4.3.2. Emerging Leaders 32
4.3.3. Pervasive Players 32
4.3.4. Participants 32
4.4. Start-ups /SMEs Assessment Metrics, 2023 32
4.4.1. Progressive Companies 32
4.4.2. Responsive Companies 32
4.4.3. Dynamic Companies 32
4.4.4. Starting Blocks 32
4.5. Strategic Developments 33
4.5.1. Acquisitions & Mergers 33
New Product Launch 33
Regional Expansion 33
4.6. Key Players Product Matrix 35
CHAPTER NO. 5 : PESTEL & ADJACENT MARKET ANALYSIS 36
5.1. PESTEL 36
5.1.1. Political Factors 36
5.1.2. Economic Factors 36
5.1.3. Social Factors 36
5.1.4. Technological Factors 36
5.1.5. Environmental Factors 36
5.1.6. Legal Factors 36
5.2. Adjacent Market Analysis 36
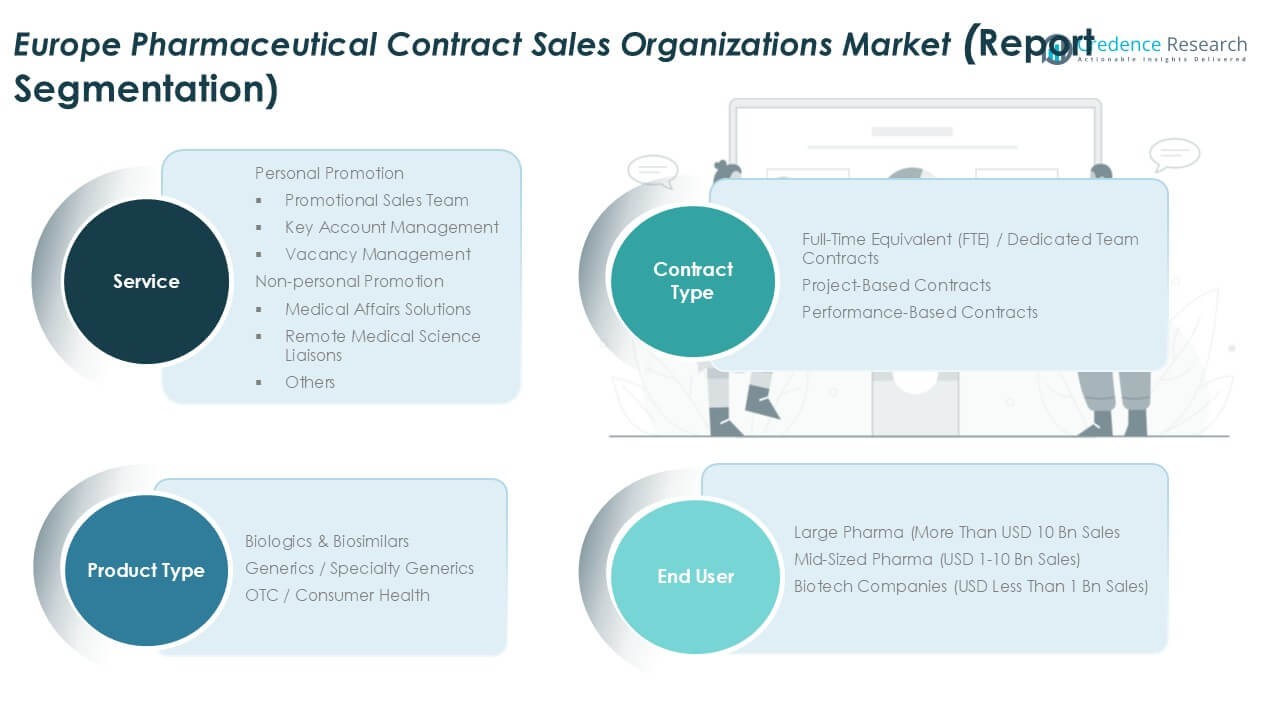
CHAPTER NO. 6 : EUROPE PHARMACEUTICAL CONTRACT SALES ORGANIZATIONS MARKET – BY SERVICE SEGMENT ANALYSIS 37
6.1. Europe Pharmaceutical Contract Sales Organizations Market Overview, by Service Segment 37
6.1.1. Europe Pharmaceutical Contract Sales Organizations Market Revenue Share, By Service, 2023 & 2032 38
6.1.2. Europe Pharmaceutical Contract Sales Organizations Market Attractiveness Analysis, By Service 39
6.1.3. Incremental Revenue Growth Opportunity, by Service, 2024 – 2032 39
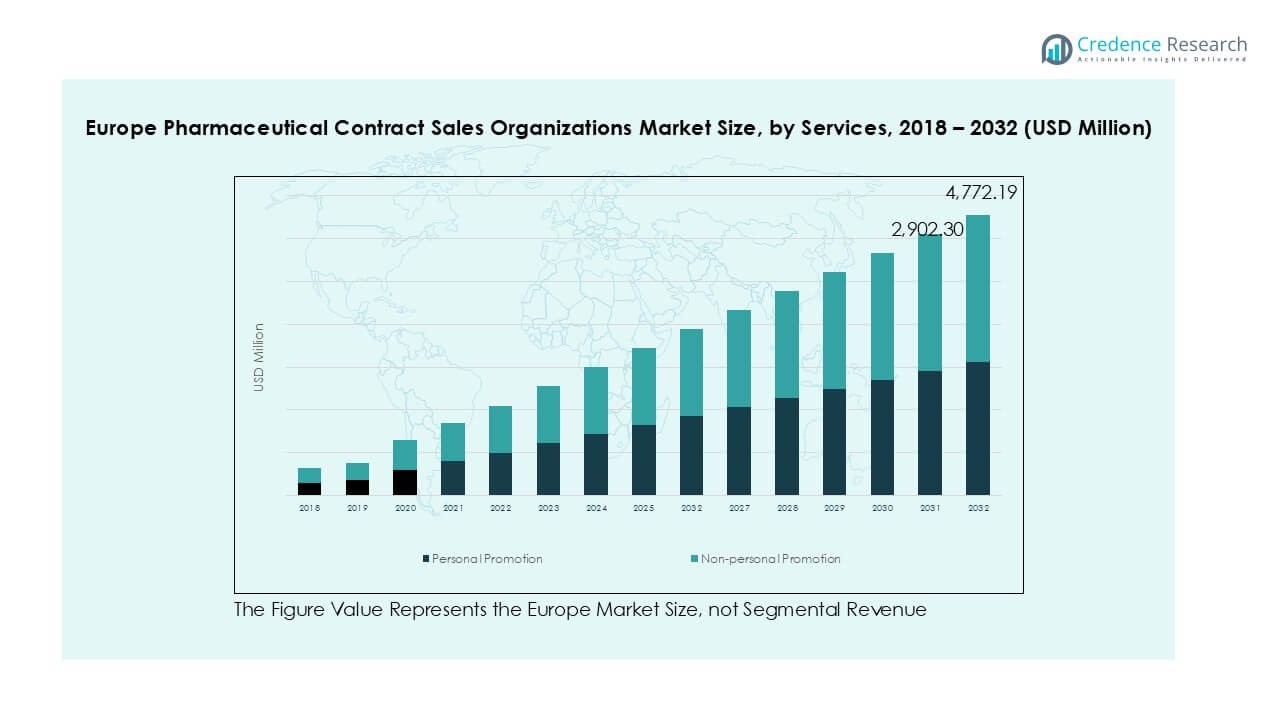
6.1.4. Europe Pharmaceutical Contract Sales Organizations Market Revenue, By Service, 2018, 2023, 2027 & 2032 40
6.2. Personal Promotion 41
6.2.1. Promotional Sales Team 42
6.2.2. Key Account Management 43
6.2.3. Vacancy Management 44
6.3. Non-personal Promotion 45
6.3.1. Medical Affairs Solutions 46
6.3.2. Remote Medical Science Liaisons 47
6.3.3. Nurse (Clinical) Educators 48
6.3.4. Others 49
CHAPTER NO. 7 : EUROPE PHARMACEUTICAL CONTRACT SALES ORGANIZATIONS MARKET – BY END-USE SEGMENT ANALYSIS 50
7.1. Europe Pharmaceutical Contract Sales Organizations Market Overview, by End-use Segment 50
7.1.1. Europe Pharmaceutical Contract Sales Organizations Market Revenue Share, By End-use, 2023 & 2032 51
7.1.2. Europe Pharmaceutical Contract Sales Organizations Market Attractiveness Analysis, By End-use 52
7.1.3. Incremental Revenue Growth Opportunity, by End-use, 2024 – 2032 52
7.1.4. Europe Pharmaceutical Contract Sales Organizations Market Revenue, By End-use, 2018, 2023, 2027 & 2032 53
7.2. Pharmaceutical Companies 54
7.3. Biopharmaceutical Companies 55
CHAPTER NO. 8 : PHARMACEUTICAL CONTRACT SALES ORGANIZATIONS MARKET – EUROPE 56
8.1. Europe 56
8.1.1. Key Highlights 56
8.1.2. Europe Pharmaceutical Contract Sales Organizations Market Revenue, By Country, 2018 – 2023 (USD Million) 57
8.1.3. Europe Pharmaceutical Contract Sales Organizations Market Revenue, By Service, 2018 – 2023 (USD Million) 58
8.1.4. Europe Pharmaceutical Contract Sales Organizations Market Revenue, By End-use, 2018 – 2023 (USD Million) 59
8.2. UK 60
8.3. France 60
8.4. Germany 60
8.5. Italy 60
8.6. Spain 60
8.7. Russia 60
8.8. Belgium 60
8.9. Netherland 60
8.10. Austria 60
8.11. Sweden 60
8.12. Poland 60
8.13. Denmark 60
8.14. Switzerland 60
8.15. Rest of Europe 60
CHAPTER NO. 9 : COMPANY PROFILES 61
9.1. CMIC Holdings Co., Ltd. 61
9.1.1. Company Overview 61
9.1.2. Product Portfolio 61
9.1.3. Swot Analysis 61
9.1.4. Business Strategy 62
9.1.5. Financial Overview 62
9.2. PDI Health 63
9.3. Charles River Laboratories 63
9.4. ManpowerGroup Solutions 63
9.5. Celerion 63
9.6. QFR Solutions 63
9.7. MaBico 63
9.8. Mednext Pharma Pvt. Ltd. 63
9.9. Peak Pharma Solutions Inc. 63
9.10. IQVIA, Inc. 63
9.11. Syneous Health 63
List of Figures
FIG NO. 1. Europe Pharmaceutical Contract Sales Organizations Market Revenue, 2018 – 2032 (USD Million) 21
FIG NO. 2. Porter’s Five Forces Analysis for Europe Pharmaceutical Contract Sales Organizations Market 27
FIG NO. 3. Company Share Analysis, 2023 28
FIG NO. 4. Company Share Analysis, 2023 29
FIG NO. 5. Company Share Analysis, 2023 29
FIG NO. 6. Company Share Analysis, 2023 30
FIG NO. 7. Europe Pharmaceutical Contract Sales Organizations Market – Company Revenue Market Share, 2023 31
FIG NO. 8. Europe Pharmaceutical Contract Sales Organizations Market Revenue Share, By Service, 2023 & 2032 38
FIG NO. 9. Market Attractiveness Analysis, By Service 39
FIG NO. 10. Incremental Revenue Growth Opportunity by Service, 2024 – 2032 39
FIG NO. 11. Europe Pharmaceutical Contract Sales Organizations Market Revenue, By Service, 2018, 2023, 2027 & 2032 40
FIG NO. 12. Europe Pharmaceutical Contract Sales Organizations Market for Personal Promotion, Revenue (USD Million) 2018 – 2032 41
FIG NO. 13. Europe Pharmaceutical Contract Sales Organizations Market for Promotional Sales Team, Revenue (USD Million) 2018 – 2032 42
FIG NO. 14. Europe Pharmaceutical Contract Sales Organizations Market for Key Account Management, Revenue (USD Million) 2018 – 2032 43
FIG NO. 15. Europe Pharmaceutical Contract Sales Organizations Market for Vacancy Management, Revenue (USD Million) 2018 – 2032 44
FIG NO. 16. Europe Pharmaceutical Contract Sales Organizations Market for Non-personal Promotion, Revenue (USD Million) 2018 – 2032 45
FIG NO. 17. Europe Pharmaceutical Contract Sales Organizations Market for Medical Affairs Solutions, Revenue (USD Million) 2018 – 2032 46
FIG NO. 18. Europe Pharmaceutical Contract Sales Organizations Market for Remote Medical Science Liaisons, Revenue (USD Million) 2018 – 2032 47
FIG NO. 19. Europe Pharmaceutical Contract Sales Organizations Market for Nurse (Clinical) Educators, Revenue (USD Million) 2018 – 2032 48
FIG NO. 20. Europe Pharmaceutical Contract Sales Organizations Market for Others, Revenue (USD Million) 2018 – 2032 49
FIG NO. 21. Europe Pharmaceutical Contract Sales Organizations Market Revenue Share, By End-use, 2023 & 2032 51
FIG NO. 22. Market Attractiveness Analysis, By End-use 52
FIG NO. 23. Incremental Revenue Growth Opportunity by End-use, 2024 – 2032 52
FIG NO. 24. Europe Pharmaceutical Contract Sales Organizations Market Revenue, By End-use, 2018, 2023, 2027 & 2032 53
FIG NO. 25. Europe Pharmaceutical Contract Sales Organizations Market for Pharmaceutical Companies, Revenue (USD Million) 2018 – 2032 54
FIG NO. 26. Europe Pharmaceutical Contract Sales Organizations Market for Biopharmaceutical Companies, Revenue (USD Million) 2018 – 2032 55
FIG NO. 27. Europe Pharmaceutical Contract Sales Organizations Market Revenue, 2018 – 2032 (USD Million) 56
List of Tables
TABLE NO. 1. : Europe Pharmaceutical Contract Sales Organizations Market: Snapshot 20
TABLE NO. 2. : Drivers for the Europe Pharmaceutical Contract Sales Organizations Market: Impact Analysis 23
TABLE NO. 3. : Restraints for the Europe Pharmaceutical Contract Sales Organizations Market: Impact Analysis 25
TABLE NO. 4. : Europe Pharmaceutical Contract Sales Organizations Market Revenue, By Country, 2018 – 2023 (USD Million) 57
TABLE NO. 5. : Europe Pharmaceutical Contract Sales Organizations Market Revenue, By Country, 2024 – 2032 (USD Million) 57
TABLE NO. 6. : Europe Pharmaceutical Contract Sales Organizations Market Revenue, By Service, 2018 – 2023 (USD Million) 58
TABLE NO. 7. : Europe Pharmaceutical Contract Sales Organizations Market Revenue, By Service, 2024 – 2032 (USD Million) 58
TABLE NO. 8. : Europe Pharmaceutical Contract Sales Organizations Market Revenue, By End-use, 2018 – 2023 (USD Million) 59
TABLE NO. 9. : Europe Pharmaceutical Contract Sales Organizations Market Revenue, By End-use, 2024 – 2032 (USD Million) 59